Get Data
Summary:
This data set contains one net primary productivity (NPP) data file and two climate data files (.txt format). The NPP file contains above- and below- ground biomass, litterfall, standing litter crop, and nutrient content data for a moist semi-deciduous secondary tropical forest at the Kade Agricultural Research Station (6.15 N 0.92 W), Ghana, spanning several collections periods between 1957 and 1972. Climate data come from weather stations at Kade near the study site (1958-1997) and at Kumasi near Kade (1945-1990).
The Kade study site is typical of an old secondary forest which has probably not been cultivated or harvested since 1915-1925. Tree basal area measured in 1957 was quite high at 33.7 m2/ha; measurements in 1968 of a plot a few hundred meters away gave 30.6 m2/ha.
Detailed above- and below-ground biomass data are provided from a single clear-felling made in 1957. Nutrient content for lianas, leaves and twigs, branches, large wood, standing dead wood, stumps, litter, and roots is also provided. Total live + dead biomass was 36,102 g/m2, of which 5,414 g/m2 (15%) was below-ground live biomass and 23,568 g/m2 was above-ground live biomass. Monthly litterfall is available for 26 months (1970-72).
Total annual NPP was estimated in the late 1950s at about 2,400 g/m2/year based on litterfall of 1,054 g/m2/year plus rough estimates of timber fall (1,070-1,121 g/m2/year) and root production (258 g/m2/year). In the 1970s, NPP was recalculated at 2,200-2,500 g/m2/year based on additional measurements of litter, wood fall, and decomposition.
Revision Notes: Only the documentation for this data set has been modified. The data file have been checked for accuracy and are identical to those originally published in 1998.
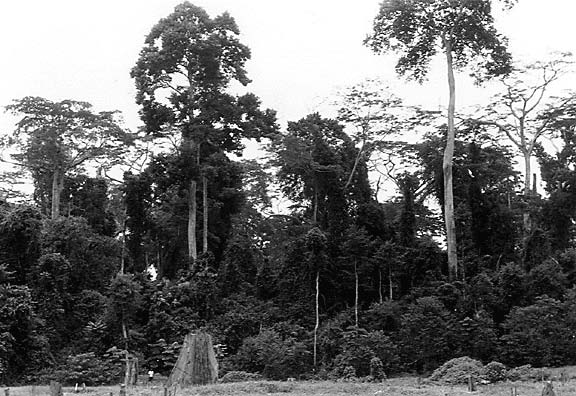
Figure 1. Experimental area of 50-year-old secondary forest at the Kade tropical forest site, Ghana. (See man standing near buttress stump for scale. Photograph taken 1958 by Dr. P. H. Nye, Beckley, Oxon., UK).
Additional Documentation:
The Net Primary Productivity (NPP) data collection contains field measurements of biomass, estimated NPP, and climate data for terrestrial grassland, tropical forest, boreal forest, and tundra sites worldwide. Data were compiled from the published literature for intensively studied and well-documented individual field sites and from a number of previously compiled multi-site, multi-biome data sets of georeferenced NPP estimates. The principal compilation effort (Olson et al., 2001) was sponsored by the NASA Terrestrial Ecology Program. For more information, please visit the NPP web site at http://daac.ornl.gov/NPP/npp_home.html.
Data Citation:
Cite this data set as follows:
Nye, P.H., and D.J. Greenland. 2013. NPP Tropical Forest: Kade, Ghana, 1957-1972, R1. Data set. Available on-line [http://daac.ornl.gov] from Oak Ridge National Laboratory Distributed Active Archive Center, Oak Ridge, Tennessee, USA. doi:10.3334/ORNLDAAC/216
This data set was originally published as:
Nye, P.H., and
D.J. Greenland. 1998. NPP Tropical Forest: Kade, Ghana, 1957-1972. Data set.
Available on-line [http://daac.ornl.gov] from Oak Ridge National Laboratory
Distributed Active Archive Center, Oak Ridge, Tennessee, U.S.A.
Table of Contents:
- 1 Data Set Overview
- 2 Data Description
- 3 Applications and Derivation
- 4 Quality Assessment
- 5 Acquisition Materials and Methods
- 6 Data Access
- 7 References
1. Data Set Overview:
Project: Net Primary Productivity (NPP)
The NPP measurement is based on litterfall + timber fall + root production in a 50-year-old secondary tropical forest at the Kade Agricultural Research Station of the former University College, Ghana. NPP estimates made in the late 1950s on the basis of standing biomass accumulation and litterfall were recalculated in the 1970s based on additional measurements of litter, wood fall, and decomposition.
The Kade study site (6.15 N 0.92 W) is situated near the town of Kade, 100 km northwest of Accra or about mid-way between Accra and Kumasi. It consists of a moist semi-deciduous forest characterized by the Celtis-Triplochiton association, typical of old secondary forests. It had probably not been cultivated since around 1915-1925. Tree basal area measured in 1957 was quite high at 145 square feet per acre (33.7 m2/ha); measurements in 1968 of a plot a few hundred meters away gave a similar measurement of 30.6 m2/ha.
Detailed data are available from a single clear-felling made in 1957, including biomass and nutrient content (N, P, K, Ca, Mg) for lianas, trash (leaves/twigs), branches, large wood, standing dead wood, stumps (above- and below-ground), litter, and roots. Total live + dead biomass was 36,102 g/m2, of which 5,414 g/m2 (15%) was below-ground live biomass and 23,568 g/m2 was above-ground live biomass. Monthly litterfall is available for 26 months, 1970-72, with a single 6-month estimate of wood litterfall and decomposition rates for various litter categories.
Total annual NPP was estimated for the late 1950s at about 2,400 g/m2/year, based on litterfall of 1,054 g/m2/year plus rough estimates of timber fall (1,070-1,121 g/m2/year) and root production (258 g/m2/year). In the 1970s, NPP was recalculated at 2,200-2,500 g/m2/year. Additional detailed data are available in the literature on botanical composition and root size distribution, plus root distribution by depth in 15-year and 50-year undisturbed plots. Diurnal microclimate data at different positions in the canopy and soil are available for several stations along a catena.
The ANPP, BNPP, and TNPP estimates reported in Scurlock and Olson (2013), Olson et al. (2013a, 2013b), and Clark et al. (2001a, 2013) agree with the values provided in this data set.
Climate data come from weather stations at Kade near the study site (1958-1997) and at Kumasi near Kade (1945-1990).
2. Data Description:
Spatial Coverage
Site: Kade, Ghana
Site Boundaries:(All latitude and longitude given in decimal degrees)
| Site (Region) | Westernmost Longitude | Easternmost Longitude | Northernmost Latitude | Southernmost Latitude | Elevation (m) |
|---|---|---|---|---|---|
| Kade, Ghana | -0.92 | -0.92 | 6.15 | 6.15 | 150 |
Spatial Resolution
The study area for harvesting above- and below-ground biomass (Greenland and Kowal, 1960) consists of two blocks, each approximately 66 m x 37 m. Litter was collected from 12 plots, each approximately 4.57 m x 3.66 m. Roots were extracted from pits measuring approximately 1.52 m long x 0.914 m wide x 1.23 m deep. Litterfall was collected by Nye (1961) using six 0.9-m x 1.8-m litter traps. Small litterfall was collected by John (1973) using twenty 1-m2 litter traps randomly positioned in eight 0.25-hectare plots. The fall of wood litter was determined using a single sample area of 0.25 ha. The weight of small litter lying on the forest floor was determined using 1-m2 quadrats.
Temporal Coverage
Above- and below-ground live biomass measurements were made by harvest methods in January 1957. Nutrient concentration in vegetation was determined from the 1957 samples. Standing crop of litter was determined in January 1957 (Greenland and Kowal, 1960). Small litterfall was collected in May 1958 to April 1959 (Nye, 1961), and again from May 1970 to June 1972 (John, 1973). Wood litterfall was collected in April 1971 (John, 1973). Twenty-six samples of litter on the forest floor were obtained at random intervals during 1971 (John, 1973).
Climate data are available for the 1945-1990 and 1982-1997 periods, with means for 1958-1968, 1964-1990, and 1982-1997.
Temporal Resolution
Biomass harvest was made once. Litter on the forest floor was collected on two separate occasions, 14 years apart. Small litterfall was collected bi-weekly for one year (Nye, 1961) and monthly over a period of 26 months (John, 1973). A single 6-month collection of wood litterfall was made. Standing crop of litter was determined by randomly sampling the ground litter throughout a year. All NPP estimates are based on plant dry matter accumulation, expressed as g/m2 (dry matter weight).
Climate data are expressed as monthly and annual precipitation amounts (mm), mean number of rain days for month, monthly and annual mean maximum/minimum temperature (C), and mean average temperature for month or year (C).
Data File Information
Table 1. Data files in this data set archive
| FILE NAME | TEMPORAL COVERAGE | FILE CONTENTS |
|---|---|---|
| kde_npp.txt | 1957/01/01-1972/06/30 | Above- and below-ground biomass, litterfall, standing litter crop, and nutrient content data for a secondary tropical forest at Kade, Ghana |
| kde1_cli.txt | 1958/01/01-1997/12/31 | Monthly and annual precipitation amount and mean monthly and annual maximum/minimum temperature from a weather station at the Kade Agricultural Research Station near the study site |
| kde2_cli.txt | 1945/01/01-1990/12/31 | Monthly and annual precipitation amount and mean monthly and annual maximum/minimum temperature from a weather station at Kumasi near Kade, Ghana |
NPP Data.
NPP estimates for the Kade, Ghana site are provided in one text file (.txt format) (Table 1). The variable values are delimited by semicolons. The first 18 lines are metadata; data records begin on line 19. The value -999.9 is used to denote missing values. Biomass and NPP units are in g/m2 and g/m2/year (dry matter weight), respectively. Nutrient content is reported as percentage of dry matter weight.
Table 2. Column headings in NPP file
| Column Heading | Description | Units |
|---|---|---|
| Site | Site where data were gathered (code refers to site identification) | Text |
| Treatmt | Long-term management of site (described in metadata in data file) | Text |
| Year | Year in which data were collected | Numeric |
| Month | Month in which data were collected | |
| Day | Day on which data were collected | |
| parameter | Parameters measured (see definitions in Table 3) | Text |
| amount | Data values | Numeric |
| units | Unit of measure | Text |
Table 3. Parameter definitions in NPP file
| Parameter | Description | Units | Source |
|---|---|---|---|
| leaftwig | Leaf and twig (< 5-cm diameter) biomass, including what fell on the ground as the trees were being harvested | g/m2 | Table 11 |
| climbers | Biomass of all climbing plants (lianas), complete with their leaf and twig portions | ||
| branches | Biomass of all wood 5-cm to 30-cm diameter | ||
| trunks | Biomass of tree trunks > 30-cm diameter | ||
| stdead | Biomass of large dead wood not included in litter | ||
| litter | Biomass of all material lying on the surface of the ground and not incorporated with the soil, except large dead wood | ||
| AGstump | Biomass of above-ground parts of larger stumps (stem portion of stump) | ||
| BGstump | Biomass of below-ground parts of larger stumps (root portion of stump) | ||
| Totroots | Root biomass, including all plant material below ground except the underground parts of larger stumps | ||
| BGbiomass | Below-ground biomass (total roots + underground parts of stumps) | g/m2 | by addition |
| AGbiomass | Above-ground live biomass (leaf & twigs + lianas + branches + trunks) | g/m2 | by addition |
| AGTotmatter | Total above-ground biomass (above-ground live biomass + large dead wood + litter) | g/m2 | by addition |
| leaftwig-N | Nitrogen concentration in leaves and twigs | percent | Table 21 |
| climbers-N | Nitrogen concentration in lianas | ||
| branches-N | Nitrogen concentration in branches | ||
| trunks-N | Nitrogen concentration in trunks | ||
| stdead-N | Nitrogen concentration in dead wood | ||
| litter-N | Nitrogen concentration in litter | ||
| AGstump-N | Nitrogen concentration in above-ground portion of tree stumps | ||
| BGstump-N | Nitrogen concentration in below-ground portion of tree stumps | ||
| Totroots-N | Nitrogen concentration in roots | ||
| leaftwig-P | Phosphorus concentration in leaves and twigs | percent | Table 21 |
| climbers-P | Phosphorus concentration in lianas | ||
| branches-P | Phosphorus concentration in branches | ||
| trunks-P | Phosphorus concentration in trunks | ||
| stdead-P | Phosphorus concentration in dead wood | ||
| litter-P | Phosphorus concentration in litter | ||
| AGstump-P | Phosphorus concentration in above-ground portion of tree stumps | ||
| BGstump-P | Phosphorus concentration in below-ground portion of tree stumps | ||
| Totroots-P | Phosphorus concentration in roots | ||
| leaftwig-K | Potassium concentration in leaves and twigs | percent | Table 21 |
| climbers-K | Potassium concentration in lianas | ||
| branches-K | Potassium concentration in branches | ||
| trunks-K | Potassium concentration in tree trunks | ||
| stdead-K | Potassium concentration in large dead wood | ||
| litter-K | Potassium concentration in litter | ||
| AGstump-K | Potassium concentration in above-ground tree stumps | ||
| BGstump-K | Potassium concentration in below-ground tree stumps | ||
| Totroots-K | Potassium concentration in roots | ||
| leaflitter | Leaf litter accumulated on forest floor over one year (standing crop) | g/m2/year | Table 22 |
| branchlitter | Small twig litter (< 2.5-cm diam.) accumulated on forest floor over coarse of one year (standing crop) | ||
| otherlitter | Fruit, seed & flower litter accumulated on forest floor over coarse of one year (standing crop) | ||
| deadwood | Small wood litter (2.5-5.0 cm diam.) and large wood litter (5-33 cm diam.) accumulated on forest floor and snagged in canopy over coarse of one year (standing crop) | ||
| Totlitter | Total litter accumulated on forest floor (standing crop of leaf + twig + fruits, seeds & flowers + small wood + large wood) | g/m2/year | by addition |
| Totlittfall | Total annual litterfall (leaves + twigs + small wood) | g/m2/year | p. 336, Nye (1961) |
| leaflittfall | Annual leaf litterfall | g/m2/year | p. 336, Nye (1961) |
| Totlittfall | Annual total litterfall (leaves + twigs + fruits, seeds & flowers + trash) | g/m2/year | Table 12,3 |
| leaflittfall | Annual leaf litterfall | ||
| woodlittfall | Annual twig litterfall | ||
| frtflolittfall | Annual fruit, seed, and flower litterfall | ||
| otherlittfall | Annual trash litterfall (unidentifiable litter) | ||
| Totlittfall | Monthly total litterfall (leaves + twigs + fruits, seeds, & flowers + trash) | g/m2 | Figure 12,3 |
| woodlittfall | Monthly twig litterfall | g/m2 | Figure 12,3 |
| otherlittfall | Monthly trash litter fall (unidentifiable litter) | g/m2 | Figure 12,3 |
Notes: 1Greenland and Kowal (1960). 2John (1973). 3Sum of data for upper and middle slope plots.
Sample NPP Data Record
| Site; Treatmt; Year; Month; Day;
parameter; amount; units kde; none; 1957; 1; -999.9; leaftwig; 2553; g/m2 kde; none; 1957; 1; -999.9; climbers; 1446; g/m2 kde; none; 1957; 1; -999.9; branches; 6445; g/m2 kde; none; 1957; 1; -999.9; trunks; 10872; g/m2 kde; none; 1957; 1; -999.9; stdead; 7185; g/m2 kde; none; 1957; 1; -999.9; litter; 226; g/m2 kde; none; 1957; 1; -999.9; AGstump; 1961; g/m2 kde; none; 1957; 1; -999.9; BGstump; 2937; g/m2 kde; none; 1957; 1; -999.9; Totroots; 2477; g/m2 kde; none; 1957; 1; -999.9; BGbiomass; 5414; g/m2 kde; none; 1957; 1; -999.9; AGbiomass; 23277; g/m2 kde; none; 1957; 1; -999.9; AGTotmatter; 30688; g/m2 ... |
Climate Data
Climate data for the Kade, Ghana site are provided in two text files (.txt format) (Table 1). The first 18 lines are metadata; data records begin on line 19. The variable values are delimited by semicolons. There are no missing values.
Sample Climate Data Record <kde1_cli.txt>
| Site;Temp;Parm; Jan; Feb; Mar; Apr; May;
Jun; Jul; Aug; Sep; Oct; Nov; Dec; Year kde ;men1;tmin; 21.6; 22.4; 22.6; 22.6; 22.9; 22.1; 21.8; 21.6; 22.4; 22.4; 22.4; 22.1; 30.8 kde ;men1;tmax; 30.5; 33.4; 33.4; 32.6; 32.9; 28.9; 28.7; 27.9; 28.9; 30.0; 31.1; 30.5; 22.2 kde ;men2;tavg; 26.3; 27.5; 27.8; 27.7; 27.1; 26.3; 25.3; 25.1; 25.9; 26.8; 27.0; 26.5; 26.6 kde ;men2;rndy; 2; 6; 11; 12; 15; 16; 14; 14; 16; 18; 13; 5; 142 kde ;men2;prec; 18; 71; 173; 172; 207; 200; 145; 109; 165; 211; 118; 48; 1637 kde ;men3;prec; 12.8; 64.8; 127.6; 143.9; 169.2; 211.9; 127.4; 90.9; 128.0; 180.5; 100.8; 33.8; 1391.5 kde ;stdv;prec; 21.9; 55.0; 57.0; 52.7; 71.8; 101.6; 70.2; 62.9; 72.8; 55.7; 69.3; 28.0; 196.4 kde ;1982;prec; 0.0; 41.3; 159.9; 135.2; 132.2; 303.8; 115.1; 55.5; 7.3; 143.5; 130.2; 46.0; 1270.0 kde ;1983;prec; 0.0; 9.9; 64.2; 222.9; 184.7; 332.8; 25.9; 12.8; 183.0; 208.0; 25.2; 90.8; 1360.2 ... Where, Temp (temporal) - specific year or long-term statistic: men1 = mean over 10 years (1958-1968?) interpolated from published graph men2 = mean 1964-1990 (Ghana Meteorological Services Department) men3 = mean 1982-1997 (University of Legon Agricultural Research Station) stdv = standard deviation based on 1982-1997 Parm (parameter): prec = precipitation for month or year (mm) rndy = mean number of rain days for month tmin = mean minimum temperature for month or year (C) tmax = mean maximum temperature for month or year (C) tavg = mean average temperature for month or year (C) |
Sample Climate Data Record <kde2_cli.txt>
| Site;Temp;Parm; Jan; Feb; Mar; Apr; May;
Jun; Jul; Aug; Sep; Oct; Nov; Dec; Year; kms ;mean;prec; 19.2; 65.3; 136.0; 138.1; 178.0; 217.5; 144.5; 85.0; 163.4; 174.9; 83.4; 28.1; 1428.9; kms ;mean;tmax; 31.7; 33.2; 32.7; 32.1; 31.2; 29.4; 27.8; 27.4; 28.5; 30.0; 31.0; 30.7; 33.3; kms ;mean;tmin; 20.0; 21.5; 21.9; 22.2; 22.0; 21.6; 21.1; 20.7; 21.2; 21.3; 21.5; 20.6; 19.6; kms ;numb;prec; 45; 46; 46; 46; 46; 46; 46; 46; 46; 46; 46; 46; 46; kms ;numb;tmax; 46; 46; 46; 46; 46; 46; 46; 46; 46; 46; 46; 46; 46; kms ;numb;tmin; 46; 46; 46; 46; 46; 46; 46; 46; 46; 46; 46; 46; 46; kms ;stdv;prec; 24.7; 42.6; 57.3; 54.0; 70.3; 77.5; 101.6; 75.7; 72.8; 74.5; 50.1; 25.1; 287.7; kms ;stdv;tmax; 0.8; 0.9; 0.8; 0.6; 0.6; 0.5; 0.6; 0.8; 0.6; 0.5; 0.7; 0.5; 0.9; kms ;stdv;tmin; 1.3; 1.1; 0.7; 0.6; 0.5; 0.4; 0.4; 0.6; 0.4; 0.4; 0.6; 0.7; 0.8; kms ;1945;prec; 42.0; 52.0; 52.0; 170.0; 189.0; 191.0; 60.0; 21.0; 212.0; 195.0; 92.0; 2.0; 1278.0; kms ;1945;tmax; 31.2; 32.3; 33.2; 32.3; 31.8; 29.7; 27.5; 27.2; 28.4; 29.8; 30.3; 29.8; 33.2; kms ;1945;tmin; 19.0; 20.1; 22.0; 22.3; 22.4; 21.9; 20.9; 20.6; 21.2; 21.0; 20.9; 19.2; 19.0; ... Where, Temp (temporal) - specific year or long-term statistic: mean = mean based on all years numb = number of years stdv = standard deviation based on all years Parm (parameter): prec = precipitation for month or year (mm) tmin = mean minimum temperature for month or year (C) tmax = mean maximum temperature for month or year (C) |
3. Data Application and Derivation:
The accumulation of biomass, or NPP, is the net gain of carbon by photosynthesis that remains after plant respiration. While there are many fates for this carbon, this data set accounts for litterfall, timber fall, and root production. These are considered the major components of NPP.
Greenland and Kowal's (1960) study was undertaken to assess the effect of tropical forest vegetation on tropical soils by determining what quantities of the nutrient elements are taken up and stored in above- and below-ground biomass. Their results account for the measurement of the total dry matter and the nutrient capital accumulated in the aerial parts and roots of a 50-year-old secondary tropical forest. Nye's (1961) study was designed primarily to estimate the rate of turnover of organic matter and nutrients in the same forest (i.e., the return of organic matter and nutrients from the vegetation to the soil from litterfall, timber fall, root decomposition, and nutrient excretion from roots, and rain wash from the standing vegetation). John's (1973) study was undertaken to measure the rate and pattern of accumulation of various categories of litter falling from the canopy, and the rate of decay of this litter on the forest floor, extending over several growing seasons.
The tropical forest biomass data for the Kade study site are provided for comparison with models and estimation of NPP. Climate data are provided for use in driving ecosystem/NPP models.
4. Quality Assessment:
At the time of this study there were few data from the tropics to compare with the results from Kade. Greenland and Kowal (1960) compared the biomass estimates from the 50-year-old forest at Kade with data for a 18-year-old forest in a similar environment at Yangambim, Belgian Congo. For the amount of stem timber in a primary forest similar to that at Kade, estimates have been made in the Ivory Coast, and the values agree. Nutrient concentrations in different component of vegetation at Kade were also compared with data from forests at Kumasi, Ghana, Belgian Congo, and other parts of the world.
The Kade figures for net production are of the same order of magnitude as those for other forests in the region with the possible exception of the high values found in Zaire (i.e., a high altitude forest in central Africa and thus not strictly comparable). Litterfall estimates for Kade in the early 1970s (John, 1973) were comparable to values obtained for forest areas in other parts of West Africa. However, the John (1973) estimate of total litterfall was significantly lower than that found at Kade in the late 1950s by Nye (1961); the latter estimate included small wood litterfall. In contrast, the John (1973) estimates of ground litter were significantly greater than the dry weight figure found by Greenland and Kowal (1960) at Kade; the latter values represent litter collected only at one time of the year (January) which is before the period of maximum litterfall. Otherwise, the Kade results, especially those for leaf litterfall, are not too different from those reported for other forests in the region.
Sources of Error
Greenland and Kowal (1960) provide a detailed account of the errors in determining biomass and nutrient concentrations in the vegetation.
5. Data Acquisition Materials and Methods:
Site Information
The research forest is located within the grounds of the Kade Agricultural Research Station of the former University College, Ghana, at an elevation of 150 m. Much of the 1,093-ha Research Station has been developed for agricultural purposes but some parts of the forest, including the research site described herein, had not been disturbed for 50 years at the time these studies took place. The research forest lies within the part of the High Forest Zone described by Taylor (1952) in an ecotone between the moist semi-deciduous and the moist evergreen forest. It is typical of an old secondary forest, containing a wide range of species assorted among a fairly open shrub layer, a dense lower story extending from some 3-m to 16-m, and a more scattered upper story extending to 40-m with occasional massive-crowned emergents rising through it. The most common species are Diospyros spp. and Strombosia glaucescens, var. lucida, with two very large live trees on the site, Nauclea diderichii and Piptadeniastrum africanum, both over 3-m in girth and approximately 67-m and 50-m high, respectively. The ground flora is mainly herbaceous with some prostrate shrubs, about 30 to 70 cm high. Typical species were Leptaspis cochleata, Pollia condensata, Culcasia seandens, Geophila sp., Costus englerianus, and some ferns. The shrub layer grows up to 5 m above the ground and although dense it is not so thick as to make it impassable. Typical species are Pycnocoma macrophylla, Penianthus patulinervis, Baphia nitida, Mabia mualala, Glyphaea brevis, Cnestis ferruginea, Napoleona parviflora, and several young trees of the higher stories. In parts of the area, there are some woody vines which grow up to the tops of trees or groups of trees forming thickets. Prominent species among the climbers are Acacia pennata, Ancistrophyllum spp., Calamus sp., and others in the families Conaraceae and Apocynaceae.
The soils in the area are very typical of those occurring widely over sedimentary rocks in the forest region of Ghana. They belong to the Bekwai-Nzima-Kokofu-Oda catenary association and form an intergrade between the ochrosols and oxysols. In the American classification both these soil groups would be termed reddish yellow latosols. In general the profile consists of 5 to 8 cm of humus, crumbly silty clay, overlying about 15 cm of pale brown silty to slightly sandy clay, merging into a mottled compact layer of quartz stones and pebbles and ironstone concretions.
Climate data are available from weather stations at two locations near the study site: Kade Agricultural Research Station (6.15 N 0.92 W) and Kumasi, Ghana (6.72 N 1.60 W).
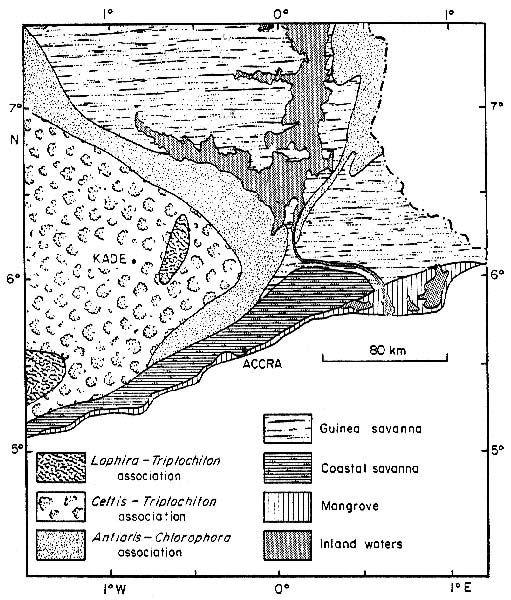
Figure 2. Southern Ghana, showing the position of the Kade tropical forest site in relation to forest zones. (Figure reproduced by kind permission of the Journal of Ecology and the British Ecological Society).
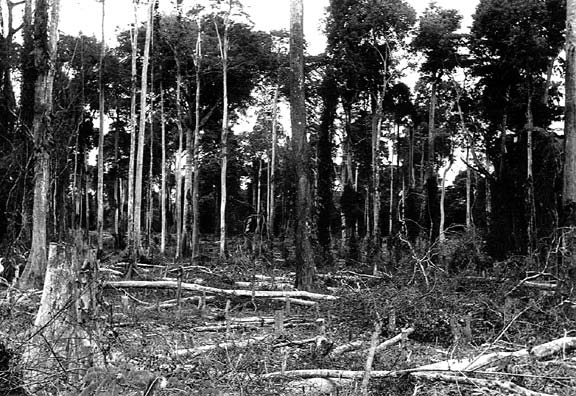
Figure 3. Forest after clearing of secondary growth at the Kade tropical forest site, Ghana. (typically, the area would now be ready for burning and planting. Photograph taken 1958 by Dr. P. H. Nye, Beckley, Oxon., UK).
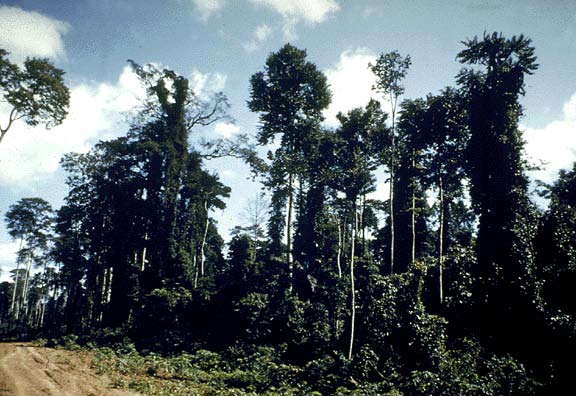
Figure 4. Similar secondary forest, 20-30 years old, nearby the Kade tropical forest site, Ghana. (Photograph taken 1958 by Dr. P. H. Nye, Beckley, Oxon., UK).
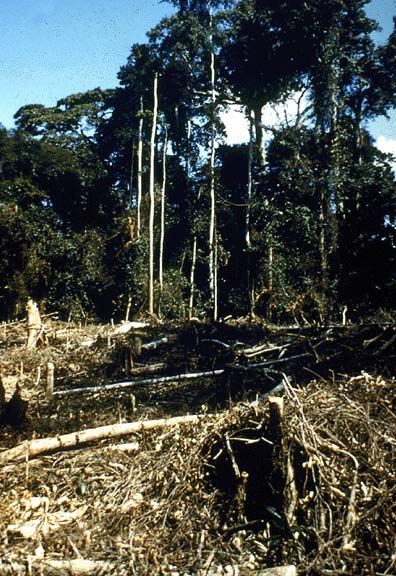
Figure 5. Secondary forest, 20-30 years old, after clearing; nearby the Kade tropical forest site, Ghana. (Photograph taken 1958 by Dr. P. H. Nye, Beckley, Oxon., UK).
Above- and Below-ground Biomass
(Greenland and Kowal, 1960). Biomass was estimated by harvest method and determined for the the following categories: roots; stumps; litter; lianas (climbers); trash (leaves and twigs); medium wood; large wood; and large dead wood. Lianas were removed, dried at 105 C, and ground for analysis. Litter was collected by hand down to soil surface and prepared for analysis as for the lianas. The whole area was clear felled. All medium wood was cut, corded, and weighed. Sawdust was collected for moisture determination and analysis. Leaves and twigs were bundled, weighed, and sub-sampled for moisture determination and analysis. Large trees were carefully measured to obtain the volume, and samples removed for dry density determinations. Large dead wood was determined similarly. For analysis, sawdust from a cut across the whole tree was used. Since it was considered probable that the composition of samples of dead wood of different ages would differ considerably, all large specimens were sampled and analyzed individually. Stumps were winched out of the ground. Stem and root portions were weighed separately, the division being made at the point of root branching or for buttressed trees at ground level. Roots were extracted from pits at several depth intervals. Root material from each horizon and each face of each pit was weighed separately, but for analysis the material was bulked and analyzed according to root sizes. Chemical analysis of all dried and ground material was done by standard laboratory methods.
Litterfall
(Nye, 1961). Litterfall was collected in 6 elevated mesh trays measuring 0.9 m x 1.8 m every two weeks from May 1958 to April 1959. After each collection, the trays were moved to a fresh site in order to increase the effective sampling of litter from the extremely heterogeneous vegetation. The litter was air dried, weighed, and bulked.
Small Litterfall
(John, 1973). The fall of leaves, small twigs (< 2.5 cm diam.), unidentifiable debris, fruits, seeds, and flowers were collected monthly for 26 months (April 1970 to June 1972) using twenty 1-m2 litter traps randomly positioned in eight 0.25-ha plots. Each trap consisted of a wooden frame from which was suspended a bag of nylon mosquito netting allowing for the rapid drainage of rainwater. The monthly litter samples were dried at 98 degrees C for 34 hr, sorted out into the categories mentioned above, and weighed. The small amounts of fruit, seed, and flower fall were combined into a single category.
Wood Litterfall
(John, 1973). The fall of wood litter was determined using a single sample area of 0.25 ha. All the branches and other wood from 2.5-33.0 cm diam. lying on the forest floor or caught up in the canopy were painted with yellow or white paint in October 1971. The plot was revisited after six months and all the unmarked branches were collected and divided into small wood (2.5-5.0 cm diam.) and medium wood (5-33 cm diam.). Each of these categories of wood litterfall was weighed and subsamples were removed for drying and determination of moisture content.
Standing Crop of Litter
(John, 1973). The weights of the four categories of small litter lying on the forest floor were determined by randomly sampling the ground litter throughout the year using 1-m2 quadrats. Twenty-six samples were obtained over the course of a year. The two categories of larger wood litter lying on the ground or caught up in the canopy were measured over a total area of about 0.25 ha using sample areas of either 100 or 400 m2. The ground litter was treated in a fashion similarto that described for the litter collected in the traps.
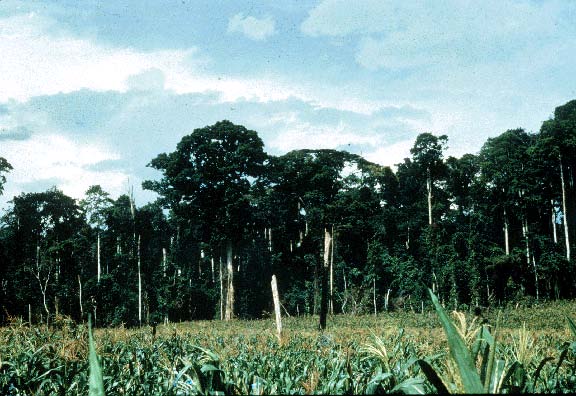
Figure 6. Profile of secondary forest at Kade, Ghana, four months after clearing for crops. (The large tree to the left of the center of the picture [about the sixth tall tree trunk from the left] is Triplochiton scleroxylon; the fourth trunk visible from the right is Celtis. Maize [Zea mays] is evident in the foreground. (Photograph taken 1st June 1967 by Dr. George W. Lawson, Natural History Museum, London, UK).
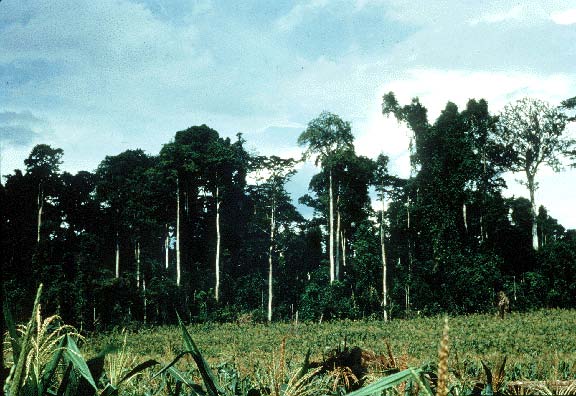
Figure 7. Another view of the profile of secondary forest at Kade, Ghana, four months after clearing for crops. (The large tree to the left of the center of the picture [about the fourth tall tree trunk from the left] is Triplochiton; the fourth trunk visible from the right is Celtis. (Photograph taken 1st June 1967 by Dr. George W. Lawson, Natural History Museum, London, UK).
6. Data Access:
This data set is available through the Oak Ridge National Laboratory (ORNL) Distributed Active Archive Center (DAAC).
Data Archive:
Web Site: http://daac.ornl.gov/
Contact for Data Center Access Information:
E-mail: uso@daac.ornl.gov
Telephone: +1 (865)
241-3952
7. References:
Greenland, D.J. and J.M.L. Kowal. 1960. Nutrient content of the tropical moist forest of Ghana. Plant and Soil 12: 154-174.
John, D.M. 1973. Accumulation and decay of litter and net production of forest in tropical West Africa. Oikos 24: 430-435.
Lawson G.W., K.O. Armstrong-Mensah, and J.B. Hall. 1970. A catena in tropical moist deciduous forest near Kade, Ghana. Journal of Ecology 58: 371-398.
Nye, P. H. 1961. Organic matter and nutrient cycles under moist tropical forest. Plant and Soil 13: 333-346.
Olson, R.J., K.R. Johnson, D.L. Zheng, and J.M.O. Scurlock. 2001. Global and Regional Ecosystem Modeling: Databases of Model Drivers and Validation Measurements. ORNL Technical Memorandum TM-2001/196. Oak Ridge National Laboratory, Oak Ridge, Tennessee, U.S.A.
Additional Sources of Information:
Clark, D.A., S. Brown, D.W. Kicklighter, J Q. Chambers, J R. Thomlinson, J. Ni, and E. A. Holland. 2001a. Net primary production in tropical forests: an evaluation and synthesis of existing field data. Ecological Applications, 11(2): 371-384.
Clark, D.A., S. Brown, D.W. Kicklighter, J.Q. Chambers, J.R. Thomlinson, J. Ni, and E.A. Holland. 2013b. NPP Tropical Forest: Consistent Worldwide Site Estimates, 1967-1999. Data set. Available on-line [http://daac.ornl.gov] from the Oak Ridge National Laboratory Distributed Active Archive Center, Oak Ridge, Tennessee, USA. doi:10.3334/ORNLDAAC/616
Olson, R.J., J.M.O. Scurlock, S.D. Prince, D.L. Zheng, and K.R. Johnson (eds.). 2013a. NPP Multi-Biome: Global Primary Production Data Initiative Products, R2. Data set. Available on-line [http://daac.ornl.gov] from the Oak Ridge National Laboratory Distributed Active Archive Center, Oak Ridge, Tennessee, USA. doi:10.3334/ORNLDAAC/617
Olson, R.J., J.M.O. Scurlock, S.D. Prince, D.L. Zheng, and K.R. Johnson (eds.). 2013b. NPP Multi-Biome: NPP and Driver Data for Ecosystem Model-Data Intercomparison, R2. Data set. Available on-line [http://daac.ornl.gov] from the Oak Ridge National Laboratory Distributed Active Archive Center, Oak Ridge, Tennessee, USA. doi:10.3334/ORNLDAAC/615
Scurlock, J.M.O., and R.J. Olson. 2002. Terrestrial net primary productivity - A brief history and a new worldwide database. Environ. Rev. 10(2): 91-109. doi:10.1139/a02-002
Scurlock, J.M.O., and R.J. Olson. 2013. NPP Multi-Biome: Grassland, Boreal Forest, and Tropical Forest Sites, 1939-1996, R1. Data set. Available on-line [http://daac.ornl.gov] from Oak Ridge National Laboratory Distributed Active Archive Center, Oak Ridge, Tennessee, USA. doi:10.3334/ORNLDAAC/653
Taylor, C. J. 1952. The vegetation zones of the Gold Coast. Gold Coast Forestry Dept. Bull. No. 4, pp. 11.