Documentation Revision Date: 2026-06-05
Dataset Version: 1
Summary
This dataset contains one file in NetCDF format.
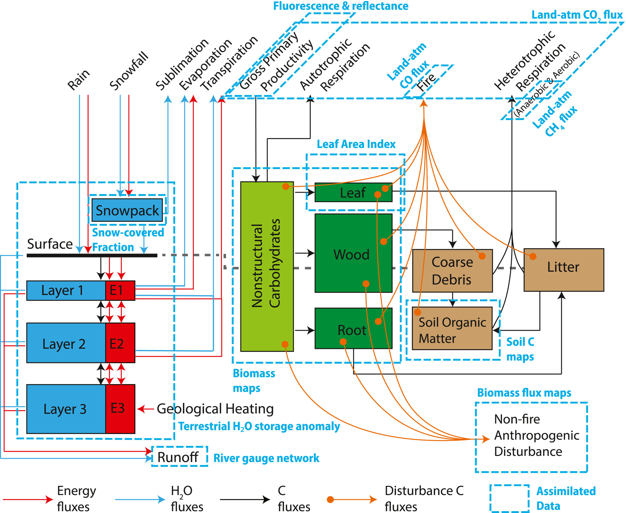
Figure 1. A schematic of the CARDAMOM model-data integration system; the DALECcwe process model representation of carbon, water, and energy cycling consists of 7 carbon states, three soil water states and linked energy states, a snow pool, and associated fluxes. Dashed blue outlines indicate where states or fluxes are informed by observation-based datasets.
Citation
Bilir, T.E., A.A. Bloom, N.C. Parazoo, J. Liu, and R.K. Braghiere. 2026. CARDAMOM Carbon-Water-Energy Reanalysis v1100.1, 2001-2021. ORNL DAAC, Oak Ridge, Tennessee, USA. https://doi.org/10.3334/ORNLDAAC/2492
Table of Contents
- Dataset Overview
- Data Characteristics
- Application and Derivation
- Quality Assessment
- Data Acquisition, Materials, and Methods
- Data Access
- References
Dataset Overview
This dataset provides global, monthly estimates of terrestrial biosphere carbon, water, and energy cycling states and fluxes for 2001-2021, generated using the CARbon DAta MOdel fraMework (CARDAMOM) at 4 x 5-degree spatial resolution. CARDAMOM uses Bayesian inference and Markov Chain Monte Carlo (MCMC) optimization to calibrate parameters and initial conditions of the Data Assimilation Linked Ecosystem carbon-water-energy model (DALECCWE) at each grid cell, integrating multiple satellite and ancillary observational constraints. These constraints include land-atmosphere CO2 flux estimates (Net Biosphere Exchange, NBE) from the OCO-2-informed CMS-Flux product; above- and below-ground live biomass (ABGB) from a multi-satellite synthesis; reflectance-based gross primary productivity (GPP); Terra and Aqua leaf area index (LAI) and snow-covered fraction (SCF); terrestrial water storage anomalies from GRACE/GRACE-FO; fire carbon emissions from MOPITT CO inversions; GOSAT-informed wetland CH4 emissions; harmonized global soil organic carbon estimates; and mean runoff from in-situ river gauge networks.
DALECCWE simulates carbon, water, and energy cycles at a monthly time step, comprising seven carbon pools, three soil water pools, three linked energy states, and a snow water equivalent pool. Core mechanistic features of DALECCWE include a photosynthesis scheme sensitive to multiple environmental variables (such as light, temperature, and soil moisture), an environmentally responsive leaf phenology scheme, a joint aerobic-anaerobic heterotrophic respiration scheme, a three-pool water balance and linked energy cycle, and a comprehensive vegetation mortality scheme that accounts for stress, fire, and anthropogenic disturbances. CARDAMOM's Bayesian optimization of functional parameters and initial states does not assume steady-state conditions and makes no plant functional type assumptions, instead relying on assimilated observations to inform spatially explicit ecosystem dynamics.
The primary reanalysis outputs include monthly gridded estimates of seven carbon pools (non-structural carbohydrates, foliar, fine root, wood, litter, coarse woody debris, and soil organic matter), three soil water pools, three corresponding energy states, and a snow water equivalent pool, along with associated carbon, water, and energy fluxes. All outputs are reported as ensemble medians with interquartile ranges (25th-75th percentiles) derived from the MCMC posterior; means are also provided for mass closure checks.
Project: Carbon Monitoring System
The NASA Carbon Monitoring System (CMS) program is designed to make significant contributions in characterizing, quantifying, understanding, and predicting the evolution of global carbon sources and sinks through improved monitoring of carbon stocks and fluxes. The System uses NASA satellite observations and modeling/analysis capabilities to establish the accuracy, quantitative uncertainties, and utility of products for supporting national and international policy, regulatory, and management activities. CMS data products are designed to inform near-term policy development and planning.
Related Publication
Bilir, T.E., A.A. Bloom, A.G. Konings, J. Liu, N.C. Parazoo, G.R. Quetin, A.J. Norton, M.A. Worden, P.A. Levine, S. Ma, R.K. Braghiere, M. Longo, K. Bowman, S. Saatchi, D.S. Schimel, C.E. Miller, M. O’Sullivan, Y. Kang, S. Pandey, A.J. Patton, Y. Yang, and Y. Liu. 2025. Satellite-constrained reanalysis reveals CO2 versus climate process compensation across the global land carbon sink. AGU Advances 6:e2025AV001689. https://doi.org/10.1029/2025AV001689
Acknowledgements
This research was carried out at the Jet Propulsion Laboratory, California Institute of Technology, under a contract with the National Aeronautics and Space Administration and funded through the internal Research and Technology Development program.
Data Characteristics
Spatial Coverage: Global
Spatial Resolution: 4 degrees latitude x 5 degrees longitude
Temporal Coverage: 2001-01 to 2021-12
Temporal Resolution: Monthly
Study Area: Latitude and longitude are given in decimal degrees; coordinates represent grid cell centers
| Site | Westernmost Longitude | Easternmost Longitude | Northernmost Latitude | Southernmost Latitude |
|---|---|---|---|---|
| Global | -180 | -180 | 82 | -54 |
Data File Information
There is one file in this dataset: CARDAMOM_satellite_constrained_terrestrial_biosphere_reanalysis.nc4
Nodata (FillValue): -9999.0
Variable naming conventions
There are 315 variables in the data file that follow the naming convention xxx_SSSS where xxx represents the variable and SSSS represents the CARDAMOM ensemble statistics: 25th percentile, 75th percentile, median and mean. With the exception of 11 Drivers, all variables are provided with four values across these ensemble statistics.
Example variables for NBE_SSSS (Net Biospheric Exchange of carbon (vertical, land-atmosphere exchange)):
NBE_25th, NBE_75th, NBE_median, NBE_mean
Example variables for carbon pool, coarse woody debris (cwd): C_xxx_SSSS:
C_cwd_median, C_cwd_mean, C_cwd_25th, C_cwd_75th
Table 1. Variable names and descriptions
| Variable | Units | Description |
|---|---|---|
| C_xxx_SSSS | g m-2 | There are seven carbon pool variables. Each variable is provided with four values (i.e. mean, median, 25th percentile, and 75th percentile)
Variables (xxx):
|
| D_xxx_SSSS | - | There are five diagnostic variables. Each variable is provided with four values (i.e. mean, median,25th percentile, and 75th percentile)
Variables (xxx):
|
| Driver_BURNED_AREA | m2 m-2 | Fraction of pixel land area burned |
| Driver_CO2 | ppm | Mixing ratio of carbon dioxide in a dry parcel of air |
| Driver_DISTURBANCE_FLUX | g month-1 | Forest biomass harvest expressed as carbon |
| Driver_SKT | degrees C | Land surface skin temperature |
| Driver_SNOWFALL | mm d-1 | Frozen precipitation expressed as equivalent water thickness |
| Driver_SSRD | MJ m-2 d-1 | Solar Shortwave Radiation Downwelling |
| Driver_STRD | MJ m-2 d-1 | Solar Thermal Radiation Downwelling |
| Driver_T2M_MAX | degrees C | Air temperature daily maximum |
| Driver_T2M_MIN | degrees C | Air temperature daily minimum |
| Driver_TOTAL_PREC | mm d-1 | Total precipitation expressed as equivalent water thickness |
| Driver_VPD | hPa | Water vapor pressure deficit |
| H2O_xxx_SSSS | kg m-2 | There are four water content variables. Each variable is provided with four values (i.e. mean, median, 25th percentile, and 75th percentile)
Variables (xxx):
|
| NBE_SSSS | g m-2 d-1 | Net Biospheric Exchange of carbon (vertical, land-atmosphere exchange) with four values (i.e. mean, median, 25th percentile, and 75th percentile) provided |
| NEP_SSSS | g m-2 d-1 | Net Ecosystem Production of carbon with four values (i.e. mean, median, 25th percentile, and 75th percentile) provided |
| Rd_SSSS | g m-2 d-1 | Dark respiration combined with maintenance respiration of carbon for leaf pool, with four values (i.e. mean, median, 25th percentile, and 75th percentile) |
| ae_rh_xxx_SSSS | g m-2 d-1 | There are three aerobic heterotrophic (ae_rh_xxx) respiration variables. Each variable is provided with four values (i.e. mean, median, 25th percentile, and 75th percentile)
Variables (xxx):
|
| an_rh_xxx_SSSS | g m-2 d-1 | There are three anaerobic heterotrophic respiration variables (an_rh_xxx). Each variable is provided with four values (i.e. mean, median, 25th percentile, and 75th percentile)
Variables (xxx):
|
| cwd2som_SSSS | g m-2 d-1 | Coarse woody debris carbon loss (soil organic matter carbon gain) due to decomposition. Four values are provided (i.e. mean, median, 25th percentile, and 75th percentile) |
| dist_SSSS | g m-2 d-1 | Total carbon loss due to forest harvest with four values (i.e. mean, median, 25th percentile, and 75th percentile) |
| dist_xxx_SSSS | g m-2 d-1 | There are four dist variables. Each variable is provided with four values (i.e. mean, median, 25th percentile, and 75th percentile)
Variables (xxx):
|
| ets_SSSS | kg m-2 d-1 | Total land to atmosphere water flux (evaporation, transpiration, and sublimation) with four values provided (i.e. mean, median, 25th percentile, and 75th percentile) |
| evap_SSSS | kg m-2 d-1 | Evaporation of water with four values provided (i.e. mean, median, 25th percentile, and 75th percentile) |
| f_xxx_SSSS | g m-2 d-1 | There are eight variables for carbon loss due to fire vaporization. Each variable is provided with four values (i.e. mean, median, 25th percentile, and 75th percentile)
Variables (xxx):
|
| fol2lit_SSSS | g m-2 d-1 | Foliar carbon loss (litter carbon gain) due to foliar pool background mortality with four values provided (i.e. mean, median, 25th percentile, and 75th percentile) |
| foliar_prod_SSSS | g m-2 d-1 | Foliar carbon pool gain with four values provided (i.e. mean, median, 25th percentile, and 75th percentile) |
| fx_xxx2xxx_SSSS | g m-2 d-1 | There are six variables for carbon loss-carbon gain (fx). Each variable is provided with four values (i.e. mean, median, 25th percentile, and 75th percentile)
Variables (xxx2xxx):
|
| gpp_SSSS | g m-2 d-1 | Gross primary production of carbon (photosynthesis) with four values provided (i.e. mean, median, 25th percentile, and 75th percentile) |
| infil_SSSS | kg m-2 d-1 | Water infiltration with four values provided (i.e. mean, median, 25th percentile, and 75th percentile) |
| lab2lit_SSSS | g m-2 d-1 | Labile carbon loss (litter carbon gain) due to labile pool background mortality with four values provided (i.e. mean, median, 25th percentile, and 75th percentile) |
| lab_prod_SSSS | g m-2 d-1 | Labile carbon pool gain with four values provided (i.e. mean, median, 25th percentile, and 75th percentile) |
| lit2som_SSSS | g m-2 d-1 | Litter carbon loss (soil organic matter carbon gain) due to decomposition with four values provided (i.e. mean, median, 25th percentile, and 75th percentile) |
| ly1xly2_SSSS | kgm-2 d-1 | Water transfer between soil layers 1 and 2 with four values provided (i.e. mean, median, 25th percentile, and 75th percentile) |
| ly2xly3_SSSS | kg m-2 d-1 | Water transfer between soil layers 2 and 3 with four values provided (i.e. mean, median, 25th percentile, and 75th percentile) |
| melt_SSSS | kg m-2 d-1 | Snowmelt water with four values provided (i.e. mean, median, 25th percentile, and 75th percentile) |
| ph_fol2lit_SSSS | g m-2 d-1 | Foliar carbon loss (litter carbon gain) due to seasonal senescence with four values provided (i.e. mean, median, 25th percentile, and 75th percentile) |
| q_xxx_SSSS | kg m-2 d-1 | There are three variables for soil layer water runoff. Each variable is provided with four values (i.e. mean, median, 25th percentile, and 75th percentile)
Variables (xxx):
|
| q_surf_SSSS | kg m-2 day-1 | Surface water runoff with four values provided (i.e. mean, median, 25th percentile, and 75th percentile) |
| resp_auto_SSSS | g m-2 d-1 | Total autotrophic respiration of carbon with four values provided (i.e. mean, median, 25th percentile, and 75th percentile) |
| resp_xxx_SSSS | g m-2 d-1 | There are two variables for autotrophic respiration of carbon. Each variable is provided with four values (i.e. mean, median,25th percentile, and 75th percentile)
Variables (xxx):
|
| rh_ch4_SSSS | g m-2 d-1 | Total carbon in methane generated by total heterotrophic respiration with four values provided (i.e. mean, median, 25th percentile, and 75th percentile) |
| rh_co2_SSSS | g m-2 d-1 | Total carbon in carbon dioxide generated by total heterotrophic respiration with four values provided (i.e. mean, median, 25th percentile, and 75th percentile) |
| roo2lit_SSSS | g m-2 d-1 | Root carbon loss (litter carbon gain) due to root pool background mortality with four values provided (i.e. mean, median, 25th percentile, and 75th percentile) |
| root_prod_SSSS | g m-2 d-1 | Root carbon pool gain with four values provided (i.e. mean, median, 25th percentile, and 75th percentile) |
| runoff_SSSS | kg m-2 d-1 | Total water runoff with four values provided (i.e. mean, median, 25th percentile, and 75th percentile) |
| sublimation_SSSS | kg m-2 d-1 | Sublimation of water with four values provided (i.e. mean, median, 25th percentile, and 75th percentile) |
| transpx_SSSS | kg m-2 d-1 | There are two variables for the transpiration of water. Each variable is provided with four values (i.e. mean, median, 25th percentile, and 75th percentile)
Variables (x):
|
| transp_SSSS | kg m-2 d-1 | Total transpiration of water with four values provided (i.e. mean, median, 25th percentile, and 75th percentile) |
| woo2cwd_SSSS | g m-2 d-1 | Wood carbon loss (coarse woody debris carbon gain) from wood pool background mortality with four values provided (i.e. mean, median, 25th percentile, and 75th percentile) |
| wood_prod_SSSS | g m-2 d-1 | Wood carbon pool gain with four values provided (i.e. mean, median, 25th percentile, and 75th percentile) |
Application and Derivation
These data could be useful to climate studies and environmental policy decision making.
Quality Assessment
The uncertainty is characterized by the posterior distribution of parameter estimates for each of 99 parameters generated by the MCMC estimation process. Together these parameter posteriors produce a posterior ensemble of model outputs for all states and fluxes. This dataset provides the ensemble mean, median and interquartile range.
Data Acquisition, Materials, and Methods
This dataset is derived as described in Bilir et al. (2025); For more detailed methodology see especially Sections 2.1-2.3, Table 1, Figure 1, and supplementary sections S1.1 and S3. Evaluations are presented in Section 3.1 and S4, and known limitations are discussed in 3.5. A brief overview is provided below.
Model Framework and Structure: This dataset was generated using CARDAMOM (the Carbon Data Model Framework), a model–data integration system that estimates parameters and initial conditions for the DALEC carbon–water–energy model (DALECCWE) through Bayesian inference. DALECCWE simulates carbon, water, and energy cycles at a monthly time step, comprising seven carbon pools, three soil water pools, three linked energy states, and a snow water equivalent pool. Core mechanistic features of DALECCWE include a photosynthesis scheme sensitive to multiple environmental variables (such as light, temperature, and soil moisture), an environmentally responsive leaf phenology scheme, a joint aerobic-anaerobic heterotrophic respiration scheme, a three-pool water balance and linked energy cycle, and a comprehensive vegetation mortality scheme that accounts for stress, fire, and anthropogenic disturbances. CARDAMOM's Bayesian optimization of functional parameters and initial states does not assume steady-state conditions and makes no plant functional type assumptions, instead relying on assimilated observations to inform spatially explicit ecosystem dynamics. The full open-source model code is available on GitHub (https://github.com/CARDAMOM-framework) and Zenodo (https://zenodo.org/records/14521190), with additional documentation at the CARDAMOM manual page.
Meteorological Forcing and Observational Constraints: DALECCWE was forced over the 2001-2021 study period using meteorological drivers from the ECMWF ERA5 reanalysis, regridded from 0.5-degree × 0.5-degree to 4-degree × 5-degree resolution. Additional forcing datasets include globally averaged atmospheric CO2 concentrations, pixel-level burned area fraction, and a human-caused deforestation and forest degradation disturbance lateral flux that is distinct from fire-related deforestation. The model was constrained by multiple satellite- and inventory-based observational datasets, including: atmospheric CO2 inversion-based net biosphere exchange, above- and below-ground biomass, soil carbon, gross primary productivity, leaf area index, snow-covered fraction, terrestrial water storage anomalies from GRACE/GRACE-FO, fire carbon emissions, wetland CH4 emissions, and runoff.
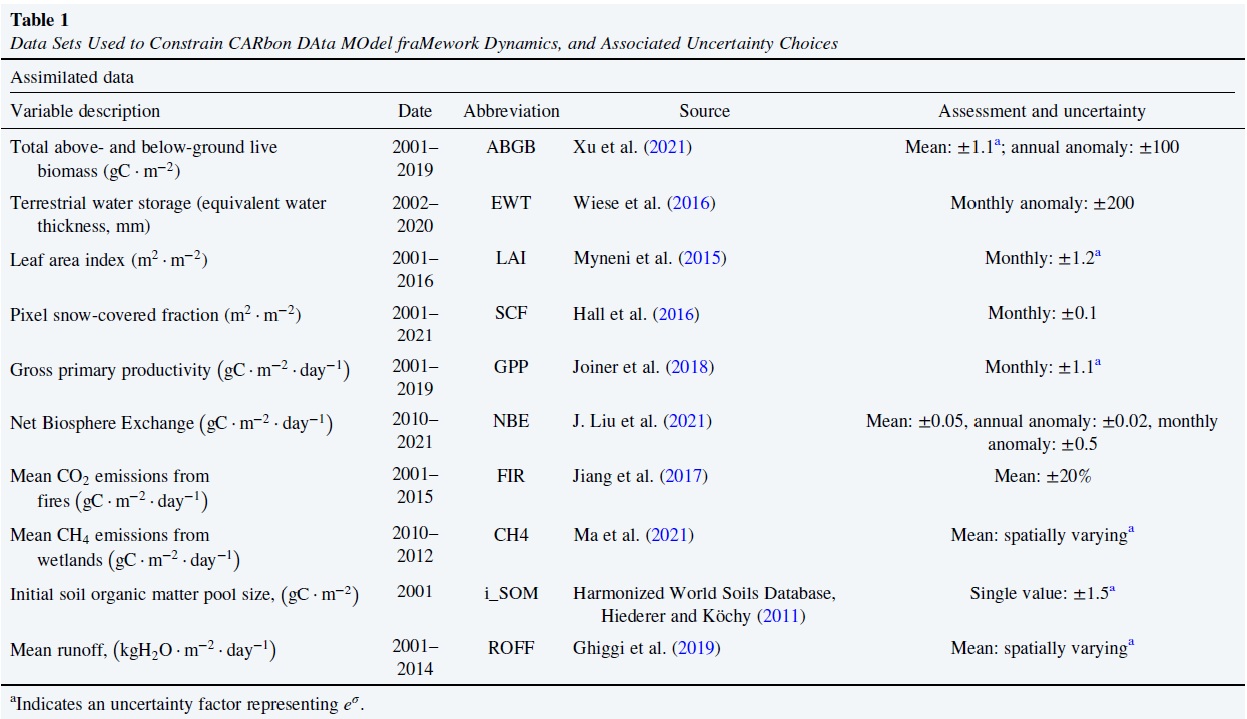
Figure 2. Datasets used to constrain CARbon DAta MOdel fraMework dynamics, and associated uncertainty choices. Table 1 in Bilir et al. (2025)
Parameter Inference and Implementation: DALECCWE parameters and initial conditions were estimated independently at each 4-degree × 5-degree grid cell using a differential evolution Markov Chain Monte Carlo (DE-MCMC) approach, which samples the posterior distribution of parameters and initial states given the observational constraints via Bayes' theorem. Land pixels were defined as those with ≥25% land area, excluding Antarctica and Greenland. Prior parameter ranges were supplemented by Ecological and Dynamical Constraints (EDCs), which impose ecologically consistent bounds on inter-parameter relationships. The posterior ensemble was defined as the final 25% of MCMC parameter ensembles, further filtered to exclude ensemble members producing non-negative states under detrended forcing. Model results are reported as posterior means and medians, with uncertainty expressed as the interquartile range (25th and 75th percentiles).
Data Access
These data are available through the Oak Ridge National Laboratory (ORNL) Distributed Active Archive Center (DAAC).
CARDAMOM Carbon-Water-Energy Reanalysis v1100.1, 2001-2021
Contact for Data Center Access Information:
- E-mail: uso@daac.ornl.gov
- Telephone: +1 (865) 241-3952
References
Bilir, T.E., A.A. Bloom, A.G. Konings, J. Liu, N.C. Parazoo, G.R. Quetin, A.J. Norton, M.A. Worden, P.A. Levine, S. Ma, R.K. Braghiere, M. Longo, K. Bowman, S. Saatchi, D.S. Schimel, C.E. Miller, M. O’Sullivan, Y. Kang, S. Pandey, A.J. Patton, Y. Yang, and Y. Liu. 2025. Satellite-constrained reanalysis reveals CO2 versus climate process compensation across the global land carbon sink. AGU Advances 6:e2025AV001689. https://doi.org/10.1029/2025AV001689
Ghiggi, G., V. Humphrey, S.I. Seneviratne, and L. Gudmundsson. 2019. GRUN: An observation-based global gridded runoff dataset from 1902 to 2014. Earth System Science Data 11:1655–1674. https://doi.org/10.5194/essd-11-1655-2019
Hall, D.K., and G.A. Riggs. 2016. MODIS/Terra Snow Cover Daily L3 Global 0.05Deg CMG. (MOD10C1, Version 6). Boulder, Colorado USA. NASA National Snow and Ice Data Center Distributed Active Archive Center. https://doi.org/10.5067/MODIS/MOD10C1.006
Hiederer, R., and M. Köchy. 2011. Global soil organic carbon estimates and the harmonized world soil database. Joint Research Centre and Institute for Environment and Sustainability Publications Office. European Commission Joint Research Centre; Ispra, Varese, Italy. https://doi.org/10.2788/13267
Jiang, Z., J.R. Worden, H. Worden, M. Deeter, D.B.A. Jones, A.F. Arellano and D.K. Henze. 2017. A 15-year record of co emissions constrained by Mopitt Co observations. Atmospheric Chemistry and Physics 177:4565–4583. https://doi.org/10.5194/acp-17-4565-2017
Joiner, J., Y. Yoshida, Y. Zhang, G. Duveiller, M. Jung, A. Lyapustin, Y, Wang, and J.T. Comption. 2018. Estimation of terrestrial global gross primary production GPP with satellite data-driven models and eddy covariance flux data. Remote Sensing 109:1346. https://doi.org/10.3390/rs10091346
Liu, J., L. Baskaran, K. Bowman, D.S. Schimel, A.A. Bloom, N.C. Parazoo, T. Oda, D. Carroll, D. Menemenlis, J. Joiner, R. Commane, B. Daube, L.V. Gatti, K. McKain, J. Miller. B.B. Stephens, C. Sweeney, and S. Wofsy. 2021. Carbon monitoring system flux net biosphere exchange 2020 CMS-Flux NBE 2020. Earth System Science Data 132:299–330. https://doi.org/10.5194/essd-13-299-2021
Ma, S., J.R. Worden, A.A. Bloom, Y. Zhang, B. Poulter, D.H. Cusworth, Y. Yin, S. Pandey, J.D. Maasakkers, A. Lu, L. Shen, J. Sheng, C. Frankenmberg, C.E. Miller, and D.J. Jacob. 2021. Satellite constraints on the latitudinal distribution and temperature sensitivity of wetland methane emissions. AGU Advances 23:e2021AV000408. https://doi.org/10.1029/2021AV000408
Myneni, R., Y. Knyazikhin, and T. Park. 2015. MYD15A2H MODIS/Aqua Leaf Area Index/FPAR 8-Day L4 Global 500m SIN Grid V006. NASA Land Processes Distributed Active Archive Center. https://doi.org/10.5067/MODIS/MYD15A2H.006
Wiese, D.N., F.W. Landerer, and M.M. Watkins. 2016. Quantifying and reducing leakage errors in the JPL RL05M GRACE mascon solution. Water Resources Research 529:7490–7502. https://doi.org/10.1002/2016WR019344
Xu, L., S.S. Saatchi, Y.Y. Yang, Y. Yu, J. Pongratz, A.A. Bloom, K. Bowman, J. Worden, J. Liu, Y. Yin, G. Domke, R.E. McRoberts, C. Woodall, G.-J. Nabuurs, S. De-Miguel, M. Keller, N. Harris, S. Maxwell, and D.S. Schimel. 2021. Changes in global terrestrial live biomass over the 21st century. Science Advances 727:eabe9829. https://doi.org/10.1126/sciadv.abe9829