Get Data
Summary:
The Simple Biosphere Model, Version 3 (SiB3) was used to produce a global data set of hourly carbon fluxes between the atmosphere and the terrestrial biosphere for the years 1998-2006. This data set represents the global net ecosystem exchange (NEE) of carbon between the atmosphere and the terrestrial biosphere; specifically, the flux of CO2 between the planetary boundary layer (PBL) and the surface vegetation layer. Following atmospheric convention, flux is defined as positive into the atmosphere and negative into the surface vegetation.
The data reported are 9 years of estimated hourly carbon flux for 14,637 land points. Units are moles C/m2/sec. These data are provided in two netCDF formats, and in GeoTIFF format.
These data are a carbon cycl e reanalysis, which may be thought of as analogous to NCEP meteorological reanalysis products. Carbon fluxes have been used by a large community of atmospheric transport modelers to create reanalysis of CO2 concentrations and the results have been evaluated against observations. In addition, the reanalyzed flux and CO2 fields are important for designing future observing strategies for the global carbon cycle.
Data Characteristics:
Data are provided in two different netCDF formats:
- The netCDF format provided by the investigators -- format designed specifically to minimize disk storage volume that excludes water grid cells.
- A CF Compliant netCDF format -- generated by the ORNL DAAC that includes both land and water grid cells.
The investigator provided netCDF formatted files can be processed using the provided FORTRAN code (sib_process_flux.f90) and the land mask (sib_mask.nc) into hourly, daily-mean, or monthly-mean fluxes on a global 1x1 degree Cartesian grid. The monthly-mean SiB3 fluxes were compared to TransCom flux data available for years 2000-2005 (Gurney et al., 2008) as a means of evaluating overall behavior of the model. An example of these comparisons is shown in Figure 1. In general, SiB3 fluxes are within the error bars of the TransCom results.
The CF compliant netCDF format files have been processed by the ORNL DAAC and the hourly and summarized daily-mean and monthly-mean flux data files are provided.
GeoTIFF format files:
In addition, the CF convention netCDF files were converted to GeoTIFF image files by the ORNL DAAC and are included with the data set.
Companion file:Additional information about the data formats, methodology, and data quality is found in the companion file: http://daac.ornl.gov/daacdata/global_vegetation/SiB3_Carbon_Flux/comp/SiB3_fluxes_documentation.pdf
Additional Data Access:
Additional access to the CF compliant netCDF and GeoTIFF formatted hourly and summarized daily-mean and monthly-mean flux data files is also provided through the ORNL DAAC Spatial Data Access Tool (SDAT), and through the ORNL DAAC TDS.
SDAT is an Open Geospatial Consortium (OGC) compliant tool that provides a web
interface to visualize and download user selected projection, resolution, format, band, interpolation method, time peroid, and
spatial extent. The ORNL DAAC TDS is a Thematic Real-time Environmental
Distributed Data Services (THREDDS) Data Catalogue Service (TDS) that provides data through Open-source Project for a Network
Data Access Protocol (OPeNDAP), OGC Web Coverage Service, and bulk Hypertext Transfer Protocol (HTTP).
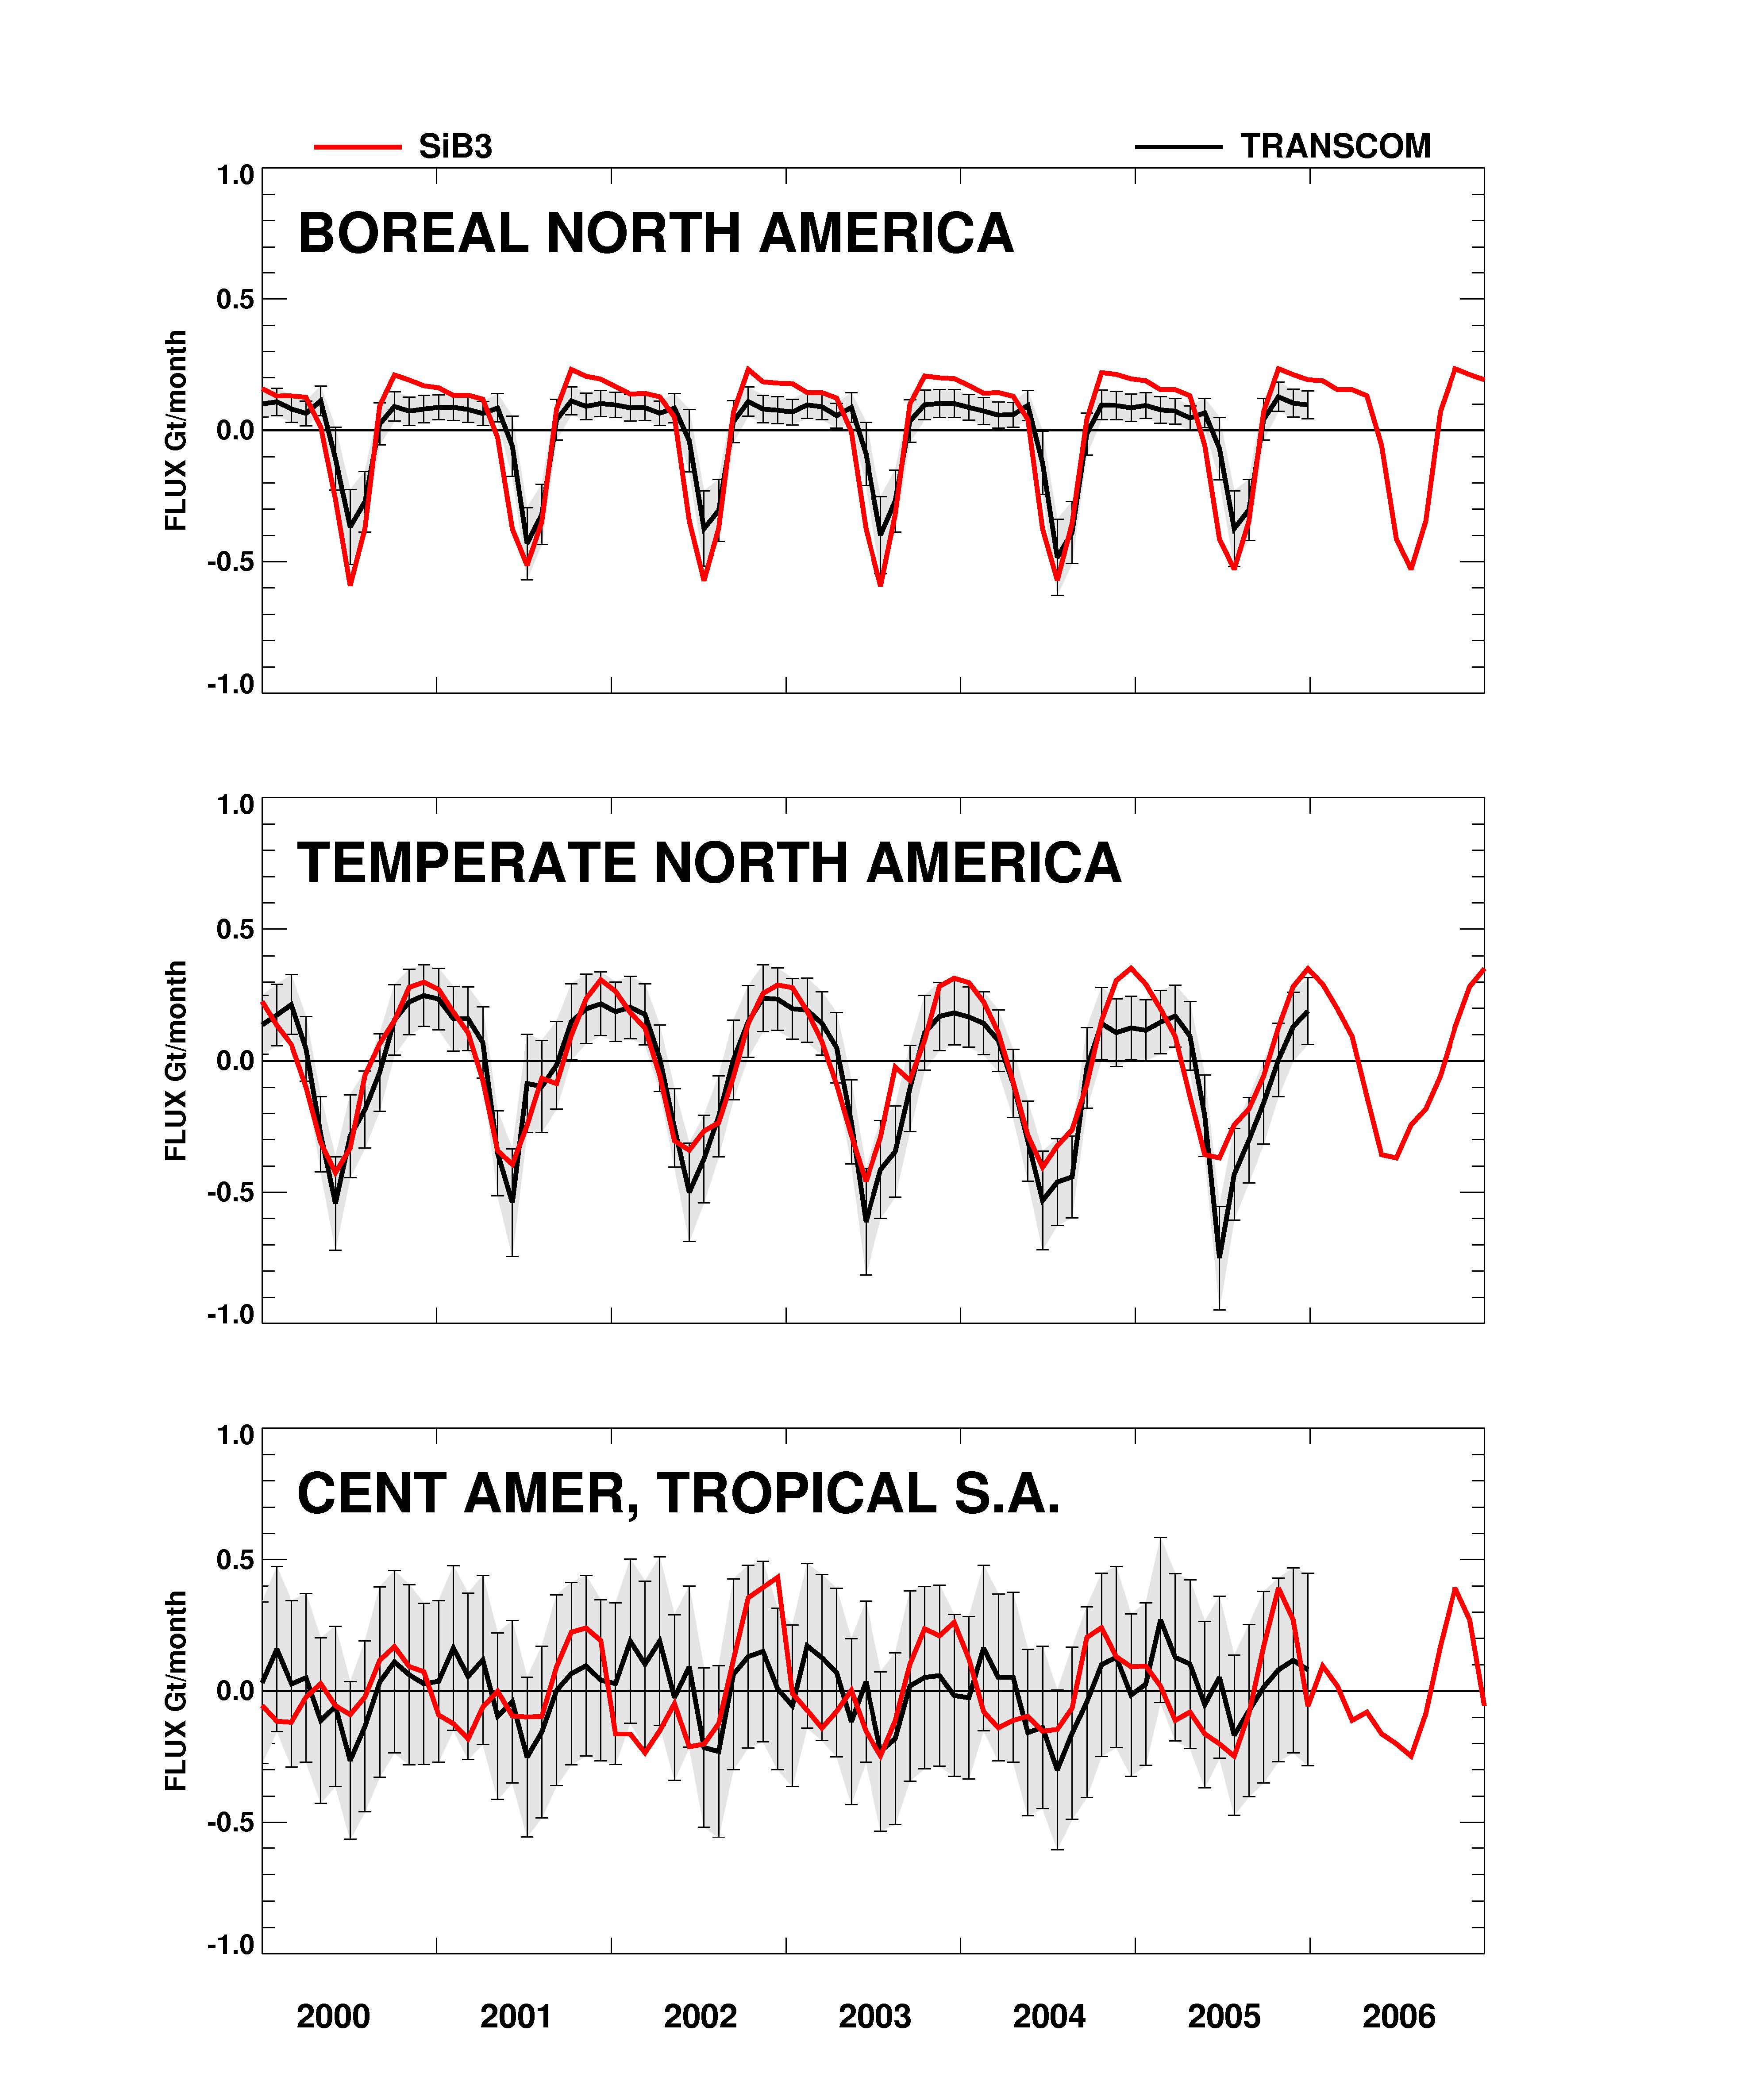
Figure 1. Comparison of the monthly-mean SiB3 fluxes to TransCom flux data available for years 2000-2005 (Gurney et al., 2008) as a means of evaluating overall behavior of the model. SiB3 model 2006 annual cycle is shown also. In general, SiB3 fluxes are within the error bars of the TransCom results.
Data Citation:
Cite this data set as follows:
Baker, I.T., A.S. Denning, L. Prihodko, K. Schaefer, J.A. Berry, G.J. Collatz, N.S. Suits, R. Stockli, A. Philpott, and O. Leonard. 2009. SiB3 Modeled Global 1-degree Hourly Biosphere-Atmosphere Carbon Flux, 1998-2006. Data set. Available on-line [http://daac.ornl.gov/] from Oak Ridge National Laboratory Distributed Active Archive Center, Oak Ridge, Tennessee, U.S.A. doi:10.3334/ORNLDAAC/909
References:
Baker, I. T., A. S. Denning, N. Hanan, L. Prihodko, P. -L. Vidale, K. Davis, and P. Bakwin. 2003. Simulated and observed fluxes of sensible and latent heat and CO2 at the WLEF-TV Tower using SiB2.5. Global Change Biology, 9: 1262-1277.
Denning, A. S., J. G. Collatz, C. Zhang, D. A. Randall, J. A. Berry, P. J. Sellers, G. D. Colello, and D. A. Dazlich. 1996a. Simulations of terrestrial carbon metabolism and atmospheric CO2 in a general circulation model. Part 1: Surface carbon fluxes. Tellus, 48B: 521-542.
Denning, A. S., D. A. Randall, G. J. Collatz, and P. J. Sellers. 1996b. Simulations of terrestrial carbon metabolism and atmospheric CO2 in a general circulation model. Part 2: Spatial and temporal variations of atmospheric CO2. Tellus, 48B: 543-567.
Gurney, K. R., D. Baker, P. Rayner, and S. Denning. 2008. Interannual variations in continental-scale net carbon exchange and sensitivity to observing networks estimated from atmospheric CO2 inversions for the period 1980 to 2005, Global Biogeochem. Cycles, 22, GB3025, doi:10.1029/2007GB003082.
Randall, D. A., P. J. Sellers, J. A. Berry, D. A. Dazlich, C. Zhang, C. J. Collatz, A. S. Denning, S. O. Los, C. B. Field, I. Fung, C. O. Justice, and C. J. Tucker. 1996. A revised land surface parameterization (SiB2) for atmospheric GCMs. Part 3: The greening of the CSU GCM. J. Clim., 9: 738-763.
Sellers, P. J., Y. Mintz, Y. C. Sud, and A. Dalcher. 1986. A simple biosphere model (SiB) for use within general circulation models. J. Atmos. Sci., 43: 505-531.
Sellers, P. J., D. A. Randall, G. J. Collatz, J. A. Berry, C. B. Field, D. A. Dazlich, C. Zhang, G. D. Collelo, and L. Bounoua. 1996a. A revised land surface parameterization (SiB2) for atmospheric GCMs. Part 1: Model formulation. J. Clim., 9: 676-705.
Sellers, P. J., S. O. Los, C. J. Tucker, C. O. Justice, D. A. Dazlich, G. J. Collatz, and D. A. Randall. 1996b. A revised land surface parameterization (SiB2) for atmospheric GCMs. Part 2: The generation of global fields of terrestrial biophysical parameters from satellite data. J. Clim., 9: 706-737.
Data Format:
The netCDF format provided by the investigators -- format designed specifically to minimize disk storage volume that excludes water grid cells:
Raw hourly data are contained in files with the format:
SiB3.0_Cflux_YYYY_MM.nc
Where YYYY denotes year, and MM month. These files contain the vectors (length 14,637) of land-only data for each hour of the given month. The 72 files are netCDF formatted (about 40 mb each).
Also included are a processing program [sib_process_flux.f90] and a landmask file [sib_mask.nc]. The processing program reads the vector of land points and scatters them to a global 1x1 degree Cartesian grid of hourly, daily or monthly-mean fluxes. The landmask file provides locations of grid centers for the global grid as well as mapping between the vector of SiB points and the 2-dimensional global map. Units are moles C/m2/sec.
CF Compliant netCDF format -- generated by the ORNL DAAC that includes both land and water grid cells:
The CF compliant netCDF format files were processed by the ORNL DAAC and the hourly and summarized daily-mean and monthly-mean flux data files are provided. Units are moles C/m2/sec.
Data are contained in files with the format:
CF_sib_(aggregation)_YYYY_MM.nc
Where the aggregation interval may be hourly, daily, or monthly. YYYY denotes year and MM month.
GeoTIFF format files:
The CF convention netCDF files were converted to GeoTIFF image files by the ORNL DAAC. The hourly, daily-mean and monthly-mean files are provided.
Data are contained in files with the formats:
Hourly data:
sib_(aggregate)_YYYY_MM_DD.tif
Where DD denotes the day.
Daily
and Monthly data:
sib_(aggregation)_YYYY_MM.tif
Where the aggregation interval may be hourly, daily, or monthly. YYYY denotes year and MM month.
|
GeoTIFF file characteristics:
Each time step is stored as a band in the GeoTIFF file.
|
Companion Files
Additional information about the data format, methodology, and data quality is found in the companion file: http://daac.ornl.gov/daacdata/global_vegetation/SiB3_carbon_flux/comp/SiB3_carbon_flux_readme.pdf
Data Access:
This data is available through the Oak Ridge National laboratory (ORNL) Distributed Active archive Center (DAAC).
Contact for Data Center Access Information:
E-mail: uso@daac.ornl.gov
Telephone: +1 (865) 241-3952