Get Data
Summary:
The MOPITT (Measurements Of Pollution In The Troposphere) instrument on the NASA Terra Satellite makes measurements of infrared radiation originating from the surface of the planet and isolates the energy being radiated from carbon monoxide (CO). By using appropriate data analysis techniques, concentration profiles of CO (Level-2 (L2) data) can be obtained on a global basis at a reasonably high horizontal (~22km) and vertical resolution (~3km).
The MOPITT Level-3 (L3) data products provided in this data set are a subset of the daily averages from the L2 data. This subset was produced by overlaying a global 1x1-degree grid onto the L2 data, and then clipping the data to this southern Africa subset which originates at 5 degrees longitude and -35 degrees latitude and extends to 60 degrees longitude and 35 degrees latitude.
Data are reported for 2 heights, 700 and 350 hPa, from daytime swaths for the period August 1-September 30, 2000, the SAFARI 2000 Dry Season Campaign.

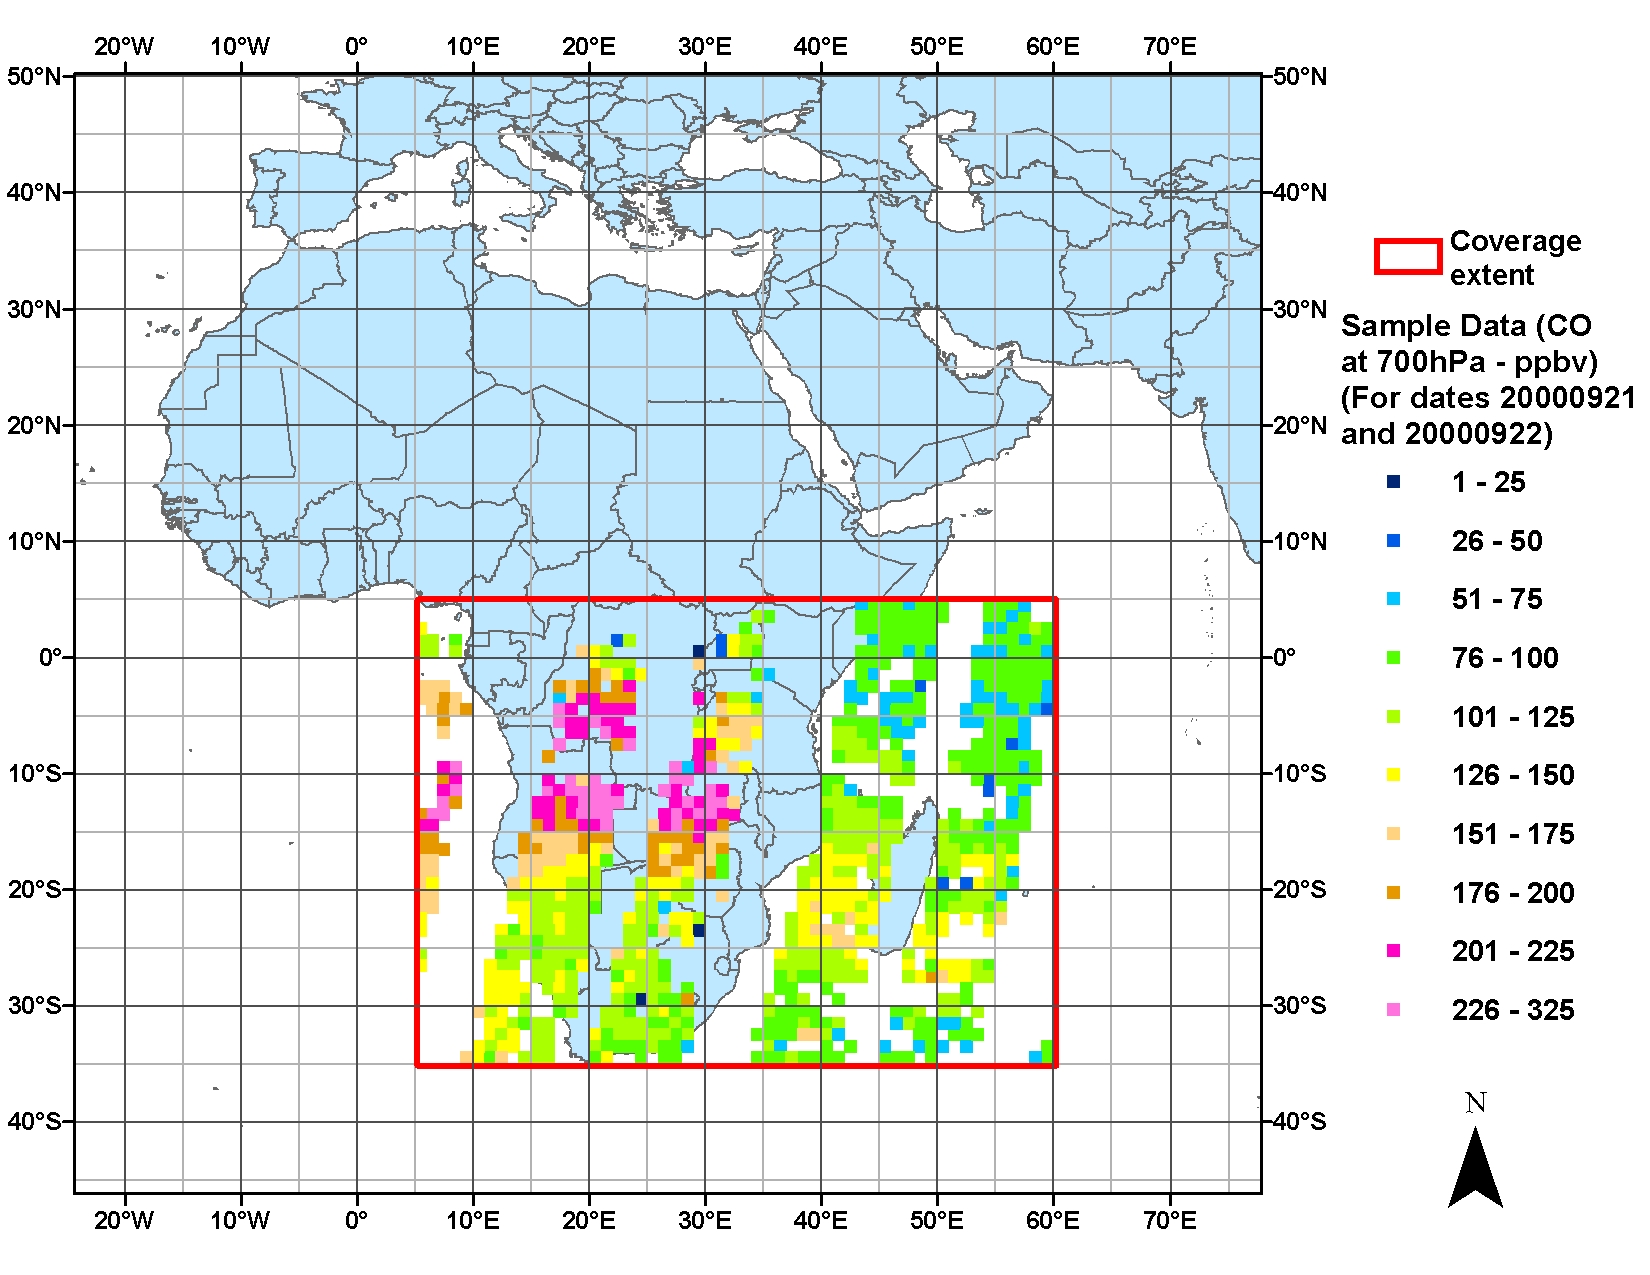
Figure 1. Spatial extent of the SAFARI 2000 MOPITT Tropospheric Carbon Monoxide, Southern Africa, Dry Season 2000 data showing daily average CO concentration at 700 hPa level in ppbv on a 1x1-degree grid for daytime swaths on September 21 and 22, 2000.
The L3 data are provided as 1x1-degree daily files in a documented ASCII format for the selected spatial and temporal ranges. See the Data Characteristics section.
The MOPITT web site [ http://www.acd.ucar.edu/mopitt/ ] provides a complete description of data collection, processing, and analysis steps for the Level 2 data and the derivation of the Level 3 product provided in this data set.
Data Citation:
Edwards, D. P., J. C. Gille, M. N. Deeter, D. Mao, and J. R. Drummond 2006. SAFARI 2000 MOPITT Tropospheric Carbon Monoxide, Southern Africa, Dry Season 2000. Data set. Available on-line [http://daac.ornl.gov/] from Oak Ridge National Laboratory Distributed Active Archive Center, Oak Ridge, Tennessee, U.S.A. doi:10.3334/ORNLDAAC/835.Table of Contents:
1. Data Set Overview:
The investigators were D. P. Edwards, J. C. Gille, M. N. Deeter, D. Mao, (National Center for Atmospheric Research, Boulder, CO USA) andJ. R. Drummond (University of Toronto, Toronto, ON Canada)
MOPITT Mission Objectives
* Measure and model carbon monoxide and methane concentrations in the troposphere.
* Obtain carbon monoxide profiles with a resolution of 22 km horizontally and 3 km vertically, with an accuracy of 10 percent.
* Generate global maps of carbon monoxide and methane distribution, and provide increased knowledge of tropospheric chemistry.
MOPITT divides the globe into approximately 1,000,000 individual cells, or pixels, and makes a measurement over each one every four days. Each pixel is about 22 kilometers square, small enough so that emissions from individual cities can be measured. MOPITT makes measurements of infrared radiation originating from the surface of the planet and isolates the energy being radiated from CO molecules by using a technique called gas correlation spectroscopy. Because it measures infrared radiation, MOPITT is able to collect data during the night as well as throughout the day. However, MOPITT cannot see through clouds a limitation that causes a gap in data for cloud covered areas. Models are used to estimate values where there are data gaps due to cloud cover.
Funding for the MOPITT instrument is provided by the Space Science Division of the Canadian Space Agency. Funding for the U.S. effort including the development of science data processing software and science data products is provided by the NASA Goddard Space Flight Center.
2. Data Characteristics:
The MOPITT Level-3 (L3) data products provided in this data set are a subset of the daily averages from the L2 data. This subset was produced by overlaying a global 1x1-degree grid onto the L2 data, and then clipping the data to this southern Africa subset which originates at 5 degrees longitude and -35 degrees latitude and extends to 60 degrees longitude and 35 degrees latitude. Data are reported for 2 heights, 700 and 350 hPa, from daytime swaths for the period August 1-September 30, 2000.
These are Version 3 data, which are validated, indicating the retrievals have been rigorously compared to independent observations. Errors are quantifiable and constrained. The data are useful for exploratory and process science studies. Users are expected to review product quality summaries before publication of results.
Data File Format: A description of the data file format is provided in the companion document http://daac.ornl.gov/daacdata/safari2k/remote_sensing/MOPITT_co/comp/S2K_MOPITT_Data_File_Format.pdf.
Data File Variable Definitions:
Variable
Column Heading
Description
Units
UTC Time total seconds
UTC
Seconds in Day
Seconds
LAT
LAT
latitude
Decimal degrees
LON
LON
longitude
Decimal degrees
CO_700hPa ppbv
700
CO mixing ratio at the 700 hPa pressure level for daytime swaths. Consult the Averaging Kernel Explanation Document for interpretation of the profile values. [ avg_krnls_app.pdf ]
ppbv
CO_350hPa ppbv
350
CO mixing ratio at the 350 hPa pressure levels for daytime swaths. Consult the Averaging Kernel Explanation Document for interpretation of the profile values. [ avg_krnls_app.pdf ]
ppbv
Averaging Kernel for 700hPa at 1000hPa
K7_1000
The relative contributions of CO at each different level to the reported CO mixing ratio at the 700 hPa pressure level for daytime swaths.
Consult the Averaging Kernel Explanation Document for an explanation. [avg_krnls_app.pdf]
Unitless
Averaging Kernel for 700hPa at 850hPa
K7_850
Averaging Kernel for 700hPa at 700hPa
K7_700
Averaging Kernel for 700hPa at 500hPa
K7_500
Averaging Kernel for 700hPa at 350hPa
K7_350
Averaging Kernel for 700hPa at 250hPa
K7_250
Averaging Kernel for 700hPa at 150hPa
K7_150
Averaging Kernel for 350hPa at 1000hPa
K3_1000
The relative contributions of CO at each different level to the reported CO mixing ratio at the 350 hPa pressure level for daytime swaths.
Consult the Averaging Kernel Explanation Document for an explanation. [avg_krnls_app.pdf]
Unitless
Averaging Kernel for 350hPa at 850hPa
K3_850
Averaging Kernel for 350hPa at 700hPa
K3_700
Averaging Kernel for 350hPa at 500hPa
K3_500
Averaging Kernel for 350hPa at 350hPa
K3_350
Averaging Kernel for 350hPa at 250hPa
K3_250
Averaging Kernel for 350hPa at 150hPa
K3_150
Example Data File: MOPPITT_SATELLITE_20000801_RO.s2k
50 1001
Edwards, David
NCAR/ACD MOPITT
Measurements Of Pollution In The Troposphere (MOPITT) on the NASA Terra Satellite
SAFARI-2000
1 1
2000 08 01 2006 02 17
-1
UTC Time total seconds
18
1 1 1 1 1 1 1 1 1 1 1 1 1 1 1 1 1 1
-9999 -9999 -9999 -9999 -9999 -9999 -9999 -9999 -9999 -9999 -9999 -9999 -9999 -9999 -9999 -9999 -9999 -9999
LAT
LON
CO_700hPa ppbv
CO_350hPa ppbv
Averaging Kernel for 700hPa at 1000hPa
Averaging Kernel for 700hPa at 850hPa
Averaging Kernel for 700hPa at 700hPa
Averaging Kernel for 700hPa at 500hPa
Averaging Kernel for 700hPa at 350hPa
Averaging Kernel for 700hPa at 250hPa
Averaging Kernel for 700hPa at 150hPa
Averaging Kernel for 350hPa at 1000hPa
Averaging Kernel for 350hPa at 850hPa
Averaging Kernel for 350hPa at 700hPa
Averaging Kernel for 350hPa at 500hPa
Averaging Kernel for 350hPa at 350hPa
Averaging Kernel for 350hPa at 250hPa
Averaging Kernel for 350hPa at 150hPa
0
18
PI_CONTACT_INFO: 303-497-1857, PO BOX 3000 Boulder CO 80307, edwards@ucar.edu
PLATFORM: Terra Satellite
LOCATION: Sun synchronous orbit at 705km
ASSOCIATED_DATA: MOP02 and MOP03 files archived at NASA ASDC
INSTRUMENT_INFO: see www.eos.ucar.edu/mopitt/pubs
DATA_INFO: see http://www.acd.ucar.edu/mopitt/products.shtml
UNCERTAINTY: see http://www.acd.ucar.edu/mopitt/file-spec.shtml
ULOD_FLAG: -7777
ULOD_VALUE: N/A
LLOD_FLAG: -8888
LLOD_VALUE: N/A
DM_CONTACT_INFO: Debbie Mao, NCAR, 303-497-2902, POB 3000 Boulder CO 80307, dmao@ucar.edu
PROJECT_INFO: http://www.acd.ucar.edu/mopitt/
STIPULATIONS_ON_USE: none
OTHER_COMMENTS: none
REVISION: R0
R0:No comments
UTC LAT LON 700 350 K7_1000 K7_850 K7_700 K7_500 K7_350 K7_250
K7_150 K3_1000 K3_850 K3_700 K3_500 K3_350 K3_250 K3_150
23130.599609 -8.500000 59.500000 51.345310 81.665619 0.051425 0.211452 0.379971 0.357288 0.146572 -0.013826 -0.082721 0.003984 0.022402 0.078286 0.173825 0.230786 0.258945 0.252111
23156.251953 -10.500000 59.500000 55.300598 85.368370 0.048256 0.205665 0.367345 0.360358 0.162106 0.001463 -0.052712 0.005371 0.027435 0.082353 0.172893 0.226872 0.251012 0.227627
23156.351562 -9.500000 59.500000 55.870708 81.466812 0.048990 0.209734 0.380502 0.364286 0.150349 -0.017584 -0.083239 0.003862 0.021752 0.078254 0.176816 0.235539 0.260789 0.242519
..........
Site boundaries: (All latitude and longitude given in degrees and fractions)

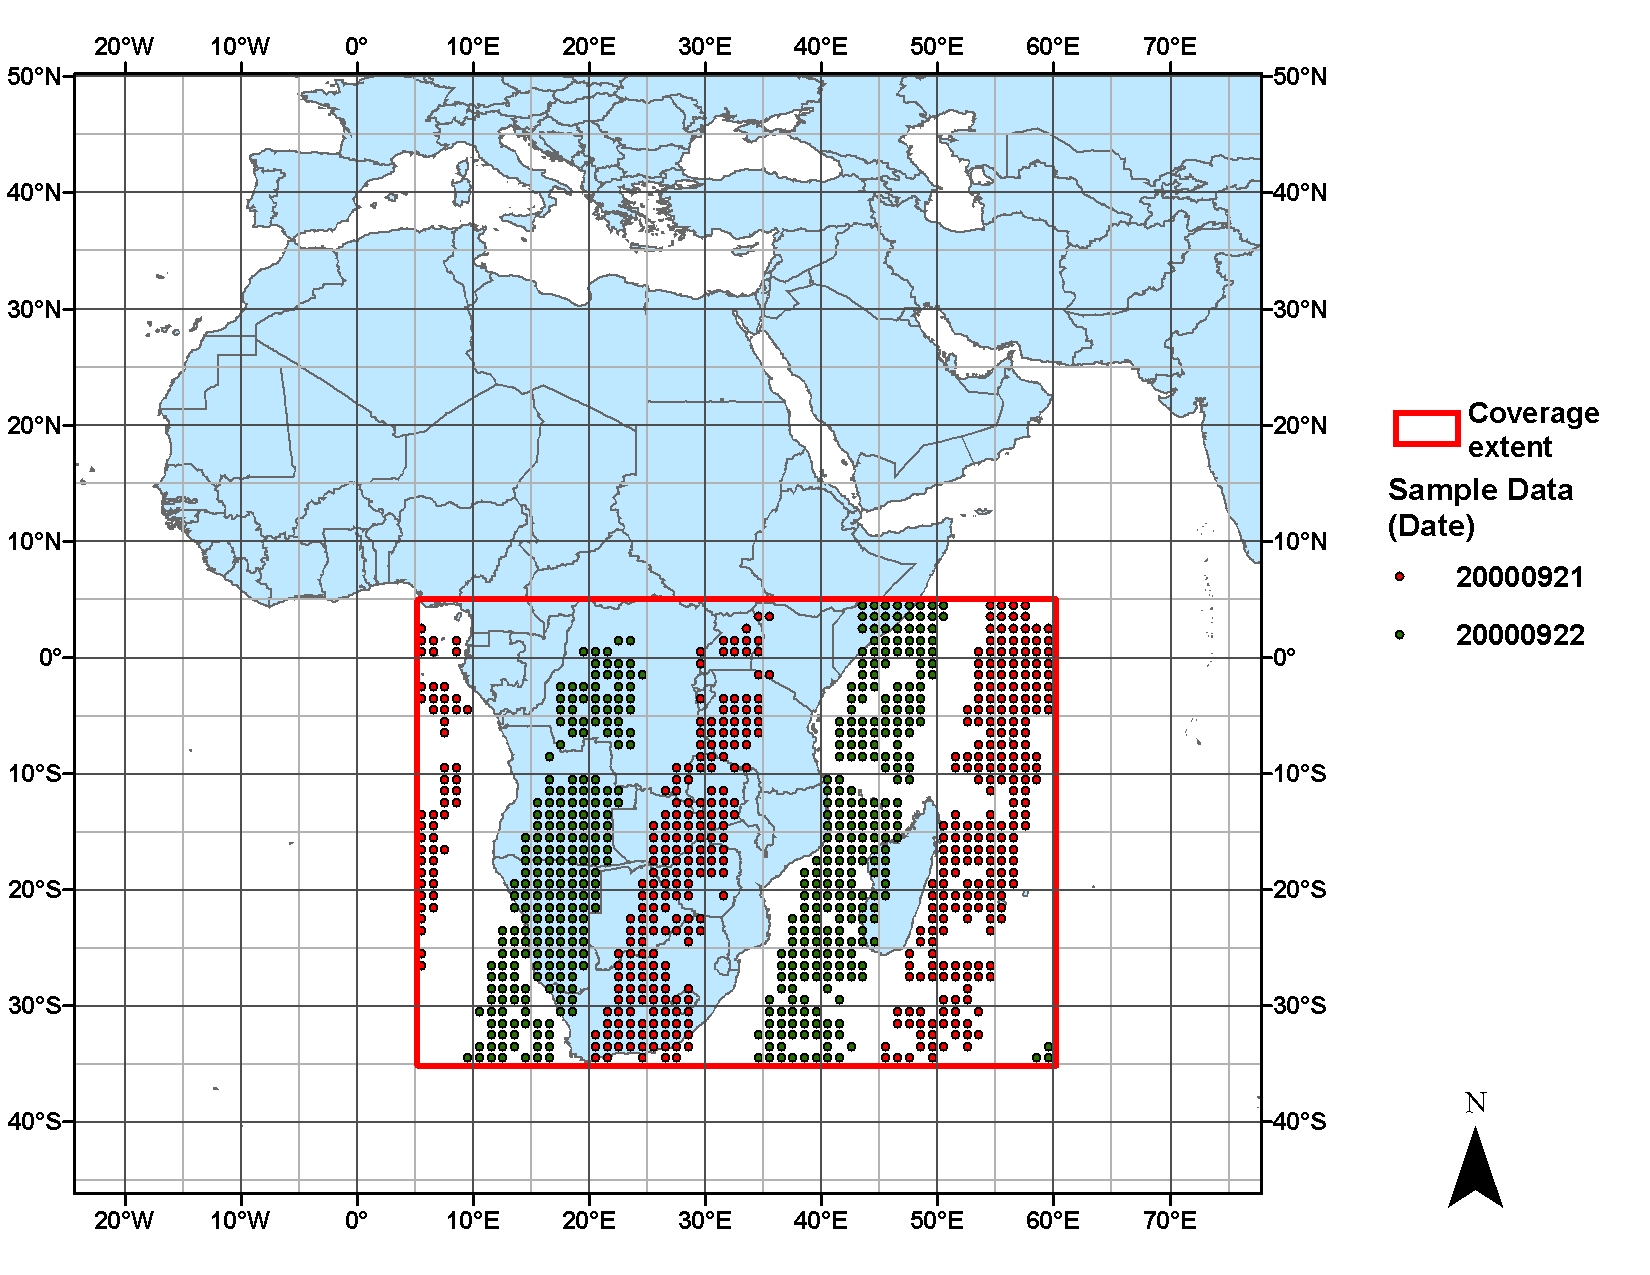
Figure 2. Spatial distribution of daytime swaths on September 21 and 22, 2000 for 1x1-degree grid values for the daily average CO concentration at 700 hPa level for the southern Africa subset.
Site Boundaries:
Site (Region) Westernmost Longitude Easternmost Longitude Northernmost Latitude Southernmost Latitude Geodetic Datum Southern Africa 5 60 5 -35
-
Time period:
- The data set covers the period 2000/08/01 to 2000/09/30.
3. Data Application and Derivation:
The goal of the MOPITT experiment is to enhance our knowledge of the lower atmosphere system and particularly how it interacts with the surface/ocean/biomass systems. The particular focus is the distribution, transport, sources and sinks of carbon monoxide and methane in the troposphere. The project has three elements to it: hardware, data analysis and modeling. The MOPITT instrument, on the NASA EOS Terra satellite, measures the upwelling infrared radiance. Using the technique of correlation spectroscopy [ http://www.acd.ucar.edu/mopitt/concepts.shtml ], information regarding the distribution of atmospheric CO and CH 4 can be extracted. By using appropriate data analysis techniques, concentration profiles of CO are obtained on a global basis at a reasonably high horizontal (~22km) and vertical resolution (~3km). Column amounts of methane are derived over the sunlit side of the orbit. These profiles are assimilated into models to study the chemistry and dynamics of CO, CH4 and other constituents of the lower atmosphere. The measurement of CO profiles is of primary importance in an effort to improve our understanding of the global system. Although CH4 also plays an important role in background atmospheric chemistry, knowledge of the column distribution taken with dynamic data may lead to a better quantitative understanding of its biogeochemical cycles. Methane is increasing in the atmosphere at a rate of about 1%/year but the source of this increase is not certain. Improved knowledge of the source strengths and distributions will help to resolve this uncertainty. The problem of understanding tropospheric chemistry is a very difficult one and requires many interacting disciplines to resolve it.
In order to properly compare MOPITT Level 2 Data with models or other measurements the MOPITT averaging kernels MUST be used. The averaging kernels are also valuable as an indication of the vertical resolution of the measurements. Please consult the document, Calculation and Application of MOPITT Averaging Kernels
[ http://daac.ornl.gov/daacdata/safari2k/remote_sensing/MOPITT_co/comp/avg_krnls_app.pdf ] for the details on calculating and using averaging kernels.
4. Quality Assessment:
5. Data Acquisition Materials and Methods:
data product, provided in this data set, is averaged from the L2 processed data files onto a global 1x1 degree grid. Carbon monoxide (CO) mixing ratio profiles are retrieved on the 6 standard MOPITT pressure levels: 850, 700, 500, 350, 250, 150 hPa, and at the surface, for global clear sky measurements.The contents of Level 2 data files, detailed description of the L3 calculations, and use of averaging kernels are available on the NCAR MOPITT web site [ http://www.acd.ucar.edu/mopitt/file-spec.shtml ]
6. Data Access:
Telephone: +1 (865) 241-3952FAX: +1 (865) 574-4665
Product Availability:
anonymous HTTP site or on various media including, CD-ROMs, 8-MM tapes, or diskettes.7. References:
Bremer, Holger, Jayanta Kar, James R. Drummond, Florian Nichitu, Jiansheng Zou, Jane Liu, John C. Gille, Merritt N. Deeter, Gene Francis, Daniel Ziskin, and Juying Warner. Spatial and temporal variation of MOPITT CO in Africa and South America: A comparison with SHADOZ ozone and MODIS aerosol, J. Geophys. Res., 109, D12304, doi:10.1029/2003JD004234, 2004.
Emmons, L.K., et al., Validation of Measurements of Pollution in the Troposphere (MOPITT) CO retrievals with aircraft in situ profiles, J. Geophys. Res., 109(D3), D03309, 10.1029/2003JD004101, 14 February 2004.