Summary:
This data set contains measurements of atmospheric carbon dioxide (CO2), methane (CH4), carbon monoxide (CO), hydrogen (H2), nitrous oxide (N2O), and sulfur hexafluoride (SF6) collected from December 2000-November 2005 as vertical profiles above three sites in Brazil: Fortaleza, Santarem, and Manaus.
At Santarem, ascending profiles were made above the Tapajos National Forest, near the km 67 Tower Site. At Manaus, ascending profiles were made above the K34 flux tower (aka, ZF2 km 34 tower) to the northwest of the city of Manaus. Descending profiles were flown nearby, but at locations upwind of population centers to avoid possible pollution. Fortaleza samples were collected off the coast, over the Atlantic Ocean to sample background air before it flows over the Amazon Basin.
Air samples were collected as discrete samples aboard light aircraft and shipped to laboratories for analysis relative to internationally accepted calibration standards.
There are three comma-delimited (.csv) data files with this data set.
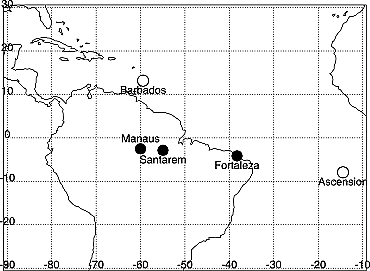
Figure 1. Map of sites sampled in this study. Open circles are marine boundary layer (MBL) background sites and filled circles are vertical profile sites within Brazil (Miller et al., 2007).
Data Citation:
Cite this data set as follows:
Miller, J.B., L.V. Gatti, M.T.S. D'Amelio, A. Crotwell, E. Dlugokencky, P.S. Bakwin, P. Artaxo, and P. Tans. 2013. LBA-ECO TG-06 Vertical Profiles of Atmospheric Trace Gases over the Amazon Basin. Data set. Available on-line [http://daac.ornl.gov] from Oak Ridge National Laboratory Distributed Active Archive Center, Oak Ridge, Tennessee, USA. http://dx.doi.org/10.3334/ORNLDAAC/1175
Implementation of the LBA Data and Publication Policy by Data Users:
The LBA Data and Publication Policy [http://daac.ornl.gov/LBA/lba_data_policy.html] is in effect for a period of five (5) years from the date of archiving and should be followed by data users who have obtained LBA data sets from the ORNL DAAC. Users who download LBA data in the five years after data have been archived must contact the investigators who collected the data, per provisions 6 and 7 in the Policy.
This data set was archived in July 2013. Users who download the data between July 2013 and June 2018 must comply with the LBA Data and Publication Policy.
Data users should use the investigator contact information in this document to communicate with the data provider.
Data users should use the data set citation and other applicable references provided in this document to acknowledge use of the data.
Table of Contents:
- 1 Data Set Overview
- 2 Data Characteristics
- 3 Applications and Derivation
- 4 Quality Assessment
- 5 Acquisition Materials and Methods
- 6 Data Access
- 7 References
1. Data Set Overview:
Project: LBA (Large-Scale Biosphere-Atmosphere Experiment in the Amazon)
Activity: LBA-ECO
LBA Science Component: Atmospheric Chemistry
Team ID: TG-06 (Tans / Miller / Artaxo / Gatti / Martinelli)
The investigators were Miller, John Bharat; Tans, Pieter P.; Artaxo, Paulo; Gatti, Luciana Vanni; Martinelli, Luiz Antonio; Crotwell, Andrew Michael; Guenther, Doug; Moreira, Marcelo Zacharias; Polakiewicz, Lilian; Procopio, Aline Sarmento; Rizzo, Luciana Varanda; Siqueira D'Amelio, Monica Tais and Thoning, Kirk. You may contact Miller, John (john.b.miller@noaa.gov).
LBA Data Set Inventory ID: TG06_Vertical_Profiles
This data set contains measurements of atmospheric carbon dioxide (CO2), methane (CH4), carbon monoxide (CO), hydrogen (H2), nitrous oxide (N2O), and sulfur hexafluoride (SF6) collected from December 2000-November 2005 as vertical profiles above three sites in Brazil: Fortaleza, Santarem, and Manaus. Air samples were collected as discrete samples aboard light aircraft and shipped to laboratories for analysis relative to internationally accepted calibration standards.
At Santarem, ascending profiles were made above the Tapajos National Forest, near the km 67 Tower Site. At Manaus, ascending profiles were made above the K34 flux tower (aka, ZF2 km 34 tower) to the northwest of the city of Manaus. Descending profiles were flown nearby, but at locations upwind of population centers to avoid possible pollution. Fortaleza samples were collected off the coast, over the Atlantic Ocean to sample background air before it flows over the Amazon Basin.
2. Data Characteristics:
There are three comma-delimited (.csv) files of atmospheric chemistry data with this data set. When expanded each file contains a (.csv) data file for that site. Data were collected over three primary sites: Fortaleza, Santarem, and Manaus, Brazil.
Spatial Resolution: Spatial resolution of the air sampling is a function of the groundspeed of the aircraft and the time taken to fill a sampling flask. Given a groundspeed of 200 km/hr, and a 30 second sampling time, we estimate that the air sample integrates over about 2 km, which projects onto a portion of a typical profile sampling circumference of about 10 km.
VARIABLES AND DESCRIPTIONS:
The 3 .csv data files are named as site.csv
where site= 'san' (santarem), 'ftl' (fortaleza), or 'man' (manaus).
Table 1. Variables for the 3 .csv data files.
The variables are dry air mole fractions of the following gases: CO2, CH4, CO, H2, N2O, SF6 and the 13C/12C ratio of CO2 (and the 18O/16O ratio of CO2, which is not valid due to moisture contamination in sampling). Isotopic ratios are only available on samples obtained prior to 2004.
| Column | Heading | Units/format | Description |
|---|---|---|---|
| 1 | sta | Three-letter site code: 'san' (santarem); 'ftl' (fortaleza); 'man' (manaus) | |
| 2 | year | yyyy | The UTC year when the sample was collected (yyyy) |
| 3 | month | mm | The UTC month when the sample was collected (mm) |
| 4 | day | dd | The UTC day when the sample was collected (dd) |
| 5 | hour | hh | The UTC time (hour) of sample collection (hh) |
| 6 | minutes | mm | The UTC time (minutes) of sample collection (mm) |
| 7 | flask_sample_ID | Identification number of sampling flask; this field can contain up to eight characters (letters as well as numbers) | |
| 8 | code_collection_method | A one letter code ("A") that identifies the sample collection method | |
| 9 | Latitude | decimal degrees | Latitude during collection in decimal degrees |
| 10 | Longitude | decimal degrees | Longitude during collection in decimal degrees |
| 11 | Altitude | m | Altitude during collection in meters above sea level |
| 12 | air_ temp | degrees C | Air temperature in degree C (default = -40.0) |
| 13 | air_ pressure | millibars | Air pressure in millibars (default = -99.0) |
| 14 | relative_ humidity | % | Percent relative humidity (default = 11.3) |
| 15 | CMDL_ number | Internal CMDL event number; unique for each sampling event | |
| NOTE: For the last variables, a three-character flag was used to indicate the results of the data selection process. An alphanumeric other than a period (.) in the FIRST column indicates samples with obvious problems during sample collection or analysis. An alphanumeric other than a period (.) in the SECOND column indicates samples which are believed to be non-background. An alphanumeric other than a period (.) in the THIRD column is a sample qualifier that is not presently used. Example flag: A.. this flag indicates that there was a problem with the sample collection or analysis. | |||
| 16 | CO2_mix_ratio | ppm | CO2 mixing ratio in ppm (micromole CO2/mole dry air (ppm)). A three-character flag follows the value |
| 17 | flag | A three-character flag used to indicate the results of the data selection process | |
| 18 | CH4_mix_ratio | ppb | CH4 mixing ratio in ppb (nanomole CH4/mole dry air (ppb)). A three-character flag follows the value. |
| 19 | flag | A three-character flag used to indicate the results of the data selection process | |
| 20 | CO_mix_ratio | ppb | CO mixing ratio in ppb (nanomole CO/mole dry air (ppb)). A three-character flag follows the value. |
| 21 | flag | A three-character flag used to indicate the results of the data selection process | |
| 22 | H2_mix_ratio | ppb | H2 mixing ratio in ppb (nanomole H2/mole dry air (ppb). A three-character flag follows the value. |
| 23 | flag | A three-character flag used to indicate the results of the data selection process | |
| 24 | N2O_mix_ratio | ppb | N2O mixing ratio in ppb (nanomole N2O/mole dry air (ppb)). A three-character flag follows the value. |
| 25 | flag | A three-character flag used to indicate the results of the data selection process | |
| 26 | SF6_mix_ratio | ppt | SF6 mixing ratio in ppt picomole SF6/mole dry air (ppt)). A three-character flag follows the value. |
| 27 | flag | A three-character flag used to indicate the results of the data selection process | |
| 28 | d13C_CO2_isotope_ratio | per mil | d13C (CO2) isotope ratio in per mil (per mil relative to V-PDB). A three-character flag follows the value. |
| 29 | flag | A three-character flag used to indicate the results of the data selection process | |
| 30 | d18O_CO2_isotope_ratio | per mil | d18O (CO2) isotope ratio in per mil. A three-character flag follows the value. |
| 31 | flag | A three-character flag used to indicate the results of the data selection process | |
NOTES:
Missing values are denoted by -999.999
D18O CO2 DATA ARE NOT RELIABLE DUE TO HUMIDITY CONTAMINATION.
WARNING: YOU MUST PAY ATTENTION TO THE FLAG VARIABLES IN THE DATA SET AS WE INCLUDE **ALL** DATA, EVEN THOSE WITH KNOWN ERRORS.
Example Data Records: MAN.csv
|
sta,year,month,day,hour,minutes,flask_sample_ID,code_collection_method,Latitude,Longitude, Altitude,air_temp,air_pressure,relative_ humidity, CMDL_ number, CO2_mix_ratio,flag,CH4_mix_ratio,flag,CO_mix_ratio,flag,H2_mix_ratio,flag,N2O_mix_ratio,flag, SF6_mix_ratio,flag,d13C_CO2_isotope_ratio,flag,d18O_CO2_isotope_ratio ,flag MAN,2004,12,20,13,29,215-01,A,-2.3,-59.05,3657.6,-999.9,-9999.9,-999.9,282, -999.9,A..,1826.086,...,442.71,...,604.35,...,321.09,...,5.5,..., -999.999,*..,-999.999,*.. MAN,2004,12,20,14,8,215-02,A,-2.3,-59.05,3048,-999.9,-9999.9,-999.9,283, -999.9,A..,1777.197,...,127.57,...,530.7,...,318.91,...,5.48,..., -999.999,*..,-999.999,*.. ... |
Site boundaries: (All latitude and longitude given in decimal degrees)
| Site (Region) | Westernmost Longitude | Easternmost Longitude | Northernmost Latitude | Southernmost Latitude | Geodetic Datum |
|---|---|---|---|---|---|
| Ceara - Fortaleza (Ceara) | -41.5 | -37 | -2.5 | -4.5 | World Geodetic System, 1984 (WGS-84) |
| Amazonas (Manaus) - ZF2 km 34 (Amazonas (Manaus)) | -60.20910 | -60 | -2.500 | -2.60900 | World Geodetic System, 1984 (WGS-84) |
| Para Western (Santarem) - km 67 Primary Forest Tower Site (Para Western (Santarem)) | -54.95900 | -54.9590 | -2.85700 | -2.85700 | World Geodetic System, 1984 (WGS-84) |
Time period:
- The data set covers the period 2000/12/07 to 2005/11/01
- Temporal Resolution:~monthly; irregular
Platform/Sensor/Parameters measured include:
- AIRCRAFT / NDIR GAS ANALYZER / CARBON DIOXIDE
- AIRCRAFT / GC (GAS CHROMATOGRAPH) / CARBON DIOXIDE
- AIRCRAFT / MASS SPECTROMETER / CARBON DIOXIDE
- AIRCRAFT / GC (GAS CHROMATOGRAPH) /SULFUR COMPOUNDS
- AIRCRAFT / GC (GAS CHROMATOGRAPH) / NITROGEN COMPOUNDS
3. Data Application and Derivation:
Typical Application of Data: The data are most useful for the evaluation and estimation of surface trace gas fluxes. See Miller et al., 2007, for an example.
Theory of Measurements: The theory of the measurements is based on standard optical absorption (CO2), gas chromatographic (CH4, CO, H2, N2O, SF6) and isotope mass spectrometric techniques (d13CO2). However, the most important aspect of these measurements is the attention paid to careful calibration relative to World Meteorological Organization (WMO) standards.
4. Quality Assessment:
Data Usage Guidance: Users should keep in mind issues of representativeness of aircraft trace gas measurements. In general, data closer to the ground has a small footprint. But, the extent of the 'footprint' of these measurements is an open research question. That said, we feel that these measurements are influenced by 'regional' as opposed to 'local' sources, which we define for the time-being as: regional ~ 10^5 - 10^6 km^2; local ~ 10^2 - 10^3 km ^2.
Mole fraction measurements were made relative to NOAA scales, which in most cases are the sanctioned WMO scale for the trace gas.
Measurement precision for each gas:
a. CO2 0.1 ppm
b. CH4 1-2 ppb
c. CO 1 ppb
d. H2 5 ppb
e. N2O 0.3 ppb
f. SF6 0.05 ppt
g. d13C 0.01 per mil
h. d18O xxx [data corrupted]
Known Problems with the Data: Problematic data are identified with flags in the data files.
WARNING: YOU MUST PAY ATTENTION TO THE FLAG VARIABLES IN THE DATA SET AS **ALL DATA WERE INCLUDED**, EVEN THOSE WITH KNOWN ERRORS.
Quality Assessment Activities:
When samples were measured in the lab, tanks of air, treated as unknowns were also measured. The long-term stability of these unknowns and the lack of bias relative to their independently known values suggests that the accuracy of our measurements is of the same order as the measurement precisions listed above.
5. Data Acquisition Materials and Methods:
Sample Collection and Analyses:
Air samples were collected during regular (weekly) flights over the Santarem area and over the Atlantic Ocean off the coast near Fortaleza using small charter aircraft.
Air was collected with portable sampling systems consisting of separate compressor and flask units (NOAA programmable flask package). These units are loaded onto a light aircraft, and the pilot initiated sample collection at predetermined altitudes. Most flights consisted of one descending and one ascending profile from 3,600 m to 300 m.
From 2000 to 2003, samples collected in Brazil were sent to the NOAA lab in Boulder, USA, where they were analyzed for CO2, CH4, CO, N2O, SF6, and H2 and the stable isotopes of C and O in CO2. From 2004 to 2005, a replica of the NOAA analysis system began operating in Brazil at Instituto de Pesquisas Energe´ticas e Nucleares (IPEN), with precision and accuracy similar to that at NOAA.
At Santarem, ascending profiles were made above the Tapajos National Forest, near the km 67 tower that is located about 10 km to the east of the Tapajos River. For the first 4 years, descending profiles were made 30 km to the east of the tower to evaluate possible impacts of fluxes from the river (Richey et al., 2002).
At Manaus, ascending profiles were made above the K34 tower (aka, ZF2 km 34 tower) to the northwest of the city of Manaus (population 1.8 million), following descending profiles 50 km to the northeast of Manaus, in order to avoid possible pollution from Manaus at the K34 tower, which can be downwind of the city.
The samples were collected in 17 glass flasks using automated equipment, and shipped to the laboratory in Boulder or IPEN for analysis for CO2, CO, CH4, H2, N2O, SF6 and the stable isotopes of C and O in CO2.
The companion file (TG06_Vertical_Profiles_readme.txt) provides a summary of the site, coordinates, predefined sampling altitudes, and notes for sample collections.
Sampling and Analyses instrumentation:
Air samples were collected using a programmable flask package (PFP) and samples were analyzed on a suite of instruments in the lab using the following technologies:
CO2: NDIR (Nondispersive Infrared Sensor)
CH4: GC-FID (Gas Chromatograph(y) - Flame Ionization Detector)
CO: GC-RGD (Gas Chromatograph(y) - Reduction Gas Detector)
H2: GC-RGD (Gas Chromatograph(y) - Reduction Gas Detector)
N2O: GC-ECD (Gas Chromatograph(y) - Electron Capture Detector)
SF6: GC-ECD (Gas Chromatograph(y) - Electron Capture Detector)
d13CO2: Isotope Ratio Mass Spectrometer
6. Data Access:
These data are available through the Oak Ridge National Laboratory (ORNL) Distributed Active Archive Center (DAAC).
Data Archive Center:
Contact for Data Center Access Information:
E-mail: uso@daac.ornl.gov
Telephone: +1 (865) 241-3952
7. References:
Miller, J. B., L. V. Gatti, M. T. S. D'Amelio, A. Crotwell, E. Dlugokencky, P. S. Bakwin, P. Artaxo, and P. Tans. 2007. Airborne sampling reveals large methane enhancement over the Amazon basin, Geophys. Res. Lett., 34 (L10809, doi:10.1029/2006GL029213.).
Related Publications
- Meirink, J. F., P. Bergamaschi, C. Frankenberg, M. T. S. D'Amelio, E. Dlugokencky, L. Gatti, S. Houweling, J. B. Miller, T. Rockmann, M. G. Villani, and M. Krol (2008), Four-dimensional Variational Data Assimilation for Inverse Modelling of Atmospheric Methane Emissions: Analysis of SCIAMACHY Observations Journal Geophsy. Res., In Press.