Get Data
Summary:
This data set reports the results of chemical analyses of rainfall, throughfall, litter leachate, and soil water samples collected before, during, and after a rainfall exclusion experiment conducted at the km 67 Seca Floresta site, Tapajos National Forest, Brazil. Samples were collected every two weeks from May 17, 1999 through May 10, 2006. Measurements included alkalinity, conductivity, pH, and selected anions and cations analyzed by ion chromatography.
The exclusion treatment, began in late January 2000 and continued through December 2004, involved diverting about 60% of throughfall (equivalent to approximately half the rainfall) from a 1-hectare plot (i.e., dry) using plastic panels installed in the understory. The comparable 1-hectare control plot (i.e., wet) was unaltered. The purpose was to observe the potential effects of severe water stress on a humid Amazonian forest (Nepstad et al., 2002 and Nepstad et al., 2007). There are four comma-delimited data files with this data set.
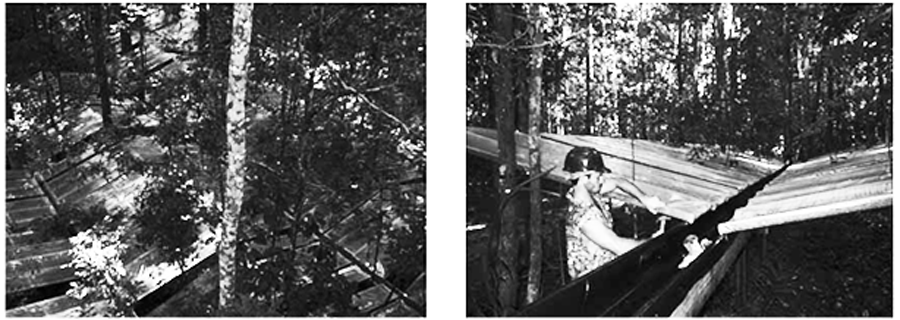
Throughfall exclusion panels, Tapajos National Forest. The throughfall exclusion panels drain into wooden gutters constructed in the forest understory. Photos from Nepstad et al., 2002.
Data Citation:
Cite this data set as follows:
Markewitz, D., R.D.O. Figueiredo, E.A. Davidson, D.C. Nepstad, and A. Krusche. 2012. LBA-ECO ND-30 Water Chemistry, Rainfall Exclusion, km 67, Tapajos National Forest. Data set. Available on-line [http://daac.ornl.gov] from Oak Ridge National Laboratory Distributed Active Archive Center, Oak Ridge, Tennessee, U.S.A. http://dx.doi.org/10.3334/ORNLDAAC/1131
Implementation of the LBA Data and Publication Policy by Data Users:
The LBA Data and Publication Policy [http://daac.ornl.gov/LBA/lba_data_policy.html] is in effect for a period of five (5) years from the date of archiving and should be followed by data users who have obtained LBA data sets from the ORNL DAAC. Users who download LBA data in the five years after data have been archived must contact the investigators who collected the data, per provisions 6 and 7 in the Policy.
This data set was archived in September of 2012. Users who download the data between September 2012 and August 2017 must comply with the LBA Data and Publication Policy.
Data users should use the Investigator contact information in this document to communicate with the data provider. Alternatively, the LBA website [http://lba.inpa.gov.br/lba/] in Brazil will have current contact information.
Data users should use the Data Set Citation and other applicable references provided in this document to acknowledge use of the data.
Table of Contents:
- 1 Data Set Overview
- 2 Data Characteristics
- 3 Applications and Derivation
- 4 Quality Assessment
- 5 Acquisition Materials and Methods
- 6 Data Access
- 7 References
1. Data Set Overview:
Project: LBA (Large-Scale Biosphere-Atmosphere Experiment in the Amazon)
Activity: LBA-ECO
LBA Science Component: Nutrient Dynamics
Team ID: ND-30 (Davidson / Carvalho / Figueiredo / Vieira)
The investigators were Davidson, Eric A.; Carvalho, Claudio Jose Reis de; Figueiredo, Ricardo de Oliveira; Vieira, Ima Celia G.; Almeida, Arlete Silva de; Araujo, Thereza Cristina; Asner, Gregory Paul; Costa, Fabiola Fernandes; Ishida, Francoise Yoko; Leal, Eliane Constantinov; Leao, Luciene Mota de; Leite, Tania de Sousa; Markewitz, Daniel; Oliveira, Patricia Chaves de; Pacheco, Nilza Araujo; Sa, Tatiana Deane De Abreu; Saba, Renata Tuma; Schuler, Marysol A.E.; Silva, Marilia; Silva, Patricio de Souza; Silva, Maria Beatriz da Rosa; Souza, Cleo Marcelo Araujo; Stone, Thomas A. and Vasconcelos, Livia Gabrig Turbay Rangel. You may contact Markewitz, Daniel (dmarke@warnell.uga.edu).
LBA Data Set Inventory ID: ND30_REE_Water_Chemistry
This data set reports the results of chemical analyses of rainfall, throughfall, litter leachate, and soil water samples collected before, during, and after a rainfall exclusion experiment conducted at the km 67 Seca Floresta site, Tapajos National Forest, Brazil. Samples were collected every two weeks from May 17, 1999 through May 10, 2006. Measurements included alkalinity, conductivity, pH, and selected anions and cations analyzed by ion chromatography.
The exclusion treatment, began in late January 2000 and continued through December 2004, involved diverting about 60% of throughfall (equivalent to approximately half the rainfall) from a 1-hectare plot using plastic panels installed in the understory. The comparable 1-hectare control plot was unaltered. The purpose was to observe the potential effects of severe water stress on a humid Amazonian forest (Nepstad et al., 2002 and Nepstad et al., 2007).
Related Data Sets
- LBA-ECO ND-02 SOIL GAS AND WATER CONTENT, RAINFALL EXCLUSION, TAPAJOS NATIONAL FOREST (Studies performed during same time frame, same location)
- LBA-ECO TG-09 SOIL ISOTOPIC C, N, H2O, AND N2O DATA, TAPAJOS NATIONAL FOREST, BRAZIL (Studies performed during same time frame, same location)
- LBA-ECO ND-02 SOIL GAS FLUX, RAINFALL EXCLUSION, KM 67, TAPAJOS NATIONAL FOREST (Studies performed during same time frame, same location)
- LBA-ECO ND-02 SOIL VOLUMETRIC WATER CONTENT, TAPAJOS NATIONAL FOREST, BRAZIL (Volumetric soil measurements from the same site for an overlapping time period)
2. Data Characteristics:
All data were collected between May 17, 1999 and May 10, 2006. There are four comma-delimited ASCII files:
File #1: Rainfall.csv
File #2: Throughfall.csv
File #3: Lysimeter.csv
File #4: Litter_leachate.csv
File #1: Rainfall.csv
| Column | Heading | Units/format | Description |
|---|---|---|---|
| 1 | Sample_code | Sample collection location: Tower-1 or Tower-2 | |
| 2 | Plot_type | Plot type: Exclusion (rainfall exclusion) or Control or N/A (not applicable) | |
| 3 | Sample_type | Sample type: RO = rainfall | |
| 4 | Sample_date | YYYYMMDD | Sample date: (YYYYMMDD) |
| 5 | Month | Sample month | |
| 6 | Year | YYYY | Sample year: 1999 - 2006 (YYYY) |
| 7 | Volume | mL | Sample volume in mL |
| 8 | Conductivity | uS/cm | Conductivity in microSiemans per centimeter (uS/cm) |
| 9 | pH | pH | |
| 10 | Alk_45 | uEq/L | Alkalinity concentration in microequivalents per liter (uEq/L) |
| 11 | Cl | mg/L | Chloride concentration in milligrams per liter (mg/L) |
| 12 | NO3 | mg/L | Nitrate concentration in milligrams per liter (mg/L) |
| 13 | PO4_3 | mg/L | Phosphate concentration in milligrams per liter (mg/L) |
| 14 | SO4_2 | mg/L | Sulfate concentration in milligrams per liter (mg/L) |
| 15 | NH4 | mg/L | Ammonium concentration in milligrams per liter (mg/L) |
| 16 | Na | mg/L | Sodium concentration in milligrams per liter (mg/L) |
| 17 | Ca2 | mg/L | Calcium concentration in milligrams per liter (mg/L) |
| 18 | K | mg/L | Potassium concentration in milligrams per liter (mg/L) |
| 19 | Mg2 | mg/L | Magnesium concentration in milligrams per liter (mg/L) |
| 20 | H | uEq/L | Hydrogen concentration in microequivalents per liter (uEq/L) |
| Missing data or no data due to dry conditions and thus no water sample to analyze, are indicated as -9999 | |||
Example data records: Rainfall.csv
Sample_code,Plot_type,Sample_type,Sample_date,Month,Year,Volume, |
File #2: Throughfall.csv
| Column | Heading | Units/format | Description |
|---|---|---|---|
| 1 | Sample_code | Project sample identifier | |
| 2 | Plot_type | Plot type: Exclusion (rainfall exclusion), Control or not recorded (prior to treatment application) | |
| 3 | Sample_type | Sample type: TF = throughfall | |
| 4 | Sample_date | YYYYMMDD | Sample date |
| 5 | Month | Sample month | |
| 6 | Year | YYYY | Sample year: 1999 - 2006 (YYYY) |
| 7 | Volume | mL | Sample volume in mL |
| 8 | Conductivity | uS | Conductivity in uS |
| 9 | pH | pH | |
| 10 | Alk_45 | uEq/L | Alkalinity concentration in microequivalents per liter (uEq/L) |
| 11 | Cl | mg/L | Chloride concentration in milligrams per liter (mg/L) |
| 12 | NO3 | mg/L | Nitrate concentration in milligrams per liter (mg/L) |
| 13 | PO4_3 | mg/L | Phosphate concentration in milligrams per liter (mg/L) |
| 14 | SO4_2 | mg/L | Sulfate concentration in milligrams per liter (mg/L) |
| 15 | NH4 | mg/L | Ammonium concentration in milligrams per liter (mg/L) |
| 16 | Na | mg/L | Sodium concentration in milligrams per liter (mg/L) |
| 17 | Ca2 | mg/L | Calcium concentration in milligrams per liter (mg/L) |
| 18 | K | mg/L | Potassium concentration in milligrams per liter (mg/L) |
| 19 | Mg2 | mg/L | Magnesium concentration in milligrams per liter (mg/L) |
| 20 | H | mg/L | Hydrogen concentration in milligrams per liter (mg/L) |
| Missing data or no data due to dry conditions and thus no water sample to analyze, are indicated as -9999 | |||
Example data records: Throughfall.csv
|
Sample_code,Plot_type,Sample_type,Sample_date,Month,Year,Volume, Conductivity,pH,Alk_45,Cl,NO3,PO4_3,SO4_2,NH4,Na,Ca2,K,Mg2,H C-4,Not recorded,TF,19990517,may,1999,2275,7.1,5.91,78,0.509,-9999,-9999,0.396, -9999,0.373,0.117,0.615,0.174,1.23 C-5,Not recorded,TF,19990517,may,1999,3450,18.8,6.13,157,0.82,-9999,-9999,0.351, -9999,0.314,0.123,0.492,0.169,0.741 C-6,Not recorded,TF,19990517,may,1999,2890,7.9,5.83,78,0.284,-9999,-9999,0.153, -9999,0.552,0.211,0.181,0.196,1.479 ... K-S3,Exclusion,TF,20010925,sep,2001,1604,15.5,5.79,91,1.463,-9999,-9999,1.062,0.594, 0.665,0.569,1.644,0.341,1.622 K-S4,Exclusion,TF,20010925,sep,2001,1294,21.2,6.18,177,-9999,-9999,-9999,-9999,0.457, 0.892,0.647,2.264,0.536,0.661 K-S9,Exclusion,TF,20010925,sep,2001,1464,15.5,5.88,113,-9999,-9999,-9999,-9999,-9999, -9999,-9999,-9999,-9999,1.318 ... H-U5,Control,TF,20060510,may,2006,5024,3.3,5.96,81,-9999,-9999,-9999,-9999,-9999, -9999,-9999,-9999,-9999,1.096 I-U2,Control,TF,20060510,may,2006,5864,3.2,6.03,75,-9999,-9999,-9999,-9999,-9999, -9999,-9999,-9999,-9999,0.933 J-U2,Control,TF,20060510,may,2006,5064,9.6,6.4,156,-9999,-9999,-9999,-9999,-9999, -9999,-9999,-9999,-9999,0.398 |
File #3: Lysimeter.csv
| Column | Heading | Units/format | Description |
|---|---|---|---|
| 1 | Sample_code | Sample code: first letter indicates exclusion (S= seca in portuguese) or control (U= umido wet in portuguese); followed by pit identification number ( 1-6) and a alphanumeric code for the sample type | |
| 2 | Plot_type | Plot type: Exclusion (rainfall exclusion) or Control | |
| 3 | Sample_type | Sample type: T25 = soil solution collected at 25 cm depth, T200 = tension lysimeter at 200 cm depth | |
| 4 | Lysimeter_type | Lysimeter type: Teflon or Ceramic. Originally teflon tension lysimeters were installed; ceramic tension lysimeters were added later | |
| 5 | Sample_date | YYYYMMDD | Sample date |
| 6 | Month | Sample month | |
| 7 | Year | YYYY | Sample year: 1999 - 2006 (YYYY) |
| 8 | Volume | mL | Sample volume in mL |
| 8 | Conductivity | uS | Conductivity in microSiemens per centimeter (uS/cm) |
| 10 | pH | pH | |
| 11 | Alk_45 | uEq/L | Alkalinity concentration in microequivalents per liter (uEq/L) |
| 12 | Cl | mg/L | Chloride concentration in milligrams per liter (mg/L) |
| 13 | NO3 | mg/L | Nitrate concentration in milligrams per liter (mg/L) |
| 14 | PO4_3 | mg/L | Phosphate concentration in milligrams per liter (mg/L) |
| 15 | SO4_2 | mg/L | Sulfate concentration in milligrams per liter (mg/L) |
| 16 | NH4 | mg/L | Ammonium concentration in milligrams per liter (mg/L) |
| 17 | Na | mg/L | Sodium concentration in milligrams per liter (mg/L) |
| 18 | Ca2 | mg/L | Calcium concentration in milligrams per liter (mg/L) |
| 19 | K | mg/L | Potassium concentration in milligrams per liter (mg/L) |
| 20 | Mg2 | mg/L | Magnesium concentration in milligrams per liter (mg/L) |
| 21 | H | mg/L | Hydrogen concentration in microequivalents per liter (uEq/L) |
| Missing data are indicated as -9999 and zeros represent concentrations below the detection limit | |||
Example data records: Lysimeter.csv
|
Sample_code,Plot_type,Sample_type,Lysimeter_type,Sample_date,Month,Year,Volume,Conductivity,pH, Alk_45,Cl,NO3,PO4,SO4,NH4,Na,Ca,K,Mg,H S1T25,Exclusion,T25,Teflon,19990517,may,1999,-9999,-9999,-9999, -9999,-9999,-9999,-9999,-9999,-9999,-9999,-9999,-9999,-9999,-9999 S2T25,Exclusion,T25,Teflon,19990517,may,1999,-9999,-9999,-9999, -9999,-9999,-9999,-9999,-9999,-9999,-9999,-9999,-9999,-9999,-9999 S3T25,Exclusion,T25,Teflon,19990517,may,1999,-9999,-9999,-9999, -9999,-9999,-9999,-9999,-9999,-9999,-9999,-9999,-9999,-9999,-9999 ... S1T25C,Exclusion,T25,Ceramic,20050629,jun,2005,86,53.7,4.07, -9999,0.455,20.743,-9999,0.697,0.164,0.446,0.76,0.032,0.055,85.114 S2T25C,Exclusion,T25,Ceramic,20050629,jun,2005,25,93.3,3.87, -9999,-9999,-9999,-9999,-9999,-9999,-9999,-9999,-9999,-9999,134.896, S3T25C,Exclusion,T25,Ceramic,20050629,jun,2005,384,33.6,4.16, -9999,0.434,9.422,-9999,0.747,0.122,0.232,0.125,0.037,0.066,69.183 ... U4T200C,Control,T200,Ceramic,20060510,may,2006,230,9.6,4.93, 47,-9999,-9999,-9999,-9999,-9999,-9999,-9999,-9999,-9999,11.749 U5T200C,Control,T200,Ceramic,20060510,may,2006,240,42.8,4.45, -9999,-9999,-9999,-9999,-9999,-9999,-9999,-9999,-9999,-9999,35.481 U6T200C,Control,T200,Ceramic,20060510,may,2006,774,12.9,4.8,41, -9999,-9999,-9999,-9999,-9999,-9999,-9999,-9999,-9999,15.849 |
File #4: Litter_leachate.csv
| Column | Heading | Units/format | Description |
|---|---|---|---|
| 1 | Sample_code | Sample code: first letter indicates exclusion (S= seca in portuguese) or control (U= umido wet in portuguese); the numeric in the second position (1-6) corresponds to the sample collector | |
| 2 | Litter_sampler | Litter sampler type: A=open space between panels (Portuguese 'aberto') F=closed under a panel (Portuguese 'fechado'), or N/A (not applicable) | |
| 3 | Plot_type | Plot type: Exclusion (rainfall exclusion) or Control | |
| 4 | Sample_type | Sample type: L = litter leachate | |
| 5 | Sample_date | YYYYMMDD | Sample date (YYYYMMDD) |
| 6 | Month | Sample month | |
| 7 | Year | YYYY | Sample year: 1999 - 2006 (YYYY) |
| 8 | Volume | mL | Sample volume in mL |
| 9 | Conductivity | uS | Conductivity in uS |
| 10 | pH | pH | |
| 11 | Alk_45 | uEq/L | Alkalinity concentration in microequivalents (uEq/L) |
| 12 | Cl | mg/L | Chloride concentration in milligrams per liter (mg/L) |
| 13 | NO3 | mg/L | Nitrate concentration in milligrams per liter (mg/L) |
| 14 | PO4_3 | mg/L | Phosphate concentration in milligrams per liter (mg/L) |
| 15 | SO4_2 | mg/L | Sulfate concentration in milligrams per liter (mg/L) |
| 16 | NH4 | mg/L | Ammonium concentration in milligrams per liter (mg/L) |
| 17 | Na | mg/L | Sodium concentration in milligrams per liter (mg/L) |
| 18 | Ca2 | mg/L | Calcium concentration in milligrams per liter (mg/L) |
| 19 | K | mg/L | Potassium concentration in milligrams per liter (mg/L) |
| 20 | Mg2 | mg/L | Magnesium concentration in milligrams per liter (mg/L) |
| 21 | H | uEq/L | Hydrogen concentration in microequivalents per liter (uEq/L) |
| Missing data or no data due to dry conditions and thus no water sample to analyze, are indicated as -9999; zeros represent concentrations below the detection limit | |||
Example data records: Litter_leachate.csv
|
Sample_code,Litter_sampler_type,Plot_type,Sample_type,Sample_date,Month,Year, |
Site boundaries: (All latitude and longitude given in decimal degrees)
| Site (Region) | Westernmost Longitude | Easternmost Longitude | Northernmost Latitude | Southernmost Latitude | Geodetic Datum |
|---|---|---|---|---|---|
| Para Western (Santarem) - km 67 Seca-Floresta Site (Para Western (Santarem)) | -55.0000 | -55.0000 | -2.75000 | -2.75000 | World Geodetic System, 1984 (WGS-84) |
Time period:
- The data set covers the period 1999/05/17 to 2006/05/10
- Temporal Resolution: Samples were collected every two weeks
Platform/Sensor/Parameters measured include:
- FIELD INVESTIGATION / LYSIMETERS / SOIL MOISTURE/WATER CONTENT
- LABORATORY / ION CHROMATOGRAPHY / PHOSPHATE
- LABORATORY / ION CHROMATOGRAPHY / NITROGEN COMPOUNDS
- LABORATORY / ION CHROMATOGRAPHY / MAGNESIUM
- LABORATORY / ION CHROMATOGRAPHY / POTASSIUM
- LABORATORY / ION CHROMATOGRAPHY / CALCIUM
- LABORATORY / ION CHROMATOGRAPHY / NITRATE
- LABORATORY / ANALYSIS / RAIN
- LABORATORY / ANALYSIS / ALKALINITY
- LABORATORY / ANALYSIS / PH
3. Data Application and Derivation:
These data can be used to help understand the effects of moist tropical forests in Amazonia and elsewhere which are subjected to increasingly severe drought episodes through the El Nino–Southern Oscillation and possibly through deforestation-driven reductions of rainfall on tropical forest canopy dynamics, emissions of greenhouse gases, and other ecological functions, that are potentially large but poorly understood.
4. Quality Assessment:
Users should be aware that inclusion of zeros in the data set for concentration signifies concentrations below minimum detection limits. In the case of alkalinity a reported zero value relative to an endpoint titration to pH 4.5 may indicate negative alkalinity or acidity but this was not measured.
5. Data Acquisition Materials and Methods:
Site description
The Tapajos National Forest, located in east-central Amazonia, receives 600 to 3,000 mm of rain each year, with a mean of 2,000 mm, most of which falls during the wet season from January to June. The forest is situated on a terrace of tertiary sediments capped by the Belterra Clay Formation (Clapperton, 1993). The Oxisol soil (Haplustox) is acidic (pH 4 to 5), is dominated by kaolinite clay minerals (60 to 80% clay), and is free of hardpan or iron oxide concretions in the upper 12 m; the water table is more than 100 m deep. and experiences severe drought during El Nino events (Nepstad et al., 2002).
The forest surrounding the plots had emergent trees up to 55 m in height, with continuous canopy varying in height from 18 to 40 m. The study plots were placed in areas where most of the canopy was <30 m high to facilitate access to the tree crowns. We selected two floristically and structurally similar, 1-ha (100 x 100 m) plots for the experiment from an initial survey of 20 ha of forest.
Sample collections
Rainfall: We selected two floristically and structurally similar, 1-ha (100 x 100 m) plots for the experiment from an initial survey of 20-ha of forest. Bulk precipitation inputs were collected with a 16-cm diameter funnel located above the canopy in each 1-ha plot.
Throughfall: Throughfall collections were made using ten bottles with 16-cm diameter funnels located below the canopy in each plot. These ten bottles were randomly redistributed on the grid of permanent sampling points after every two-week collection period. The funnels were supported above the throughfall exclusion panels and connected to the collection bottles with plastic tubing.
Soil water: Tension lysimeters were installed at 25 and 200 cm in three soil pits running in a transect through each plot. Samples were collected from the field every two weeks. Low sample water volume was a problem.
Forest litter leachate: Solutions passing immediately below the forest litter layer were collected in three locations per hectare using PVC troughs of 30 x 9 cm. In the exclusion plot, litter leachate collectors were placed beneath openings in the panels.
Analysis
After collection, samples were taken to a laboratory in Santarem, and measured for conductivity, pH and alkalinity (Clesceri et al., 1998), filtered through 0.4 mm polycarbonate filters, and placed in cold storage for later chemical analysis.
Analysis for NO3, NH4, PO4, K, Ca, Mg, SO4, Na, and Cl was performed by ion chromatography at the Centro de Energia Nuclear na Agricultura at the Univ. de Sao Paulo (Nepstad et al., 2002).
6. Data Access:
This data is available through the Oak Ridge National Laboratory (ORNL) Distributed Active Archive Center (DAAC).
Data Archive Center:
Contact for Data Center Access Information:
E-mail: uso@daac.ornl.gov
Telephone: +1 (865) 241-3952
7. References:
Clapperton, C., Quaternary Geology of South America, Elsevier Sci., New York, 1993.
Clesceri, L. S., A. E. Greenberg, and A. D. Eaton, Standard Methods for the Examination of Water and Wastewater 20th Edition, United Book, Baltimore,Md., 1998.
Instrument: Dionex DX 500, Sunnyvale, California, USA
Nepstad, D.C., P. Moutinho, M.B. Dias, E. Davidson, G. Cardinot, D.
Markewitz, R. Figueiredo, N. Vianna, J. Chambers, D. Ray, J.B. Guerreiros, P.
Lefebvre, L. Sternberg, M. Moreira, L. Barros, F.Y. Ishida, I. Tohlver, E. Belk,
K. Kalif, and K. Schwalbe. 2002. The effects of partial throughfall exclusion on
canopy processes, aboveground production, and biogeochemistry of an Amazon
forest. Journal of Geophysical Research-Atmospheres 107(D20).
Nepstad, D.C., Tohver, I.M., Ray, D., Moutinho, P., Cardinot, G. 2007. Mortality of large trees and lianas following experimental drought in an amazon forest. Ecology, 88(9), pp. 2259–2269.