Get Data
Summary:
This data set reports on dissolved nutrient concentrations, as well as dissolved oxygen, alkalinity, conductivity, turbidity, and pH measured in water samples collected from nine streams located in the state of Brasilia, Brazil, between September, 2004 and December, 2006. Streams were located in different land cover types including natural (forest), rural (agricultural), and developed landscapes. In addition, water samples from wells, lysimeters, surface runoff, and precipitation were collected from four sites, 2 natural and 2 rural, and analyzed for nutrient concentrations. Streams were sampled every 2-4 weeks; rain water was collected approximately monthly during the wet season and once during a dry season; wells and lysimeters were sampled monthly; and surface runoff collections were event based. There are three comma-delimited data files with this data set.
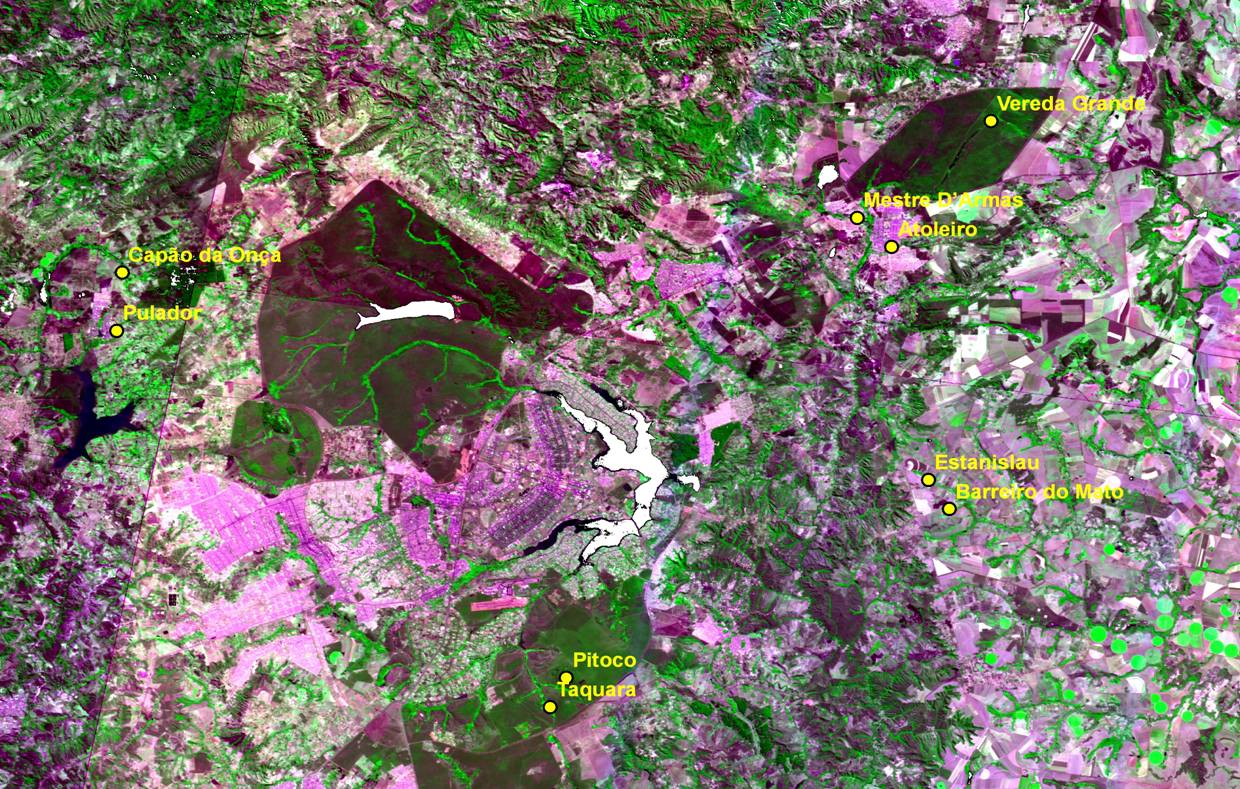
Figure 1. Water samples were collected in three different land cover types from sites near the Brazilian Capital, Brasilia, at the center of the figure. Sites included the natural forested sites at Pitoco, Taquara, and Vereda Grande, rural agricultural sites at Barreiro do Mato and Estanislau, and developed urban sites at Capao da Onca and Mestre D'Armas.
Data Citation:
Cite this data set as follows:
Silva, J.S.O. and M.M.C. Bustamante. 2011. LBA-ECO ND-07 Hydrochemistry of Natural and Developed Land Cover, Brasilia, Brazil. Data set. Available on-line [http://daac.ornl.gov] from Oak Ridge National Laboratory Distributed Active Archive Center, Oak Ridge, Tennessee, U.S.A. http://dx.doi.org/10.3334/ORNLDAAC/1018
Implementation of the LBA Data and Publication Policy by Data Users:
The LBA Data and Publication Policy [http://daac.ornl.gov/LBA/lba_data_policy.html] is in effect for a period of five (5) years from the date of archiving and should be followed by data users who have obtained LBA data sets from the ORNL DAAC. Users who download LBA data in the five years after data have been archived must contact the investigators who collected the data, per provisions 6 and 7 in the Policy.
This data set was archived in August of 2011. Users who download the data between August 2011 and July 2016 must comply with the LBA Data and Publication Policy.
Data users should use the Investigator contact information in this document to communicate with the data provider. Alternatively, the LBA Web Site [http://lba.inpa.gov.br/lba/] in Brazil will have current contact information.
Data users should use the Data Set Citation and other applicable references provided in this document to acknowledge use of the data.
Table of Contents:
- 1 Data Set Overview
- 2 Data Characteristics
- 3 Applications and Derivation
- 4 Quality Assessment
- 5 Acquisition Materials and Methods
- 6 Data Access
- 7 References
1. Data Set Overview:
Project: LBA (Large-Scale Biosphere-Atmosphere Experiment in the Amazon)
Activity: LBA-ECO
LBA Science Component: Nutrient Dynamics
Team ID: ND-07 (Zepp / Bustamante)
The investigators were Zepp, Richard G.; Bustamante, Mercedes M.C.; Bresolin, Joana Dias; Burke, Roger A.; Carvalho, Arminda Moreira; Cruz, Meyr Pereira; da Rocha, Cristiane Oliveira; Fernandes, Erika Barretto; Ferreira, Joice Nunes; Garcia-Montiel, Diana Cecilia; Kisselle, Keith; Kozovits, Alessandra Rodrigues; Markewitz, Daniel; Molina, Marirosa; Parron, Lucilia; Perez, Katia Sueli Sivek; Pinto, Alexandre de Siqueira; Prado, Cesar Coelho; Rosado, Alexandre Soares; Silva, Dulce Alves da; Silva, Jose Salomao Oliveira; Silva, Maria Regina Sartori da; Sousa, Danielle Matias; and Viana, Laura Tillman. You may contact Bustamante, M. (mercedes@unb.br).
LBA Data Set Inventory ID: ND07_Stream_Chemistry_Brasilia
This data set reports on dissolved nutrient concentrations, as well as dissolved oxygen, alkalinity, conductivity, turbidity, and pH measured in water samples collected from nine streams located in the state of Brasilia, Brazil, between September, 2004 and December, 2006. Streams were located in different land cover types including natural (forest), rural (agricultural), and developed landscapes. In addition, water samples from wells, lysimeters, surface runoff, and precipitation were collected from four sites, 2 natural and 2 rural, and analyzed for nutrient concentrations. Streams were sampled every 2-4 weeks; rain water was collected approximately monthly during the wet season and once during a dry season; wells and lysimeters were sampled monthly; and surface runoff collections were event based. There are three comma-delimited data files with this data set.
Related Data sets
- LBA-ECO ND-07 Microbial Biomass in Cerrado Soils, Brasilia, Brazil
- LBA-ECO ND-07 Trace Gas Fluxes Under Multiple Land Uses, Brazil: 1999-2004
2. Data Characteristics:
Data are presented in three comma-delimited ASCII files:File #1: ND07_Streamwater_Chemistry_Brasilia_2004-2006.csv
File #2: ND07_Rainwater_Chemistry_Brasilia_2006.csv
File #3: ND07_Lysimeter_Wells_and_Surfacewater_Chemistry_Brasilia_2004-2006.csv
File #1: ND07_Streamwater_Chemistry_Brasilia_2004-2006.csv
| Column | Heading | Units/format | Description |
|---|---|---|---|
| 1 | Source | Source of water sample: Stream | |
| 2 | Date | YYYY/MM/DD | Collection date |
| 3 | Season | Collection season either wet or dry with dry season defined as consecutive months with less than 200 mm rainfall per month | |
| 4 | Stream | Stream name | |
| 5 | Latitude | decimal degrees | Latitude of stream location in decimal degrees |
| 6 | Longitude | decimal degrees | Longitude of stream location in decimal degrees |
| 7 | Sampling_point | Sampling point along the course of the stream. Sampling points were separated by approximately 70 meters. One or two sampling points per stream location | |
| 8 | Land_cover | Vegetation type either Natural (forest); Rural (agricultural) or Urban | |
| 9 | Hydrogen | uM/L | Concentration of hydrogen ions in micromoles per liter (uM/L) |
| 10 | Conductivity | uS cm-1 | Conductivity of the water sample in microSeimens per cm (uS cm-1) |
| 11 | Alkalinity | uM/L | Alkalinity of the water sample in micromoles CaCO3 per liter (uM CaCO3) |
| 12 | Dissolved_oxygen | mg L-1 | Concentration of dissolved oxygen in milligrams per liter (mg L-1) |
| 13 | NH4 | uM/L | Concentration of dissolved ammonium ions in micromoles per liter (uM/L) |
| 14 | NO2 | uM/L | Concentration of nitrite ions in micromoles per liter (uM/L) |
| 15 | NO3 | uM/L | Concentration of nitrate ions in micromoles per liter (uM/L) |
| 16 | K | uM/L | Concentration of potassium in micromoles per liter (uM/L) |
| 17 | Ca | uM/L | Concentration of calcium ions in micromoles per liter (uM/L) |
| 18 | Mg | uM/L | Concentration of magnesium ions in micromoles per liter (uM/L) |
| 19 | Na | uM/L | Concentration of sodium ions in micromoles per liter (uM/L) |
| 20 | Cl | uM/L | Concentration of chloride ions in micromoles per liter (uM/L) |
| 21 | SO4 | uM/L | Concentration of sulfate ions in micromoles per liter (uM/L) |
| 22 | PO4 | uM/L | Concentration of phosphate ions in micromoles per liter (uM/L) |
| 23 | TDN | uM/L | Concentration of total dissolved nitrogen in micromoles per liter (uM/L) |
| 24 | DOC | uM/L | Concentration of dissolved carbon in micromoles per liter (uM/L) |
| 25 | Turbidity | NTU | Water turbidity in Nephelometric Turbidity Units (NTU) |
| Data not available due to missing analyses or measurements are represented by -9999. Measurements below the detection limit of the analytical instruments are represented by-5555. | |||
Example Data Records:
|
Source,Date,Season,Stream,Latitude,Longitude,Sampling_point,Land_cover,Hydrogen,Conductivity, Alkalinity,Dissolved_oxygen,NH4,NO2,NO3,K,Ca,Mg,Na,Cl,SO4,PO4,TDN,DOC,Turbidity Stream,2004/09/08,Dry,Pitoco,-15.93111,-47.87775,1,Natural,9.55,3.76, 73.61,6.64,5.81,36.03,11.46,5.72,7.63,0.74,51.45,-9999,-9999,0.04,-9999,-9999,-9999 Stream,2004.09.23,Dry,Pitoco,-15.93111,-47.87775,1,Natural,21.88,3.37, 32.46,-9999,4.61,36.48,11.6,3.47,2.57,0.76,42.3,-9999,-9999,0.02,-9999,-9999,-9999 ... Stream,2004/09/09,Dry,Barreiro do Mato,-15.81564,-47.61056,1,Rural,7.76,4.63, 33.77,7.48,6.64,36.03,11.46,5.28,5.72,2.26,52.95,-9999,-9999,0.37,-9999,-9999,-9999 Stream,2004/10/13,Wet,Barreiro do Mato,-15.81564,-47.61056,1,Rural,45.71,6.87, 42.46,5.82,7.07,14.25,4.53,9.01,7.45,3.05,85.73,-9999,-9999,0.02,-9999, -9999, -9999 ... Stream,2004/09/15,Dry, Mestre D'Armas,-15.609806,-47.680139,1,Urban,1.74,16.72, -9999,7.69,8.16,36.03,11.46,8.32,50.87,14.76,84.12,-9999,-9999,0.06,-9999,-9999,-9999 Stream,2004/09/29,Dry,Mestre D'Armas,-15.609806,-47.680139,1,Urban,3.24,16.71, 86.89,9.76,13.14,15.36,4.88,7.12,44.39,14.79,66.2, -9999,-9999,0.13,-9999,-9999,-9999 ... |
File #2: ND07_Rainwater_Chemistry_Brasilia_2006.csv
| Column | Heading | Units/format | Description |
|---|---|---|---|
| 1 | Source | Source of water sample: Rainfall | |
| 2 | Date | YYYY/MM/DD | Collection date |
| 3 | Season | Collection season either wet or dry with dry season defined as consecutive months with less than 200 mm rainfall per month | |
| 4 | Stream | Stream name | |
| 5 | Latitude | decimal degrees | Latitude of stream location in decimal degrees |
| 6 | Longitude | decimal degrees | Longitude of stream location in decimal degrees |
| 7 | Land_cover | Vegetation type either Natural (forest) or Rural (agricultural) | |
| 8 | Hydrogen | uM/L | Concentration of hydrogen ions in micromoles per liter (uM/L) |
| 9 | Conductivity | uS cm-1 | Conductivity of the water sample in microSeimens per cm (uS cm-1) |
| 10 | Alkalinity | uM/L | Alkalinity of the water sample in micromoles CaCO3 per liter (uM/L CaCO3) |
| 11 | NH4 | uM/L | Concentration of ammonium ions in micromoles per liter (uM/L) |
| 12 | NO2 | uM/L | Concentration of nitrite ions in micromoles per liter (uM/L) |
| 13 | NO3 | uM/L | Concentration of nitrate ions in micromoles per liter (uM/L) |
| 14 | K | uM/L | Concentration of potassium ions in micromoles per liter (uM/L) |
| 15 | Ca | uM/L | Concentration of calcium ions in micromoles per liter (uM/L) |
| 16 | Mg | uM/L | Concentration of magnesium ions in micromoles per liter (uM/L) |
| 17 | Na | uM/L | Concentration of sodium ions in micromoles per liter (uM/L) |
| 18 | Cl | uM/L | Concentration of chloride ions in micromoles per liter (uM/L) |
| 18 | SO4 | uM/L | Concentration of sulfate ions in micromoles per liter (uM/L) |
| 20 | PO4 | uM/L | Concentration of phosphate ions in micromoles per liter (uM/L) |
| 21 | TDN | uM/L | Concentration of total dissolved nitrogen in micromoles per liter (uM/L) |
| 22 | DOC | uM/L | Concentration of dissolved organic carbon in micromoles per liter (uM/L) |
| Data not available due to missing analyses or measurements are represented by -9999 Measurements below the detection limit of the analytical instruments are represented by -5555 | |||
Example Data Records:
|
Source,Date,Season,Stream,Latitude,Longitude,Land_cover,Hydrogen,Conductivity,Alkalinity, NH4,NO2,NO3,K,Ca,Mg,Na,Cl,SO4,PO4,TDN,DOC Rainfall,2006/02/08,Wet,Pitoco,-15.93111111,-47.87775,Natural,5.04,4.94,15.18, 5.51,2.02,0.46,15.08,3.75,1.49,4.62,5.76,0.62,-5555,43.64,104.3 Rainfall,2006/08/03,Wet,Pitoco,-15.93111111,-47.87775,Natural,4.79,4.02,15.26, 6.26,2.85,0.64,5.45,9.26,4.52,2.53,4.17,0.92,-5555,32.2,105.02 ... Rainfall,2006/02/02,Wet,Estanislau,-15.79488889,-47.62491667,Rural,4.57,6.8,18.61, 1.07,1.65,0.37,1.42,12.08,5.46,4.95,7.01,0.7, -5555, 47.24, 123.15 Rainfall,2006/02/15,Wet,Estanislau,-15.79488889,-47.62491667,Rural,0.66,5.12,26.59, 3.12,2.83,0.64,4.85,11.44,4.13,3.9,6.53,0.55,-5555,27.47,87.51 ... |
File #3: ND07_Lysimeter_Wells_and_Surfacewater_Chemistry_Brasilia_2004-2006.csv
| Column | Heading | Units/format | Description |
|---|---|---|---|
| 1 | Source | Source of water sample: well, lysimeter or surface runoff collector | |
| 2 | Date | YYYY/MM/DD | Collection date |
| 3 | Season | Collection season either wet or dry with dry season defined as consecutive months with less than 30 mm rainfall per month | |
| 4 | Stream | Stream name | |
| 5 | Latitude | decimal degrees | Latitude of stream location in decimal degrees |
| 6 | Longitude | decimal degrees | Longitude of stream location in decimal degrees |
| 7 | Sampling_point | Sampling point: points 1 and 2 were located between 4 and 20 meters from the stream edge; points 3, 4 and 5 were located between 30 and 120 meters from the stream edge | |
| 8 | Land_cover | Vegetation type either Natural (forest) or Rural (agricultural) | |
| 9 | Depth | m | Depth below the surface at which sample was collected in meters (m) |
| 10 | Hydrogen | uM/L | Concentration of hydrogen ions in micromoles per liter (uM/L) |
| 11 | Conductivity | uS cm-1 | Conductivity of the water sample in microSeimens per cm (uS cm-1) |
| 12 | Alkalinity | uM/L | Alkalinity of the water sample in micromoles CaCO3 per liter (uM/L CaCO3) |
| 13 | NH4 | uM/L | Concentration of ammonium ions in micromoles per liter (uM/L) |
| 14 | NO2 | uM/L | Concentration of nitrite ions in micromoles per liter (uM/L) |
| 15 | NO3 | uM/L | Concentration of nitrate ions in micromoles per liter (uM/L) |
| 16 | K | uM/L | Concentration of potassium ions in micromoles per liter (uM/L) |
| 17 | Ca | uM/L | Concentration of calcium ions in micromoles per liter (uM/L) |
| 18 | Mg | uM/L | Concentration of magnesium ions in micromoles per liter (uM/L) |
| 19 | Na | uM/L | Concentration of sodium ions in micromoles per liter (uM/L) |
| 20 | Cl | uM/L | Concentration of chloride ions in micromoles per liter (uM/L) |
| 21 | SO4 | uM/L | Concentration of sulfate ions in micromoles per liter (uM/L) |
| 22 | PO4 | uM/L | Concentration of phosphate ions in micromoles per liter (uM/L) |
| Data not available due to missing analyses or measurements are represented by -9999. Measurements below the detection limit of the analytical instruments are represented by-5555. | |||
Example Data Records:
|
Source,Date,Season,Stream,Latitude,Longitude,Sampling_point,Land_cover,Depth,Hydrogen, Conductivity,Alkalinity,NH4,NO2,NO3,K,Ca,Mg,Na,Cl,SO4,PO4 Well,2004/09/08,Dry,Pitoco,-15.93111111,-47.87775,1,Natural,-9999,5.37, 29.1,80.98,18.83,35.58,11.31,8.1,48.53,2.96,139.11,-9999,-9999,0.02 Well,2005/07/12,Dry,Pitoco,-15.93111111,-47.877751,Natural,-3,4.85, 9.23,55.57,6.95,3.47,2.06,5.85,2.86,0.97,18.52,19.27,1.56,-5555 ... Lysimeter,2004/12/20,Wet,Pitoco,-15.93111111,-47.87775,1,Natural,-0.5,5.48, 45.6,283.77,27.58,58.51,18.6,15.56,117.81,6.74,66.72,-9999,-9999,-5555 Lysimeter,2005/01/03,Wet,Pitoco,-15.93111111,-47.87775,1,Natural,-0.5,4.77, 9.9,86.56,10.32,13.98,4.45,9.99,35.62,7.25,31.88,-9999,-9999,0.27 .. Runoff, 2004/10/15,Wet, Barreiro do Mato,-15.81564,-47.610556,1,Rural,-9999,2.24, 50.3,95.41,30.13,14.7,4.68,199.02,34.16,27,88.93,-9999,-9999,6.87 Runoff,2004/1116,Wet, Barreiro do Mato,-15.81564,-47.610556,1, Rural,-9999,5.62, 48.3,-9999, .08,14.64,4.65,463.68,42.24,41.75,73.65,-9999,-9999,1.01 ... |
Site boundaries: (All latitude and longitude given in decimal degrees)
| Site (Region) | Westernmost Longitude | Easternmost Longitude | Northernmost Latitude | Southernmost Latitude | Geodetic Datum |
|---|---|---|---|---|---|
| Mestre D Armas - Planaltina (Brasilia) | -47.67181 | -47.67181 | -15.60981 | -15.60981 | World Geodetic System, 1984 (WGS-84) |
| Atoleiro - Planaltina (Brasilia) | -47.64811 | -47.64811 | -15.63058 | -15.63058 | World Geodetic System, 1984 (WGS-84) |
| Brasilia - Reserva Ecologica Aguas Emendadas (Brasilia) | -47.60000 | -47.60000 | -15.55000 | -15.55000 | World Geodetic System, 1984 (WGS-84) |
| Estanislau - Chacara 117 (Brasilia) | -47.62492 | -47.62492 | -15.795 | -15.795 | World Geodetic System, 1984 (WGS-84) |
| Brazlandia - Pulador Stream (Brasilia) | -48.18592 | -48.18592 | -15.6825 | -15.6825 | World Geodetic System, 1984 (WGS-84) |
| Barreiro do Mato - Dimas Farm (Brasilia) | -47.61056 | -47.61056 | -15.81564 | -15.81564 | World Geodetic System, 1984 (WGS-84) |
| Brasilia - Reserva Ecologica do Roncador IBGE (Brasilia) | -47.85060 | -47.85060 | -15.93280 | -15.93280 | World Geodetic System, 1984 (WGS-84) |
| Pitoco - In the Reserva Ecologica do Roncador IBGE (Brasilia) | -47.87778 | -47.87778 | -15.93111 | -15.93111 | World Geodetic System, 1984 (WGS-84) |
| Taquara - In the Reserva Ecologica do Roncador IBGE (Brasilia) | -47.88917 | -47.88917 | -15.95167 | -15.95167 | World Geodetic System, 1984 (WGS-84) |
| Brazlandia - Capao da Onca Stream (Brasilia) | -48.18139 | -48.18139 | -15.64153 | -15.64153 | World Geodetic System, 1984 (WGS-84) |
Time period:
- The data set covers the period 2004/09/08 to 2006/12/22
- Temporal Resolution: Streams were sampled every 2-4 weeks; rain water was collected approximately monthly during the wet season and once during a dry season; wells and lysimeters were sampled monthly; and surface runoff collections were event based
Platform/Sensor/Parameters measured include:
- FIELD INVESTIGATION / ANALYSIS / ALKALINITY
- FIELD INVESTIGATION / CONDUCTIVITY METERS / CONDUCTIVITY
- FIELD INVESTIGATION /TURBIDITY METERS / TURBIDITY
- LABORATORY /ION CHROMATOGRAPH / WATER ION CONCENTRATION
3. Data Application and Derivation:
These data in combination with rainfall and streamflow data provide essential information for nutrient budgets for differing land-uses. The extensive record allows for the assessment of interannual variations.
Note that neither steam flow nor precipitation data were provided with this data set. The water samples were collected under base flow conditions except for five collections made during the wet season under storm flow conditions (three times in natural streams (Mar/2006; Dec/2006; Jan/2007) and twice in rural streams (Dec/2006 and Jan/2007)). During sampling under storm flow events stream water level ranged from 67 to 92 cm for Barreiro do Mato stream while for Taquara and Pitoco streams the variations were 65 to 95 and 35 to 38 cm respectively (Silva et al., submitted 2011).
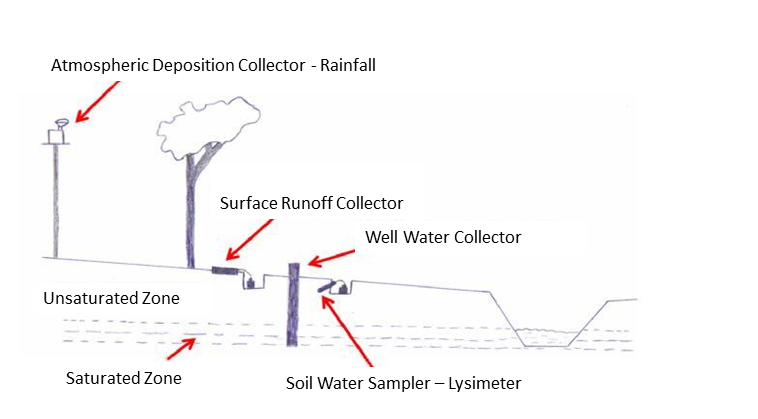
Figure 2. Illustration of the placement of sample collectors in the riparian zone of study streams. After Silva (2008).
4. Quality Assessment:
Data have been reviewed and there are no known problems or expected revisions. The detection limit for ion concentrations (NH4+, NO2-, NO3-, K-, Ca+2, Mg+2, Na+, Cl-, SO4- and PO4-) was 0.05 mg/l.
5. Data Acquisition Materials and Methods:
Field sampling:
Water was sampled from
sites with three different types of
land cover in Brasilia, Brazil:
natural (forest), rural (agricultural), or urban. Natural stream sites
were located at Pitoco, Taquara, and Vereda Grande. Rural sites included Barreiro do Mato, Capao da Onca,
and Estanislau. The urban stream sites sampled were Atoleiro, Mestre
D'Armas, and the basin of the Pulador stream. Samples were collected from streams, rainwater, surface water
run-off, and wells, during the wet and dry seasons.
Stream water was collected directly in the streams from all three different land cover types. Natural stream sites sampled were located at Pitoco, Taquara, and Vereda Grande, rural sites included Barreiro do Mato, Capao da Onca, and Estanislau, and urban stream sites sampled were Atoleiro and Mestre D'Armas, in the city of Planaltina, and the basin of the Pulador, located near Brazlandia. 250-ml polypropylene bottles were used to collect the samples and immediately stored in iceboxes. Electrical conductivity, pH, and dissolved oxygen measurements were taken in situ.
Electrical conductivity and pH were logged with a multi-parameter sonde (OAKTON 10 series), while dissolved oxygen was measured using an oximeter
(AP 64 - Fisher Scientific).
Pressure lysimeters were installed at 50 centimeter depth at
the Pitoco and Taquara natural sites, and Barreiro do Mato and Estanislau
rural sites. 60 bars of pressure were applied to the lysimeters using a vacuum pump, and collected soil water samples were stored in a glass bottle in situ until the next collection point.
Well water was sampled
at the Pitoco and Taquara natural sites, and Barreiro do Mato and Estanislau
rural sites.
Rainfall was collected from the Pitoco and Taquara natural sites, and Estanislau rural site. Rainfall collectors were composed of a 5 L polyethylene bottle which was painted with one layer of black paint and a second layer of white paint to reduce the possibility of algal growth and a 18-cm diameter polypropylene funnel which was covered by a fine nylon mesh (2 mm openings) to prevent the introduction of insects or other contaminants. Collectors were attached to wooden posts at 2.3 m above the ground in an open area.
Surface runoff was collected from the Pitoco and Taquara natural sites, and Estanislau and Barreiro do Mato rural sites. Collectors were wooden frames (1 m long x 2 m wide x 0.1 m height) installed in the ground so that 0.07 m of the height was buried. Collector sites were chosen where there was sufficient downward slope to allow for the drainage of surface runoff. PVC tubing was connected to the lower edge of the frame in order to channel the surface runoff into a polyethylene bottle, similar to the ones used in the rainfall collectors. This bottle was installed in the soil below the collector frame and connected to the lower edge by plastic tubing.
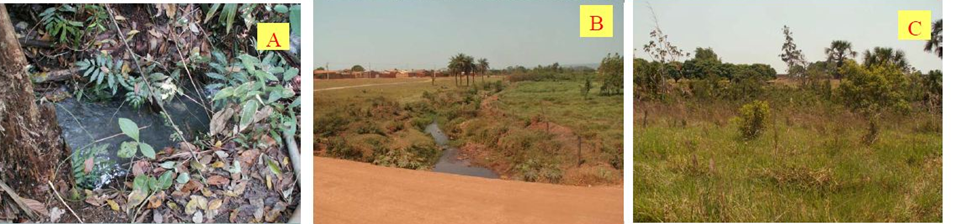
Figure 3. Typical streams sampled in A) natural, B) urban, and C) rural land cover types. From Silva (2008).
Chemical analyses:
In the laboratory, unfiltered aliquots were taken for alkalinity and turbidity, while aliquots filtered through cellulose acetate filters (nominal pore size 0.45 mm) were used for DOC, TDN and major ion analyses.
Turbidity was determined with a turbidimeter (HACH 2001 NA). Alkalinity determinations were by endpoint titrations with H2SO4 0.002 N to pH 4.5, DOC was determinate with a carbon analyzer (Shimadzu TOC 5000, Columbia, Maryland, USA), TDN with persulfate digestion (Koroleff 1983) and major ions by Liquid Ion Chromatography (Dionex DX 500, Sunnyvale, California, USA).
6. Data Access:
This data is available through the Oak Ridge National Laboratory (ORNL) Distributed Active Archive Center (DAAC).
Data Archive Center:
Contact for Data Center Access Information:
E-mail: uso@daac.ornl.gov
Telephone: +1 (865) 241-3952
7. References:
Koroleff, F. 1983. Total & organic nitrogen. In: K. Grasshoff, M. Ehrardt and K. Kremling, Editors, Methods of Seawater Analysis, Verlag Chemie, Weinheim, pp. 162-173.
Silva, J.S.O. 2008. Características químicas da agua de córregos do Distrito Federal sob diferentes usos e cobertura do solo. PhD thesis, University of Brasília