Get Data
Summary:
This data set consists of water chemistry data from streams, wells, rainwater, and canopy throughfall samples. The field measurements were carried out at Rancho Grande in the Brazilian state of Rondonia, in the southwestern Brazilian Amazon basin, at two adjacent watersheds, a forest (1.37 ha), and pasture (0.73 ha). Samples were collected during one entire rainy season starting in August 2004 and ending in April 2005. There is one comma-delimited data file with this data set.
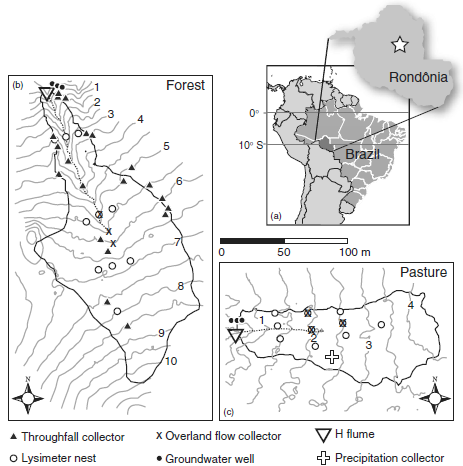
Figure 1. Location of the study site: (a) marker shows the location of Rancho Grande cattle ranch in central Rondonia; (b) forest watershed; (c) pasture watershed. Contour intervals are every 0.5 m; elevations are shown relative to the watershed outlets (flumes). From Chaves et al. 2007.
Data Citation:
Cite this data set as follows:
Neill, C., A.V. Krusche, H. Elsenbeer, S. Germer, S.G. Neto, J.E. Chaves. 2012. LBA-ECO ND-03 Forest and Pasture Watershed Hydrochemistry, Rondonia, Brazil. Data set. Available on-line [http://daac.ornl.gov] from Oak Ridge National Laboratory Distributed Active Archive Center, Oak Ridge, Tennessee, U.S.A. http://dx.doi.org/10.3334/ORNLDAAC/1076
Implementation of the LBA Data and Publication Policy by Data Users:
The LBA Data and Publication Policy [http://daac.ornl.gov/LBA/lba_data_policy.html] is in effect for a period of five (5) years from the date of archiving and should be followed by data users who have obtained LBA data sets from the ORNL DAAC. Users who download LBA data in the five years after data have been archived must contact the investigators who collected the data, per provisions 6 and 7 in the Policy.
This data set was archived in March of 2012. Users who download the data between March 2012 and February 2017 must comply with the LBA Data and Publication Policy.
Data users should use the Investigator contact information in this document to communicate with the data provider. Alternatively, the LBA website [http://lba.inpa.gov.br/lba/] in Brazil will have current contact information.
Data users should use the Data Set Citation and other applicable references provided in this document to acknowledge use of the data.
Table of Contents:
- 1 Data Set Overview
- 2 Data Characteristics
- 3 Applications and Derivation
- 4 Quality Assessment
- 5 Acquisition Materials and Methods
- 6 Data Access
- 7 References
1. Data Set Overview:
Project: LBA (Large-Scale Biosphere-Atmosphere Experiment in the Amazon)
Activity: LBA-ECO
LBA Science Component: Nutrient Dynamics
Team ID: ND-03 (Deegan / Victoria / Krusche / Ballester)
The investigators were Deegan, Linda A.; Ballester, Maria Victoria Ramos; Krusche, Alex V.; Victoria, Reynaldo Luiz; Barthold, Frauke; Bolson, Marcos Alexandre; Bonelle, Nilton; Bonilla, Adriana Lucia Castellanos; Charbel, Luiz Fernando; Chaves, Joaquin Ernesto; Elsenbeer, Helmut; Guandique, Manuel Enrique Gamero; Germer, Sonja; Gessner, Alaide Aparecida Fonseca; Neto, Sergio Candido Gouveia; Grimm, Rosina; Haupert, Christie Lynn; Huamani, Juan Carlos; Johnson, Mark Stephen; Lampert, Samantha Morris; Leite, Nei Kavaguichi; Martinelli, Luiz Antonio; Menuzzo, Rodrigo; Moraes, Jorge Marcos de; Neill, Christopher; Oliveira, Ana Christina Belarmino de; Ometto, Jean Pierre H.B.; Silva, Ariveltom Cosme; Silva, Jonismar Souza; Sonoda, Kathia; Thomas, Suzanne M.; Victoria, Daniel de Castro and Werther, Lisa. You may contact Neill, Christopher (cneill@mbl.edu).
This data set consists of water chemistry data from streams, wells, rainwater, and canopy throughfall samples. The field measurements were carried out at Rancho Grande in the Brazilian state of Rondonia, in the southwestern Brazilian Amazon basin, at two adjacent watersheds, a forest (1.37 ha), and pasture (0.73 ha). Samples were collected during one entire rainy season starting in August 2004 and ending in April 2005.
2. Data Characteristics:
Data are presented in one comma-separated ASCII file: Rancho_Gde_RO_flowpath_chemistry.csv
| Column | Heading | Units/format | Description | |
|---|---|---|---|---|
| 1 | Event_nr | Sequential number ID for precipitation events during the 2004-05 rainy season. This ID link samples collected during a precipitation event to that event. Event 2001 is the first event, 2002 the second and so on. NULL for non-event samples | ||
| 2 | Watershed_type | Sample watershed, i.e.: F, Forest or P, Pasture | ||
| 3 | Sample_type | Type of sample: BF=Baseflow, CF= streamflow, GW=groundwater, L=soil solution, OF=overland flow, R=precipitation, RSS=rainfall Sequential Sampler, TF=throughfall, TFSS=throughfall sequential sampler, VF=venturi flow | ||
| 4 | Sample_num | Sample number. Identifies sequential number for CF samples, collector/well number for OF, L, GW, and TF samples. NULL for R samples | ||
| 5 | Lys_depth | cm | Depth of Lysimeter (cm) from which samples was collected, 20 or 100 | |
| 6 | Discharge | L/s | Discharge in L/s at the time CF samples was collected. Calculated from stage height at a 30.5 cm H-flume at the outlet of each watershed logged every 5 minutes with a TruTrack 50 cm datalogger. | |
| 7 | TF_collected | liters | TF (liters) measured at 20 collectors (1-20), installed on support 1 m above ground, made out of 150 mm diameter PVC pipe, which were connected via flexible tubes to 20 L plastic canisters from which sample for hydrochemistry was also collected. The total collecting area per collector was 980 cm2 (70 cm * 140 cm).To avoid splash losses an orifice with a width (70 mm) smaller than the diameter was cut out of the PVC pipes. Throughfall quantities per event were measured manually with 20 collectors. Two hours after every event or alternatively the next morning for events which ended after 09:00 PM, we emptied the collectors and quantified the throughfall with graduated cylinders of three different sizes. For events with less or equal to 5 mm, between 5 and 15 mm and events bigger or equal to 15 mm graduated cylinders of 100 ml, 500 ml and 1000 ml were used, respectively. NULL for non TF samples | |
| 8 | Precip_tot | mm | Total precipitation during rain event a sample was collected. NULL for non event samples | |
| 9 | Sample_date | yyyymmdd | Date of sample collection in yyyymmdd format | |
| 10 | Time | hh:mm | Time of day of sample collection: 00:00 to 23:59 | |
| 11 | Time_stamp | yyyy-mm-dd hh:mm:ss | Time stamp for logger derived data (e.g. discharge) YYYY-MM-DD HH:MM:SS. For non logger data YYYY-MM-DD 00:00:00 | |
| 12 | ph | ph | pH (+/- 0.01) measured in the field with an ORION 250A+ pH/conductivity meter | |
| 13 | Conductivity | uS/cm | Conductivity (uS/cm +/- 0.1) measured in the field with an ORION 250A+ pH/conductivity meter | |
| 14 | Alk_tot | mg/liter | Total alkalinity, mg/L titrated to pH 4.2 with H2SO4 using a HACH titration kit | |
| 15 | DOC | umoles/liter | Dissolved organic carbon, umoles/L analyzed on a Shimadzu TOC 5000A carbon analyzer | |
| 16 | DIC | umoles/liter | Dissolved inorganic carbon, umoles/L, analyzed at the field laboratory on a Li-Cor infrared gas analyzer | |
| 17 | Cl | umoles/liter | Concentration of Cl-, umoles/L determined by ion chromatography (Dionex DX-500) at the Centro de Energia Nuclear na Agricultura-USP, in Piracicaba, SP | |
| 18 | NO2 | umoles/liter | Concentration of NO2-, umoles/L determined by ion chromatography (Dionex DX-500) at the Centro de Energia Nuclear na Agricultura-USP, in Piracicaba, SP | |
| 19 | SO42 | umoles/liter | Concentration of SO4-2, umoles/L determined by ion chromatography (Dionex DX-500) at the Centro de Energia Nuclear na Agricultura-USP, in Piracicaba, SP | |
| 20 | NO3 | umoles/liter | Concentration of NO3-, umoles/L determined by ion chromatography (Dionex DX-500) at the Centro de Energia Nuclear na Agricultura-USP, in Piracicaba, SP | |
| 21 | PO42 | umoles/liter | Concentration of PO4-3, umoles/L determined by ion chromatography (Dionex DX-500) at the Centro de Energia Nuclear na Agricultura-USP, in Piracicaba, SP | |
| 22 | Na | umoles/liter | Concentration of Na+, umoles/L determined by ion chromatography (Dionex DX-500) at the Centro de Energia Nuclear na Agricultura-USP, in Piracicaba, SP | |
| 23 | NH4 | umoles/liter | Concentration of NH4+, umoles/L determined by ion chromatography (Dionex DX-500) at the Centro de Energia Nuclear na Agricultura-USP, in Piracicaba, SP | |
| 24 | K | umoles/liter | Concentration of K+, umoles/L determined by ion chromatography (Dionex DX-500) at the Centro de Energia Nuclear na Agricultura-USP, in Piracicaba, SP | |
| 25 | Mg | umoles/liter | Concentration of Mg+2, umoles/L determined by ion chromatography (Dionex DX-500) at the Centro de Energia Nuclear na Agricultura-USP, in Piracicaba, SP | |
| 26 | Ca | umoles/liter | Concentration of K+2, umoles/L determined by ion chromatography (Dionex DX-500) at the Centro de Energia Nuclear na Agricultura-USP, in Piracicaba, SP | |
| 27 | Si | umoles/liter | Concentration of Si(OH)4, umoles/L determined colorimetrically by the silicomolybdate reduction with ascorbic acid to molybdenum blue method at the Centro de Energia Nuclear na Agricultura-USP, in Piracicaba, SP | |
| 28 | CO2 | umoles/liter | Concentration of CO2, umoles/L, analyzed at the field laboratory on a Li-Cor infrared gas analyzer | |
| 29 | HC03 | umoles/liter | Concentration of HCO3-, umoles/L, analyzed at the field laboratory on a Li-Cor infrared gas analyzer | |
| 30 | CO32 | umoles/liter | Concentration of CO32-, umoles/L, analyzed at the field laboratory on a Li-Cor infrared gas analyzer | |
| Missing values are represented as -9999 | ||||
| Values designated as NULL have a specific meaning as defined in individual variable descriptions (see above) | ||||
Site boundaries: (All latitude and longitude given in decimal degrees)
| Site (Region) | Westernmost Longitude | Easternmost Longitude | Northernmost Latitude | Southernmost Latitude | Geodetic Datum |
|---|---|---|---|---|---|
| Rondonia - Rancho Grande (Rondonia) | -62.88111 | - 62.85833 | -10.28861 | - 10.32306 | World Geodetic System, 1984 (WGS-84) |
Time period:
- The data set covers the period 2004/08/22 to 2005/03/08
- Temporal Resolution: 5-minute, rain event and weekly
Platform/Sensor/Parameters measured include:
- FIELD INVESTIGATION / ANALYSIS / SURFACE WATER CHEMISTRY
- FIELD INVESTIGATION / RAIN GUAGE / PRECIPITATION AMOUNT
- FIELD INVESTIGATION / STREAM GUAGE / DISCHARGE/FLOW
- LABORATORY / ION CHROMATOGRAPH / GROUNDWATER CHEMISTRY
- LABORATORY / ION CHROMATOGRAPH / WATER ION CONCENTRATION
3. Data Application and Derivation:
Typical Application of Data:
Assessment of material fluxes from/to atmosphere, canopy, soil and groundwater to/from
streams and watersheds of the elements and chemical species investigated.
4. Quality Assessment:
Error Sources: Possible sample contamination during collection, manipulation
and/or analysis. Suspect samples were removed from dataset.
Known Problems with the Data: None
Quality Assessment Activities: Not available
5. Data Acquisition Materials and Methods:
Site description
Field measurements were carried out at Rancho Grande in the Brazilian state of Rondonia, in the southwestern Brazilian Amazon basin, at two adjacent watersheds, a forest (1.37 ha), and pasture (0.73 ha). Both watersheds were instrumented for hydrological and hydrochemical measurements beginning in August 2004.
Mean annual precipitation, based on daily rain totals collected since 1984 by the landowners, is 2,330 mm with a pronounced dry season of <100 mm month-1 from
June through August.
The forest watershed contains open moist tropical forest with a high density of palms typical of the region. The pasture was cleared in 1985,
planted to pasture in 1986 and has had continuous cover of the African forage grass Brachiaria humidicola since that time. It has been actively
grazed at about 1 animal ha-1. Both watersheds are drained by channels that convey water in response to some storm events regardless of season,
and intermittently towards the end of the rainy season in some years.
Sampling methods
Precipitation:
A tipping bucket rain gauge (Hydrological Services P/L, Liverpool Australia) and a Campbell logger installed in the pasture recorded rainfall intensity. Incident rainfall volumes and rainfall samples for chemical analyses were collected after each precipitation event into a 20 L acid washed polyethylene container using a trough-type collector installed 1 m above ground. Canopy throughfall was collected after each event at 20 similar trough collectors distributed throughout the catchment.

Figure 3: Sequential sampler design: Composite of two through collectors, a tipping bucket and 10 sampling bottles. The detail image in the lower right image corner shows individual sampling bottles and the connection tubing.
Overland flow samplers were placed at one location in each watershed during the first four months of sampling and at three additional locations in the subsequent months of sampling.
Groundwater was sampled weekly from three wells at each watershed. Wells were 5 m apart and 10 m from the outlet of each watershed and ranged 4-6 m in depth.
Samples of soil solution from the vadose zone were taken every ten days from tension lysimeters installed at two depths at ten locations in each watershed. The lysimeters were installed above and below the texture break at the top of the B horizon (20, 100cm).
TF (liters) measured at 20 collectors (1-20), installed on support 1 m above ground, made out of 150 mm diameter PVC pipe, which were connected via flexible tubes to 20 L plastic canisters from which sample for hydrochemistry was also collected. The total collecting area per collector was 980 cm2 (70 cm * 140 cm).To avoid splash losses an orifice with a width (70 mm) smaller than the diameter was cut out of the PVC pipes. Throughfall quantities per event were measured manually with 20 collectors. Two hours after every event or alternatively the next morning for events which ended after 09:00 PM, we emptied the collectors and quantified the throughfall with graduated cylinders of three different sizes. For events with less or equal to 5 mm, between 5 and 15 mm and events greater than or equal to 15 mm graduated cylinders of 100 ml, 500 ml and 1000 ml were used, respectively.
Groundwater was sampled weekly from three wells at each watershed. Wells were 5 m apart and 10 m from the outlet of each watershed and ranged 4-6 m in depth.
Stream flow was collected from a 30.5 cm H-flume installed at the outlet of each watershed using ISCO samplers. Samples were collected every five minutes during the first 80 min of flow and every 20 min for the following 160 min. Stage height was recorded every 5 min with TruTrack loggers installed on each flume.
All field measurements and sampling were conducted between late August 2004 and late April 2005, excluding December 2004 due to personnel and logistical limitations, and encompassed an entire rainy season. The logging equipment recorded precipitation intensity and stage heights continually for the duration of the study.
Sample analyses
After collection, all samples were transported to a field laboratory located 500 m from the research watersheds and filtered through Whatman GF/F filters (0.7 um pore size). Samples were preserved with thymol and stored frozen in 60 mL acid-washed polyethylene bottles.
Concentrations of cations and anions (Na+, K+, Ca2+, Mg2+, NH4+, NO3-, NO2-, Cl-, and SO42-) were determined by ion chromatography (Dionex DX-500) and silicates (SiOH4) colorimetrically at the Centro de Energia Nuclear na Agricultura, at the University of Sao Paulo, in Piracicaba, SP. Dissolved inorganic carbon (DIC) species were determined at the field laboratory with a LICOR infrared gas analyzer. Alkalinity was determined by titration to a fixed pH (4.2).
Conductivity and pH were measured in the field with an Orion pH/conductivity meter. DOC was analyzed on a Shimadzu TOC analyzer.
Streamflow source analysis
Using an end member mixing analysis approach, we evaluated potential contributing sources of stream flow during that rainy season in the forest and a pasture watersheds
(Germer et al., 2006; Chaves et al., 2007). Water yield was 17% of precipitation in the pasture and 0.8% of precipitation in the forest. During the early rainy season, throughfall, groundwater, and soil water contributed 79%, 18%, and 3%, respectively, to total forest stream flow. Over the entire rainy season, throughfall, groundwater, and shallow soil water provided 57%, 24%, and 19%, respectively, of stream flow. In the pasture watershed, overland flow dominated stream flow both in the early (67%) and late (57%) rainy season, with a mean contribution of 60% overland flow, 45% groundwater, and 5% soil water. High concentrations of NO3- in forest soil solution relative to low NO3-concentrations in forest groundwater indicated a large removal of NO3- in flowpaths leading from soil to groundwater.
6. Data Access:
This data is available through the Oak Ridge National Laboratory (ORNL) Distributed Active Archive Center (DAAC).
Data Archive Center:
Contact for Data Center Access Information:
E-mail: uso@daac.ornl.gov
Telephone: +1 (865) 241-3952
7. References:
none cited
Related Publications
- Germer, S., H. Elsenbeer, and J.M. Moraes. 2006. Throughfall and temporal trends of rainfall redistribution in an open tropical rainforest, south-western Amazonia (Rondonia, Brazil). Hydrology and Earth System Sciences 10(3):383-393.
- Chaves, J.E., C. Neill, S. Germer, S. Neto, A.V. Krusche, and H. Elsenbeer. 2007. Land management impacts on runoff sources in small Amazon watersheds. Hydrological Processes.
- Neto, Sergio Candido de Gouveia. 2006. Concentracoes e balancos de Carbono organico dissolvido em duas bacias do estado de Rondonia: uma comparacao entre floresta e pastagem. M.S. Thesis. University of Sao Paulo, Brazil. 55p.
- Neill, C., L.A. Deegan, S.M. Thomas, C.L. Haupert, A.V. Krusche, V.M. Ballester, and R.L. Victoria. 2006. Deforestation alters the hydraulic and biogeochemical characteristics of small lowland Amazonian streams. Hydrological Processes 20(12):2563-2580.