Get Data
Summary:
This data set provides measurements of specific leaf area and monthly phenological observations for selected tree and vine species at the km 67 Seca Floresta site, Tapajos National Forest, Para, Brazil. The study site was part of a rainfall exclusion experiment that was conducted from 1999-2006 to develop an understanding of the physical processes driving the observed soil water dynamics at the site.
Phenological observations were made from 2001-2004 in rainfall exclusion and control plots. In total, 3,224 leaves were observed across 223 individuals and 56 species. The phenological observations included the month and year when a given leaf was first observed fully expanded and last observed alive.
Starting in July 2004 and continuing through January 2006, leaves that had been followed in the phenology study were sampled and leaf area and mass were determined and the specific leaf area was calculated.
There are two comma-delimited data files with this data set.
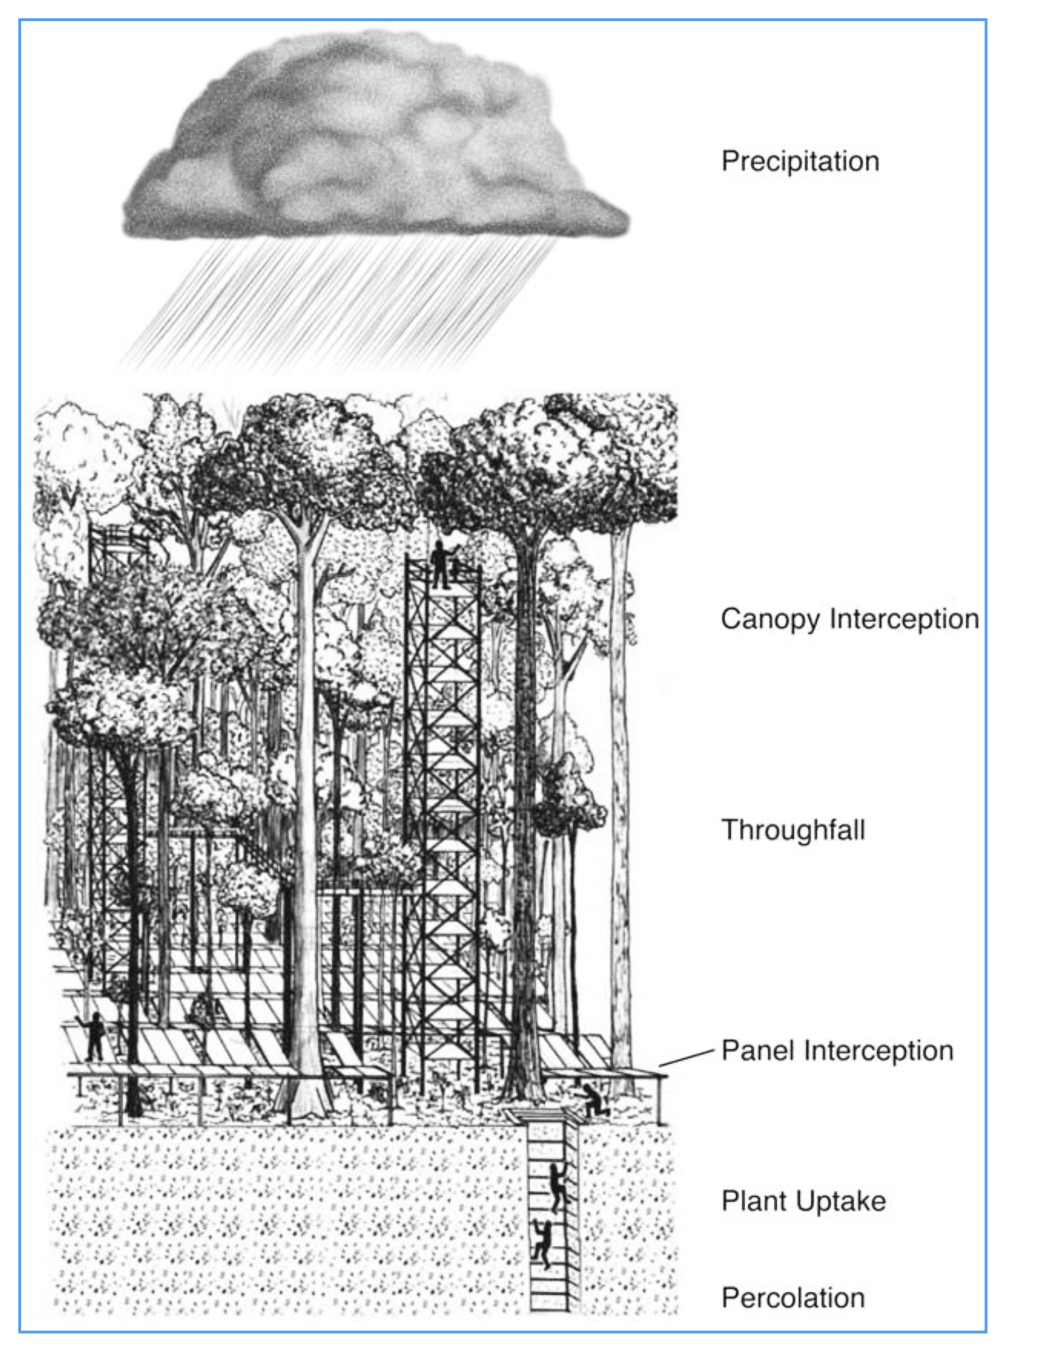
Figure 1. Idealized model structure for water cycling in a deep Oxisol. Drawn by Kemel Bittencourt Kalif. From Belk et al. 2007.
Data Citation:
Cite this data set as follows:
Nepstad, D.C., P. Moutinho, D. Ray and P. Brando. 2014. LBA-ECO LC-14 Specific Leaf Area and Phenology, km 67 Site, Para, Brazil: 2001-2006. Data set. Available on-line (http://daac.ornl.gov) from ORNL DAAC, Oak Ridge, Tennessee, USA. http://dx.doi.org/10.3334/ORNLDAAC/1211
Implementation of the LBA Data and Publication Policy by Data Users:
The LBA Data and Publication Policy [http://daac.ornl.gov/LBA/lba_data_policy.html] is in effect for a period of five (5) years from the date of archiving and should be followed by data users who have obtained LBA data sets from the ORNL DAAC. Users who download LBA data in the five years after data have been archived must contact the investigators who collected the data, per provisions 6 and 7 in the Policy.
This data set was archived in April 2014. Users who download the data between April 2014 and May 2019 must comply with the LBA Data and Publication Policy.
Data users should use the Investigator contact information in this document to communicate with the data provider.
Data users should use the Data Set Citation and other applicable references provided in this document to acknowledge use of the data.
Table of Contents:
- 1 Data Set Overview
- 2 Data Description
- 3 Applications and Derivation
- 4 Quality Assessment
- 5 Acquisition Materials and Methods
- 6 Data Access
- 7 References
Project: LBA (Large-Scale Biosphere-Atmosphere Experiment in the Amazon)
Activity: LBA-ECO
LBA Science Component: Land Use and Land Cover
Team ID: LC-14 (Nepstad / Moutinho)
The investigators were Moutinho, Paulo; Nepstad, Daniel; Alencar, Ane; Andrade, Sergio Viana de; Arce, Javier Alberto; Asner, Gregory Paul; Azevedo-Ramos, Claudia de Barros e; Belk, Elizabeth Leslie; Brando, Paulo Monteiro; Breyer, Lace Medeiros; Cardinot, Gina Knust; Carvalho, Georgia ; Carvalho Jr, Oswaldo de; Costa, Luciana Miranda; Dias-Filho, Moacyr Bernardino; Figueiredo, Ricardo ; Goncalves Junior, Felipe Resque; Guerrero, Jose Benito; Holbrook, Noel Michele; Kaufmann, Robert K.; Kingerlee, Wendy ; Klink, Carlos Augusto; Lameira, Wanja Janayna Miranda; Lefebvre, Paul A.; Maklouf, Eduardo Jorge; Markewitz, Daniel ; Meigs, Garrett Wister; Miranda, Heloisa S.; Molina, Marirosa ; Monaco, Luciana Magalhaes; Oliveira, Rafael Silva; Peters, Charles Merideth; Pinto, Flavia dos Santos; Pupim, Ana Claudia; Ray, David Graham; Reis, Eustaquio J; Schlesinger, Peter ; Schwalbe, Karen R.; Silva, Dulce Alves da; Silva, Wanderley ; Solorzano Cardenas, Luis Anibal; Sternberg, Leonel ; Steward, Corrina Dawn and Zepp, Richard G. You may contact Brando, Dr. Paulo (paulobrando@gmail.com).
LBA Data Set Inventory ID: LC14_REE_SLA
This data set provides measurements of specific leaf area and monthly phenological observations for selected tree and vine species at the km 67 Seca Floresta site, Tapajos National Forest, Para, Brazil. The study site was part of a rainfall exclusion experiment that was conducted from 1999-2006 to develop an understanding of the physical processes driving the observed soil water dynamics at the site.
Phenological observations were made from 2001-2004 in rainfall exclusion and control plots. In total, 3,224 leaves were observed across 223 individuals and 56 species. The phenological observations included the month and year when a given leaf was first observed fully expanded and last observed alive.
Starting in July 2004 and continuing through January 2006, leaves that had been followed in the phenology study were sampled and leaf area and mass were determined and the specific leaf area was calculated.
Related Data Sets (Studies performed at the same site)
- LBA-ECO ND-02 SOIL GAS AND WATER CONTENT, RAINFALL EXCLUSION, TAPAJOS NATIONAL FOREST
- LBA-ECO TG-09 SOIL ISOTOPIC C, N, H2O, AND N2O DATA, TAPAJOS NATIONAL FOREST, BRAZIL
- LBA-ECO ND-02 SOIL GAS FLUX, RAINFALL EXCLUSION, KM 67, TAPAJOS NATIONAL FOREST
- LBA-ECO LC-14 BIOPHYSICAL MEASUREMENTS, RAINFALL EXCLUSION, TAPAJOS NATIONAL FOREST
2. Data Characteristics:
Data are available in two comma-delimited files:
File #1: REE_Leaf_phenology_2001_2004.csv
File #2: REE_SLA_measurements_2004_2006.csv
File #1: REE_Leaf_phenology_2001_2004.csv
The data in this file includes the first sampling date on which the leaf was fully expanded and included in the analysis (20010103-20040309), and the final sampling dates on which a leaf was marked as live (the last date recorded was 20040507).
| Column | Column Heading | Units/format | Description |
|---|---|---|---|
| 1 | Treatment | Experimental treatment plot: Control or Exclusion | |
| 2 | Location | Location where sample was collected referring to plot structures (ie understory, aerial walkways and towers) | |
| 3 | Local_name | Local name in Portuguese | |
| 4 | Tree_ID | Tree identification specific to this phenology study | |
| 5 | Scientific_name | Species identification as Genus species where possible: in some cases only genus is given and some vines were not identified | |
| 6 | Family | Scientific family where identified | |
| 7 | Branch_ID | Branch identification in an alphanumeric code | |
| 8 | Leaf_ID | Leaf identification within each branch | |
| 9 | First_date | YYYYMMDD | First sampling date on which the leaf was fully expanded and included in the analysis (YYYYMMDD) |
| 10 | Final_date_live | YYYYMMDD | Final sampling date on which the leaf was marked as live (YYYYMMDD) |
| 11 | Lifespan_1 | months | Leaf lifespan calculated as the time from first date to final date reported live in units of months which are uniformly 28 days long |
| 12 | Lifespan_2 | months | Leaf lifespan calculated as the time from
first date to date leaf was noted as dead reported in units of months which are
uniformly 28 days long. User note: The “date leaf was noted as dead” was not provided. Distinction between Lifespan_1 and Lifespan_2 was not described. |
| missing data are indicated with -9999 | |||
Sample data from File #1:
|
Treatment,Location,Local_name,Tree_ID,Scientific_name,Family,Branch_ID,Leaf_ID,First_date, Final_date_live,Lifespan_1,Lifespan_2 Exclusion,Understory,Caferana folha miuda,1,Coussarea micrococca Bremekamp.,Rubiaceae,A,11,20010207,20021204,21.8,22.3 Exclusion,Understory,Caferana folha miuda,1,Coussarea micrococca Bremekamp.,Rubiaceae,A2,5,20040107,20040504,3.87,4.36 Exclusion,Understory,Caferana folha miuda,1,Coussarea micrococca Bremekamp.,Rubiaceae,A2,6,20040107,20040504,3.87,4.36 ... Control,Understory,Caferana folha grande,1,Coussarea macrophylla M. Arg.,Rubiaceae,E,8,20010209,20030613,28,-9999 Control,Understory,Caferana folha grande,1,Coussarea macrophylla M. Arg.,Rubiaceae,E,10,20021114,20031112,11.9,12.39 Control,Understory,Caferana folha grande,1,Coussarea macrophylla M. Arg.,Rubiaceae,E,11,20030613,20031008,3.84,4.33 ... Control,Walkway,Breu,9,Thrysodium paraensis,Burseraceae,D3,3,20020812,20031008,13.84,14.33 Control,Walkway,Breu,9,Thrysodium paraensis,Burseraceae,D3,4,20020812,20030905,12.75,-9999 Control,Walkway,Breu,9,Thrysodium paraensis,Burseraceae,E,8,20010809,20020812,12.07,12.56 |
File #2: REE_SLA_measurements_2004_2006.csv
Leaf sampling dates from the exclusion plots was from 20040921 - 20060126, and sampling dates from the control plots were from 20040911 - 20050321.
| Column | Column Heading | Units/format | Description |
|---|---|---|---|
| 1 | Treatment | Experimental treatment plot: Control or Exclusion | |
| 2 | Scientific_name | Species identification as Genus species where possible: in some cases only genus is given and some vines were not identified | |
| 3 | Location | Location where sample was collected referring to plot structures (ie understory, aerial walkways and towers) | |
| 4 | Common_name | Local name in Portuguese | |
| 5 | Phenology_ID | Tree identification in the phenology study | |
| 6 | Inventory_ID | Tree identification in the original REE plot inventory study | |
| 7 | Date | YYYYMMDD | Sampling date (YYYYMMDD) |
| 8 | Max_axis | cm | Length of leaf maximum axis reported in centimeters (cm) |
| 9 | Min_axis | cm | Length of leaf minimum axis reported in centimeters (cm) |
| 10 | Branch_ID | Branch identification Alphanumeric code | |
| 11 | Leaf_ID | Leaf identification within each branch | |
| 12 | Height | m | Height at which leaf was sampled in meters (m) above the ground |
| 13 | Punch_ID | Identification of punch used to extract leaf disks ( 1 through 9) | |
| 14 | N_disks | Number of leaf disks collected | |
| 15 | Disk_diameter | mm | Diameter of leaf disks reported in millimeters (mm) |
| 16 | Disk_area | cm2 | Total disk area calculated from the disk diameter and the number of disks collected and reported in centimeters squared (cm2) |
| 17 | Disk_weight | g | Total disk dry weight reported in grams (g). Weight reported is the total weight of all disks collected |
| 18 | SLA | m2/kg | Specific leaf area reported in meters squared of leaf surface per kilogram of leaf dry weight (m2/kg) |
| 19 | Leaf_area | cm2 | Leaf area calculated as maximum axis multiplied by the minimum axis and reported in centimeters squared (cm2) |
| 20 | Notes | Field observations | |
| Missing data are indicated by -9999 | |||
Sample data from File #2:
|
Treatment,Scientific_name,Location,Common_name,Phenology_ID,Inventory_ID,Date,Max_axis, Min_axis,Branch_ID,Leaf_ID,Height,Punch_ID,N_disks,Disk_diameter ,Disk_area,Disk_weight,SLA,Leaf_area,Notes Control,Pouteria cuspidata,Tower4,Abiurana,3,7269,20041018,11,6,A,5,3,6,15, 9.05,9.64,0.072,13.39,66,no comment Control,Pouteria cuspidata,Tower4,Abiurana,3,7269,20041018,12,5,A,2,3,6,15, 9.05,9.64,0.078,12.36,60,no comment Control,Pouteria cuspidata,Tower4,Abiurana,3,7269,20041018,12,5,A,3,3,6,15, 9.05,9.64,0.075,12.86,60,no comment ... Control,Virola elorgata,Tower1,Ucuuba,3,487,20041004,19,5.1,E3,0,5.7,8,10,11.45,10.29,0.075,13.72,96.9,no comment Exclusion,Thyrsodium paraense,Tower1,Amaparana,12,302,20040921,27.5,7.6,A2,3,5,7,15,10.03,11.85,0.079,14.99,209,no comment Exclusion,Thyrsodium paraense,Tower1,Amaparana,12,302,20040921,32.6,9.3,A2,4,5,7,15,10.03,11.85,0.088,13.46,303.18,no comment ... Exclusion,Brosimum lactescens,Tower4,Uxirana,4,256,20060126,8.4,2.9,E2,11,13,2,30,5.02,5.93,0.031,19.14,24.36,no comment Exclusion,Brosimum lactescens,Tower4,Uxirana,4,256,20060126,9,2.8,E2,10,13,2,30,5.02,5.93,0.045,13.19,25.2,no comment Exclusion,Brosimum lactescens,Tower4,Uxirana,4,256,20060126,-9999,-9999,suB,-9999,10,3,30,6.06,8.65,0.074,11.69,-9999,no comment |
Site boundaries: (All latitude and longitude given in decimal degrees)
| Site (Region) | Westernmost Longitude | Easternmost Longitude | Northernmost Latitude | Southernmost Latitude | Geodetic Datum |
|---|---|---|---|---|---|
| Para Western (Santarem) - km 67 Seca-Floresta Site (Para Western (Santarem)) | -55.00000 | -55.00000 | -2.7500 | -2.7500 | World Geodetic System, 1984 (WGS-84) |
Time period: The data set covers the period 2001/01/03 to 2006/01/26.
- Temporal Resolution: monthly
Platform/Sensor/Parameters measured include:
- FIELD SURVEY / WEIGHING BALANCE / LEAF CHARACTERISTICS
- FIELD SURVEY / HUMAN OBSERVER / PHENOLOGY
3. Data Application and Derivation:
Data can be used to determine average leaf lifespan by species and canopy position as well as seasonality in leaf expansion and senescence.
4. Quality Assessment:
Data have been reviewed for quality.
5. Data Acquisition Materials and Methods:
Site description:
The research was located in the Tapajos National Forest, in east-central Amazonia. This forest receives between 600 and 3,000 mm of rain each year, with a mean of 2,000 mm; severe drought is experienced during El Nino events. The forest is situated on a flat terrace of Tertiary sediments capped by the Belterra Clay Formation (Clapperton, 1993), and is approximately 90 m above the water level of the Tapajos River, located 10 km to the west. The Oxisol soil (Haplustox) is dominated by kaolinite clay minerals and is free of hardpan or iron oxide concretions in the upper 12 m.
Drought effects on forest processes were studied by comparing a 1-ha forest plot from which a portion of throughfall was excluded with a nearby 1-ha control plot. Two floristically and structurally similar, 1-ha (100 by 100-m) plots were selected for the experiment from an initial survey of 20 ha of forest (Nepstad et al., 2002). The forest surrounding the plots had emergent trees up to 55 m in height, with continuous canopy varying in height from 18 to 40 m. The study plots were placed in areas where most of the canopy was less than 30-m high to facilitate access to the tree crowns.
A one to 1.7-m deep trench was excavated around the treatment plot to reduce the potential for lateral movement of soil water from the surrounding forest into the plot, and to provide a conduit for water excluded from the plot. A similar trench was excavated around the control plot to avoid the confounding of throughfall exclusion and trenching effects. Following an intercalibration period of approximately one-year starting in November of 1998, throughfall was partially excluded during the rainy seasons of 2000 through 2006 using plastic panels and wooden gutters installed in the understory.
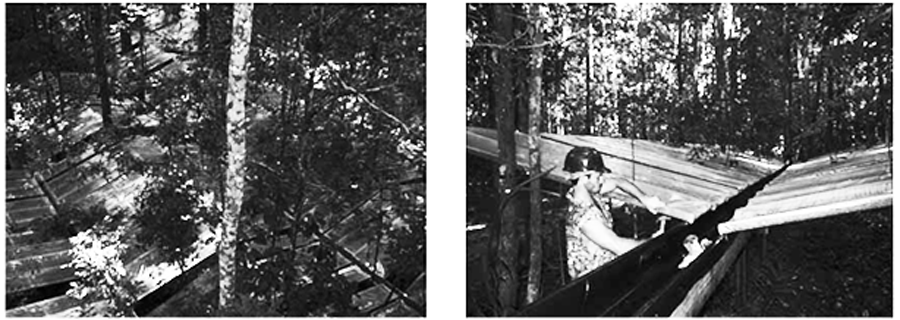
Figure 2. Throughfall exclusion panels, Tapajos National Forest. The throughfall exclusion panels drain into wooden gutters constructed in the forest understory. Photos from Nepstad et al., 2002.
Phenology
At the beginning of January 2001, one year after the first rainfall exclusion period, branches were selected for observation in individual trees and vines in the canopy and subcanopy. The towers and aerial walkways provided access for the tagging of five branches that were representative of different parts of the crown of each sampled individual. In addition to tagging the branch, each leaf selected was marked with a black marker. The goal was to capture different environments within each the crown of each individual. Leaf longevity was assessed through monthly visits to the sampled branches, observing the presence of new fully expanded leaves and/or leaves that had fallen. If a branch died, another was selected to keep the sample at five branches per tree. The phenological observations ended in 2004.
Specific Leaf Area
Starting in July 2004 through January 2006, leaves were removed that had been followed in the phenology study. The major and minor axes of each leaf were measured and several disks of known area were punched from the leaf tissue and dried to a constant weight at 60 degrees C. All the disks from an individual leaf were weighed together and then SLA was calculated from their combined surface area and weight. All sampled leaves were alive when collected.
6. Data Access:
This data is available through the Oak Ridge National Laboratory (ORNL) Distributed Active Archive Center (DAAC).
Data Archive Center:
Contact for Data Center Access Information:
E-mail: uso@daac.ornl.gov
Telephone: +1 (865) 241-3952
7. References:
Belk, Elizabeth L., Daniel Markewitz, Todd C. Rasmussen, Eduardo J. Maklouf Carvalho, Daniel C. Nepstad, and Eric A. Davidson. 2007. Modeling the effects of throughfall reduction on soil water content in a Brazilian Oxisol under a moist tropical forest. Water Resources Research, Vol. 43, W08432, doi:10.1029/2006WR005493.
Clapperton, C., Quaternary Geology of South America, Elsevier Sci., New York, 1993.
Nepstad, D.C., P. Moutinho, M.B. Dias, E. Davidson, G. Cardinot, D. Markewitz, R. Figueiredo, N. Vianna, J. Chambers, D. Ray, J.B. Guerreiros, P. Lefebvre, L. Sternberg, M. Moreira, L. Barros, F.Y. Ishida, I. Tohlver, E. Belk, K. Kalif, and K. Schwalbe. 2002. The effects of partial throughfall exclusion on canopy processes, aboveground production, and biogeochemistry of an Amazon forest. Journal of Geophysical Research-Atmospheres 107(D20).