Get Data
Summary:
This data set provides estimates of daily and monthly carbon dioxide (CO2) and methane (CH4) diffusive and ebullitive flux for dry and flooded areas from two study sites, Cuini and Itu, in the interfluvial wetlands of the upper Negro River basin, Brazil.
CO2 (ebullitive and diffusive) and CH4 diffusive flux measurements were made one day each month from February 2005 through January 2006 in both permanently and seasonally flooded areas. For the remaining days of each month, fluxes were calculated as the mean of the two measurements bracketing that time period, times the area flooded each day.
Total site area, dry area, and seasonally varying flooded area estimates for the two wetlands were determined through analysis of synthetic aperture radar data from Radarsat images. From these estimates, the total flux of CO2 and CH4 for the sites was calculated. Values for CH4 ebullitive flux were determined from a constant for each area based on whether the water was rising or falling and the area flooded.
Hydrologic measurements were taken from April 2004 through January, 2006.
There are three comma-separated (.csv) data files with this data set.
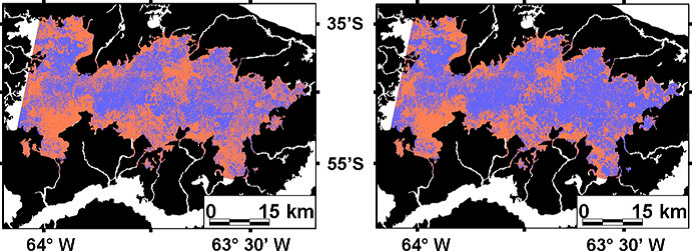
Figure 1. Inundation of Cuini wetland at low water (left) and high water (right). Black indicates uplands, and white denotes flooded area outside of Cuini wetland. Blue (darker central regions) indicates flooded habitats and orange (brighter) indicates unflooded habitats or regions where vegetation did not permit detection of inundation (Belger et al., 2011).
Data Citation:
Cite this data set as follows:
Belger, L., B.R. Forsberg and. J.M. Melack. 2014. LBA-ECO LC-07 CO2 and CH4 Flux from Wetlands, Negro River Basin, Brazil: 2004-2006. Data set. Available on-line [http://daac.ornl.gov] from Oak Ridge National Laboratory Distributed Active Archive Center, Oak Ridge, Tennessee, USA. http://dx.doi.org/10.3334/ORNLDAAC/1209
Implementation of the LBA Data and Publication Policy by Data Users:
The LBA Data and Publication Policy [http://daac.ornl.gov/LBA/lba_data_policy.html] is in effect for a period of five (5) years from the date of archiving and should be followed by data users who have obtained LBA data sets from the ORNL DAAC. Users who download LBA data in the five years after data have been archived must contact the investigators who collected the data, per provisions 6 and 7 in the Policy.
This data set was archived in March 2014. Users who download the data between March 2014 and February 2019 must comply with the LBA Data and Publication Policy.
Data users should use the Investigator contact information in this document to communicate with the data provider. Alternatively, the LBA Web Site [http://lba.inpa.gov.br/lba/] in Brazil will have current contact information.
Data users should use the Data Set Citation and other applicable references provided in this document to acknowledge use of the data.
Table of Contents:
- 1 Data Set Overview
- 2 Data Description
- 3 Applications and Derivation
- 4 Quality Assessment
- 5 Acquisition Materials and Methods
- 6 Data Access
- 7 References
Project: LBA (Large-Scale Biosphere-Atmosphere Experiment in the Amazon)
Activity: LBA-ECO
LBA Science Component: Land Use and Land Cover
Team ID: LC-07 (Melack / Novo / Forsberg)
The investigators were Forsberg, Bruce R; Melack, John M.; Novo, Evlyn; Affonso, Adriana Gomes; Albuquerque, Paulo C Gurgel; Alcantara, Enner Herenio; Alsdorf, Douglas; Arruda, Warey de Costa; Barbosa, Claudio; Belger, Lauren; Carvalho, Joao Carlos; Castellari, Sueli Pissarra; Correa, Denival Silva; Correia, Antonio; Costa, Maycira; da Costa Freitas, Corina; Dutra, Luciano Vieira; Elmiro, Marcos Timbo; Filho, Waterloo Pereira; Franca, Andreia Maria Silva; Freitas, Ramon Morais; Frickmann, Fernando Cruz; Gama, Fabio Furlan; Gastil-Buhl, Mary; Goncalves, Fabio Guimaraes; Hess, Laura Lorraine; Jardim-Lima, Dayson Jose; Kemenes, Alexandre; Kilham, Nina; Kramer, Marc Gerald; Lima, Ivan Bergier Tavares de; Londe, Luciana de Resende; Marshall, Bruce Gavin; Mertes, Leal; Mura, Jose Claudio; Rudorff, Conrado de Moraes; Sant'Anna, Sidnei J.S.; Santos, Claudia Cristina dos; Santos, Joao Roberto dos; Shimabukuro, Yosio Edemir; Silva, Claudio Roberto; Silva, Thiago Sanna Freire; Titoneli, Fernanda and Vasconcelos, Cintia Honorio. You may contact Forsberg, Bruce R (fosberg@vivax.com.br).
LBA Data Set Inventory ID: LC07_Wetlands_fluxes
This data set provides estimates of daily and monthly carbon dioxide (CO2) and methane (CH4) diffusive and ebullitive flux for dry and flooded areas from two study sites, Cuini and Itu, in the interfluvial wetlands of the upper Negro River basin, Brazil.
CO2 (ebullitive and diffusive) and CH4 diffusive flux measurements were made one day each month from February 2005 through January 2006 in both permanently and seasonally flooded areas. For the remaining days of each month, fluxes were calculated as the mean of the two measurements bracketing that time period, times the area flooded each day.
Total site area, dry area, and seasonally varying flooded area estimates for the two wetlands were determined through analysis of synthetic aperture radar data from Radarsat images. From these estimates, the total flux of CO2 and CH4 for the sites was calculated. Values for CH4 ebullitive flux were determined from a constant for each area based on whether the water was rising or falling and the area flooded.
Hydrologic measurements were taken from April 2004 through January, 2006.
2. Data Characteristics:
Data are available in three comma-separated files (.csv):
File #1: LC07_Daily_C_fluxes.csv
File #2: LC07_Monthly_C_fluxes.csv
File #3: LC07_Hydrologic_measurements.csv
File #1: LC07_Daily_C_fluxes.csv. This file contains calculated estimates and measured data from sampling. The sampling dates are provided in Table 1.
| Column | Column Heading | Units/format | Description |
|---|---|---|---|
| 1 | Site | Study area | |
| 2 | Date | YYYYMMDD | Sampling date (YYYYMMDD) (see Table 1) |
| 3 | Dry_area | km2 | Estimated extent of the non-flooded area within the study area reported in kilometers squared |
| 4 | CH4_flux_dry | Mg CH4 d-1 | Diffusive flux of methane from the total dry area surface calculated as the dry area times a set methane uptake rate for each study based on field observation and reported in megagrams of methane per day |
| 5 | Flooded_area | km2 | Estimated extent of the flooded area within the study area reported in kilometers squared |
| 6 | Water_level_status | Water level variation in relation to the previous day | |
| 7 | CH4_ebullitive_flux | mg m-2 d-1 | Ebullitive flux of methane from the flooded area surface. Field measurements of fluxes were found to be strongly influenced by water level status
and so mean values were calculated for rising and falling floodwaters in each site. Cuini site: falling = 105 and rising = 55 mg CH4 m-2 d-1. Itu site: falling = 16 and rising = 3 mg CH4 m-2 d-1. Values are reported in milligrams of methane per meter squared per day |
| 8 | CH4_ebullitive_total | Mg CH4 d-1 | Ebullitive flux of methane from the total flooded area surface calculated as the total flooded area times the mean flux value for each site under rising or falling water conditions and reported in megagrams of methane per day |
| 9 | CH4_diffusive_flux | mg CH4 m -2 d-1 | Diffusive flux of methane from the flooded area surface measured once a month using chambers and funnels. On days between measurements values were calculated as the mean of the measurements that bracket those days. Values are reported in milligrams of methane per meter squared per day |
| 10 | CH4_diffusive_total | Mg CH4 d-1 | Diffusive flux of methane from the total flooded area surface calculated as the flooded area times the diffusive rate measured or calculated for that day and reported in megagrams of methane per day |
| 11 | CO2_diffusive_flux | mg CO2 m -2 d-1 | Diffusive flux of carbon dioxide from the flooded area surface measured once a month using floating chambers and funnels. On days between measurements values were calculated as the mean of the measurements that bracket those days. Values are reported in milligrams of carbon dioxide per meter squared per day |
| 12 | CO2_diffusive_total | Mg CO2 d-1 | Diffusive flux of carbon dioxide from the total flooded area surface calculated as the flooded area times the diffusive rate measured or calculated for that day and reported in megagrams of carbon dioxide per day |
| 13 | CO2_ebullitive_flux | mg CO2 m -2 d-1 | Ebullitive flux of carbon dioxide from the flooded area surface measured once a month using floating chambers and funnels. On days between measurements values were calculated as the mean of the measurements that bracket those days. Values are reported in milligrams of carbon dioxide per meter squared per day |
| 14 | CO2_ebullitive_total | Mg CO2 d-1 | Ebullitive flux of carbon dioxide from the total flooded area surface calculated as the flooded area times the diffusive rate measured or calculated for that day and reported in megagrams of carbon dioxide per day |
Table 1. Gas Sampling Dates
| Site | Sampling Date |
|---|---|
| Cuini | 20050205 |
| Cuini | 20050309 |
| Cuini | 20050407 |
| Cuini | 20050502 |
| Cuini | 20050605 |
| Cuini | 20050705 |
| Cuini | 20050808 |
| Cuini | 20050910 |
| Cuini | 20051005 |
| Cuini | 20051103 |
| Cuini | 20051201 |
| Cuini | 20060113 |
| Itu | 20050210 |
| Itu | 20050306 |
| Itu | 20050410 |
| Itu | 20050505 |
| Itu | 20050601 |
| Itu | 20050709 |
| Itu | 20050802 |
| Itu | 20050907 |
| Itu | 20051007 |
| Itu | 20051107 |
| Itu | 20051204 |
| Itu | 20060110 |
Example data for File #1:
|
Site,Date,Dry_area,CH4_flux_dry,Flooded_area,Water_level_status, CH4_ebullitive_flux,CH4_ebullitive_total,CH4_diffusive_flux ,CH4_diffusive_total, CO2_diffusive_flux ,CO2_diffusive_total,CO2_ebullitive_flux ,CO2_ebullitive_total Cuini,20050201,846.3,-8.0,839.0,falling,105.2,88.3,3.3,2.8,8139.3,6828.9, 21.8,18.3 Cuini,20050202,857.0,-8.1,828.2,falling,105.2,87.1,3.3,2.7,8139.3,6741.0, 21.8,18.1 Cuini,20050203,820.5,-7.8,864.8,rising,55.4,47.9,3.3,2.9,8139.3,7038.9,21.8,18.9 Cuini,20050204,850.4,-8.1,834.8,falling,105.2,87.8,3.3,2.8,8139.3,6794.7, 21.8,18.2 .... Itu,20060128,908.4,-3.0,386.8,rising,3,1.2,20.9,8.1,5216.4,2017.7,6.8,2.6 Itu,20060129,915.4,-3.0,379.8,falling,16.1,6.1,20.9,7.9,5216.4,1981.2,6.8,2.6 Itu,20060130,921.1,-3.0,374.1,falling,16.1,6.0,20.9,7.8,5216.4,1951.5,6.8,2.5 Itu,20060131,915.0,-3.0,380.2,rising,3,1.1,20.9,7.9,5216.4,1983.3,6.8,2.6 |
File #2: LC07_Monthly_C_fluxes.csv
| Column | Column Heading | Units/format | Description |
|---|---|---|---|
| 1 | Site | Sampling site name | |
| 2 | Date | YYYYMM | Month for which flux values were calculated |
| 3 | Dry_area_total | km2 | Area within the study area not flooded (dry) for the sample month calculated as the sum of daily measures and reported in kilometers squared |
| 4 | Flooded_area_total | km2 | Area within the study area flooded for the sample month calculated as the sum of daily measures and reported in kilometers squared |
| 5 | CH4 uptake | Mg C m-1 | Methane uptake from the atmosphere in the not flooded (dry) areas reported in Megagrams of carbon per month for the study area. Calculated as the mean daily rate multiplied by the dry area for each day and all days summed for each month. Negative values indicate a flux from the atmosphere to the soil or uptake |
| 6 | CH4_ebullitive_flux | Mg CH4 m-1 | Calculated ebullitive methane (CH4) flux from the surface waters of the flooded area reported in Megagrams of methane per month for the entire study area |
| 7 | CH4-C_ebullitive_flux | Mg C m-1 | Calculated ebullitive methane (CH4) flux from the surface waters of the flooded area reported in Megagrams of carbon per month for the entire study area |
| 8 | CH4_diffusive_flux | Mg CH4 m-1 | Calculated diffusive methane (CH4) flux from the surface waters of the flooded area reported in Megagrams of methane per month for the entire study area |
| 9 | CH4-C_diffusive_flux | Mg C m-1 | Calculated diffusive methane (CH4) flux from the surface waters of the flooded area reported in Megagrams of carbon per month for the entire study area |
| 10 | CO2_ebullitive_flux | Mg CO2 m-1 | Calculated ebullitive carbon find Megagrams of CO2 per month for the entire study area |
| 11 | CO2-C_ebullitive_flux | Mg C m-1 | Calculated ebullitive carbon dioxide (CO2) flux from the surface waters of the flooded area reported in Megagrams of carbon per month for the entire study area |
| 12 | CO2_diffusive_flux | Mg CO2 m-1 | Calculated diffusive carbon dioxide (CO2) flux from the surface waters of the flooded area reported in Megagrams of CO2 per month for the entire study area |
| 13 | CO2-C_diffusive_flux | Mg C m-1 | Calculated diffusive carbon dioxide (CO2) flux from the surface waters of the flooded area reported in Megagrams of carbon per month for the entire study area |
Example data for File #2:
|
Site,Date,Dry_area_total,Flooded_area_total,CH4
uptake,CH4_ebullitive_flux,CH4-C_ebullitive_flux,CH4_diffusive_flux,CH4-C_diffusive_flux,
CO2_ebullitive_flux,CO2-C_ebullitive_flux,CO2_diffusive_flux,CO2-C_diffusive_flux
Cuini,200502,22830.1,24356.58523,-123.2827278,1815,1361,41.7,31.3,531.1,159.3,
136568,40970
Cuini,200503,24134,28108.48588,-130.3233522,2323,1742.3,111.1,83.3,392.1,117.6,
147657,44297
Cuini,200504,23086.7,27470.4733,-124.6683242,2155,1615.9,151.8,113.8,447.8,
134.3,157403,47221
Cuini,200505,23369,28873.47832,-126.192393,2339,1753.9,538.7,404,512.5,
153.8,184186,55256 .... Itu,200510,27563,12588.17872,-6.738951981,122,91.5,167.5,125.6,80.7,24.2,137249,41175 Itu,200511,27096.4,11759.63703,-6.624857524,116,87.2,94.9,71.2,60.5,18.2,122789,36837 Itu,200512,27965.7,12185.5402,-6.837394079,118,88.8,162.4,121.8,101.6,30.5,95834,28750 Itu,200601,28555.5,11595.74384,-6.981594865,122,91.5,219.4,164.5,84,25.2,68413,20524 |
File #3: LC07_Hydrologic_measurements.csv. Table 2 provides the site latitudes, longitudes, and measuring instrument used at each site.
| Column | Column Heading | Units/format | Description |
|---|---|---|---|
| 1 | Site | Sampling site name | |
| 2 | Date | YYYYMMDD | Sampling date |
| 3 | Depth_wetland | cm | Depth of floodwater measured at sampling station reported in centimeters |
| 4 | T_water | C | Water temperature reported in degrees C |
| 5 | T_air | C | Air temperature reported in degrees C |
| 6 | Rainfall | mm | Recorded rainfall for this date reported in millimeters |
| missing data indicated by -9999 | |||
Table 2. Hydrological Stations
| Instrument | Site | Latitude, Longitude |
|---|---|---|
| Rain guage | Cuini site | -0.6631, -63.5556 |
| Itu site | -0.2863, -63.5590 | |
| Recording stage guage | Cuini site | -0.6648, -63.5622 |
| Itu site | -0.2903, -63.5637 | |
| Staff guage | Negro River | -0.5743, -63.4570 |
Example data for File #3:
|
Site,Date,Depth_wetland,T_water,T_air,Rainfall Itu,20040901,19,26.5,26.5,1 Itu,20040902,42,27.6,24.8,3 Itu,20040903,42,25.8,22.8,1 ... Cuini,20060111,101,28.1,25.0,0 Cuini,20060112,98,28.0,24.7,0 Cuini,20060113,97,27.8,23.9,-9999 |
Site boundaries: (All latitude and longitude given in decimal degrees)
| Site (Region) | Westernmost Longitude | Easternmost Longitude | Northernmost Latitude | Southernmost Latitude |
|---|---|---|---|---|
| Amazonas (Manaus) - Cuiuni (Amazonas (Manaus)) | -64.10797 | -63.09964 | -0.47570 | -1.14236 |
| Amazonas (Manaus) - Itu (Amazonas (Manaus)) | -63.559 | -63.559 | -0.2863 | -0.2863 |
Time period:
- The data set covers the period 2004/03/10 to 2006/01/31.
- Temporal Resolution:Water depth, water temperature and rainfall were measured daily at three sites for overlapping time periods. Gas fluxes were measured once a month between February 2005 and January 2006 with measurements used to calculate daily fluxes.
Platform/Sensor/Parameters measured include:
- FIELD INVESTIGATION / ANALYSIS / CARBON DIOXIDE
- FIELD INVESTIGATION / ANALYSIS / METHANE
3. Data Application and Derivation:
Emissions data from these wetlands can be scaled up using estimates of areal extent of similar ecosystems to better constrain the carbon budget of the Amazon Basin on seasonal and annual timescales.
4. Quality Assessment:
CH4 ebullitive emission measured in floating chambers was only 7% of that measured by inverted funnels; the 15 min deployment period of chambers was apparently too short to capture many bubbles (Belger et al., 2011).
The proportion of ebullitive CH4 emissions at the Cuini sites was close to values observed for other Amazon and Orinoco sites (Devol et al. 1988; Engle and Melack 2000; Rosenqvist et al. 2002; Smith et al. 2000), while the Itu sites had little ebullition. This may occur because sediments at Itu sites were sandy and compact while Cuini sites, which were permanently flooded, had soft muddy soil where more methane could be produced and stored.
5. Data Acquisition Materials and Methods:
Site description:
The study sites were in two interfluvial wetlands of the Negro River basin, located in the northwestern Brazilian Amazon. The Cuini wetland is located on the southern side of the Negro River between the Cuini and Araca rivers. The Itu wetland is located on the northern side of the Negro River in the headwaters of the Itu River.
Flooding varied seasonally, and extensive parts of the Cuini wetland were permanently flooded while the Itu wetlands dried several months per year. In the high-water season, the Cuini site was no more than 0.6 m deep (with the exception of stream channels), while Itu site was up to 1.3 m deep. The soils and sediments at the Itu site were composed predominantly of coarse sand while the sediments at the Cuini site consisted of fine grained organic mud (Belger et al., 2011).
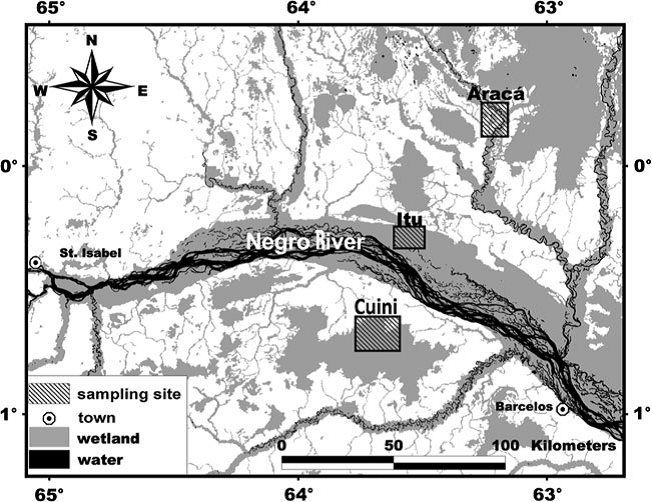
Figure 2. Map indicating the location of the Itu and Cuini study sites (Belger et al., 2011) (The Araca site (northern location on the map) was a third study site in the Belger et al. (2011) research, however the data from this site is not included with this data set).
Hydrologic measurements:
Depth and temperature were measured at the deepest locale found in each of the two wetlands by pressure transducers and thermistors linked to data loggers (Levelogger Solinst model 3001) and data were recorded daily at midnight. Rainfall was recorded at each site with tipping bucket rain gauges. Staff gauges graduated in centimeters were installed on the banks of the Negro River and read daily by local observers. Hydrologic measurements were taken from April 2004 through January, 2006. The location of the sites and guages are provided in Table 2.
Determination of inundated area:
Image analysis synthetic aperture radar data from Radarsat [C-band (6 cm), HH polarization] on 24 dates in 2004 and 2005 were used to determine inundated area in the Cuini and Itu wetlands. To reduce speckle, single look pixels were binned 4–1 resulting in 25-m resolution. A Landsat Thematic Mapper image obtained on 19 January 2003 was also used as part of the analysis, and additional Landsat TM images were used qualitatively. A wetland mask derived from an L-band SAR mosaic was used to mask uplands (Hess et al. 2003). A backscatter threshold (expressed as sigma), indicative of flooding, was selected to discriminate flooded and unflooded regions on the date of each Radarsat acquisition.
Gas Sampling areas:
At both sites measurements were made ~daily from February 2005 to January 2006 at stations where boardwalks were constructed to avoid release of gases caused by the person making the collections. At the Itu site a total of eight stations representing palms, shrubs, grasses or open water were selected. At the Cuini site five stations were sampled because palm dominated locations did not occur and only one open water locale was sampled. Supplementary measurements were made occasionally at other points in Itu and Cuini wetlands but the data are not reported in this data set. Sampling dates are included as a text file to distinguish dates when measurements were taken, versus the dates for the calculated values.
CO2 and CH4 flux measurements:
Flux of CO2 and CH4 were measured in the Cuini and Itu wetlands with floating chambers and inverted funnels when habitats were flooded, and with terrestrial chambers when the environment was not flooded based on methodology described in Rosenqvist et al. (2002). Floating and terrestrial chambers measured primarily diffusive emissions and funnels measured ebullition.
Measurements were made at each site/station in duplicate once a month. A total of 156 sample pairs were taken, nine when locales were unflooded and 33 with insufficient depth for use of the inverted funnels. Site flux values are the average of the individual station measurements.
Floating and terrestrial chambers:
The floating chamber consisted of a polyethylene cylinder 25 cm in diameter, open at the bottom and covered with styrofoam, except for a 2-cm polyethylene lip which protruded at the bottom. The styrofoam held the chamber in a fixed position while floating, maintaining a constant internal volume.
A terrestrial chamber, 31 cm in diameter, was used in dry conditions, and consisted of an aluminium cylinder with a removable cover and an open bottom with a bevelled edge. When this chamber was deployed, the bevelled edge penetrated to a depth of approximately 1 cm to limit atmospheric exchange. The cover was removed initially so that the internal dimensions of the cylinder could be determined and then closed during the measurement. Chambers were vented to adjust for pressure changes during deployment and contained a fan to circulate air inside.
Measurements made by floating and terrestrial chambers lasted 15 min, and samples of gas were taken at 5-min intervals with 60-ml polyethylene syringes. All gas samples were immediately transferred to serum vials with gas-tight stoppers and stored before analysis.
Funnel measurements:
Funnels were 10 cm in diameter and were placed just under the water surface. They were deployed for 24 h and accumulated gas was collected with 10-ml polyethylene syringes and the volume was noted. Samples were transferred to 25-ml serum bottles capped with high density black butyl rubber stoppers until analysis.
Diffusive and ebullitive emissions:
Following the procedures in Smith et al. (2000), if the linear regression of gas flux versus time had p less than 0.05, the flux was considered diffusive. An additional criterion of R2 greater than 0.8 was used to consider emission measured in chamber-only to be diffusive. Chamber results that did not meet these criteria were analyzed one by one. An abrupt increase in gas concentration was considered ebullition. The amount of gas emitted by ebullition was calculated as the distance between the extensions of two parallel lines formed by diffusive emission rates before and after the bubbling.
Diffusive and ebullitive emissions of CO2 and CH4 were estimated for the Itu and Cuini wetlands. These were calculated by multiplying the daily measured emissions by the daily inundated area estimated for each site. The fluxes from unflooded areas were estimated with data collected by terrestrial chambers multiplied by the unflooded area of each site.
Daily CH4 ebullitive emissions:
As CH4 ebullitive emission differed mainly between periods of rising and falling water level, daily ebullitive emissions were determined by only this factor. When the level at the Cuini site was lower than the level of the previous day, the average daily flux value used in the calculations was 105 mg CH4 m-2 d-1. When the level was rising, the average daily flux value used was 55 mg CH4 m-2 d-1. When water level at the Itu site was falling, the average daily flux value used for the calculations of total emissions was 16 mg CH4 m-2 d-1. When the level was rising, the average daily flux value used was 3 mg CH4 m-2 d-1.
Monthly emissions:
CH4 flux from the unflooded (dry) area was calculated as an average of the rates measured in the terrestrial chambers. The diffusive CO2 emission when environment not flooded was considered zero, since the terrestrial chambers registered no or very low emissions at this time.
Hydrologic measurements:
Depth and temperature were measured at the deepest locale found in each of the two wetlands by pressure transducers and thermistors linked to data loggers (Levelogger Solinst model 3001) and data were recorded daily at midnight. Rainfall was recorded at each site with tipping bucket rain gauges. Staff gauges graduated in centimeters were installed on the banks of the Negro River and Araca River and read daily by local observers.
6. Data Access:
This data is available through the Oak Ridge National Laboratory (ORNL) Distributed Active Archive Center (DAAC).
Data Archive Center:
Contact for Data Center Access Information:
E-mail: uso@daac.ornl.gov
Telephone: +1 (865) 241-3952
7. References:
Belger, L., B.R. Fosberg and J.M. Melack. 2011. Carbon dioxide and methane emissions from interfluvial wetlands in the upper Negro River basin, Brazil. Biogeochemistry 105:171-183 DOI 10.1007/s10533-010-9536-0.
Devol, A.H., Richey, J.E., Forsberg, B.R., Martinelli, L.A. (1990). Seasonal dynamics in methane emissions from the Amazon River floodplain to the troposphere. J Geophys Res 95:16417–16426.
Engle, D., Melack, J.M. (2000). Methane emissions from an Amazon floodplain lake: enhanced release during episodic mixing and during falling water. Biogeochemistry 51: 71–90.
Hamilton, S.K., Sippel, S.J., Melack, J.M. (1995). Oxygen depletion and carbon-dioxide and methane production in waters of the Pantanal wetland of Brazil. Biogeochemistry 30:115–141
Hess, L.L., Melack, J.M., Novo, E.M.L.N., Barbosa, C.C.F., Gastil, M. (2003). Dual-season mapping of wetland inundation and vegetation for the central Amazon basin. Remote Sens Environ 87:404–428
Rosenqvist, A., Forsberg, B.R., Pimentel, T., Rauste, Y.A., Richey, J.E. (2002). The use of spaceborne radar data to model inundation patterns and trace gas emissions in the central Amazon floodplain. Int J Remote Sens 33:1303–1328.
Smith, L.K., Lewis, .W.M., Chanton, J.P., Cronin, G., Hamilton, S.K. (2000). Methane emissions from the Orinoco River floodplain, Venezuela. Biogeochemistry 51:113–140.