Get Data
Summary:
This data set reports monthly mean inundation areas (square kilometers) for four cover classes of Central Amazon wetlands habitat: Open water (OW), river channel (RC) class, macrophyte (MA) class, and a flooded forest (FF) class, which also incorporates a flooded shrub class. The full study area was a 1.77 million km2 quadrant covering the Central Amazon Basin. Inundation was also calculated from three subsets of this area: (1) covering only the Amazon/Solimoes River mainstem and (2) the Eastern and (3) the Western halves of this mainstem area. There is one comma-delimited ASCII data file in this data set.
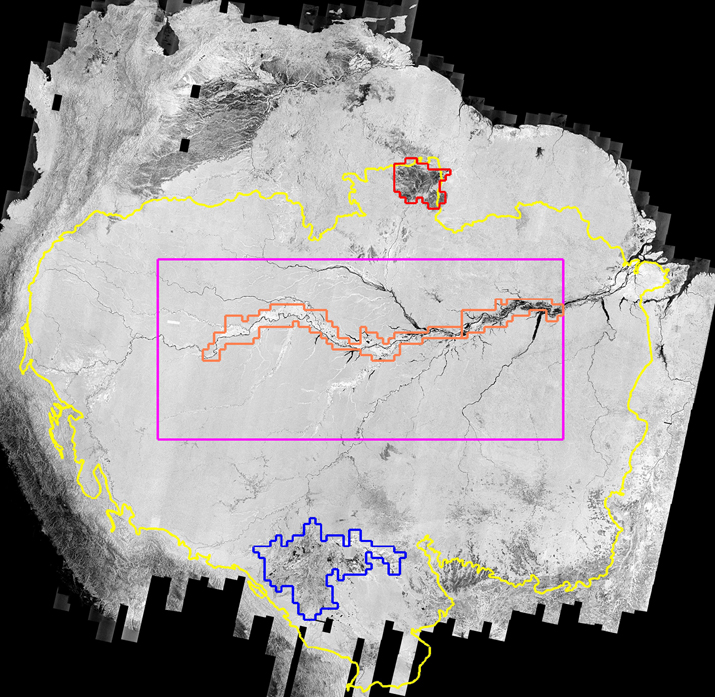
Figure 1. Location of Amazon regions used for calculations of monthly inundation areas. The background image is the high-water Japanese Earth Resources Satellite-1 (JERS-1) mosaic displayed as a gray scale of radar backscatter (Siqueira et al., 2000). Yellow line indicates boundary of the lowland Amazon basin less than 500 m above sea level; rectangle in magenta delimits 1.77 million square kilometer Central Amazon Basin area examined in this analysis. The Solimoes/Amazon mainstem floodplain area is shown in orange. Areas delineated by dark blue (Llanos de Mojos) and red (Roraima wetlands) were not part of this study. Figure from Melack et al. 2004
Cite this data set as follows:
Melack J.M, L.L. Hess, M. Gastil, B.R. Forsberg, S.K. Hamilton, I.B.T. Lima, E.M.L.M. Novo. 2011. LBA-ECO LC-07 Monthly Mean Flooded Wetlands Habitat, Central Amazon Basin: 1979-1996. Data set. Available on-line [http://daac.ornl.gov] from Oak Ridge National Laboratory Distributed Active Archive Center, Oak Ridge, Tennessee, U.S.A. doi: 10.3334/ORNLDAAC/1049
Implementation of the LBA Data and Publication Policy by Data Users:
The LBA Data and Publication Policy [http://daac.ornl.gov/LBA/lba_data_policy.html] is in effect for a period of five (5) years from the date of archiving and should be followed by data users who have obtained LBA data sets from the ORNL DAAC. Users who download LBA data in the five years after data have been archived must contact the investigators who collected the data, per provisions 6 and 7 in the Policy.
This data set was archived in December of 2011. Users who download the data between December 2011 and November 2016 must comply with the LBA Data and Publication Policy.
Data users should use the Investigator contact information in this document to communicate with the data provider. Alternatively, the LBA Web Site [http://lba.inpa.gov.br/lba/] in Brazil will have current contact information.
Data users should use the Data Set Citation and other applicable references provided in this document to acknowledge use of the data.
Table of Contents:
- 1 Data Set Overview
- 2 Data Characteristics
- 3 Applications and Derivation
- 4 Quality Assessment
- 5 Acquisition Materials and Methods
- 6 Data Access
- 7 References
1. Data Set Overview:
Project: LBA (Large-Scale Biosphere-Atmosphere Experiment in the Amazon)
Activity: LBA-ECO
LBA Science Component: Land Use and Land Cover
Team ID: LC-07 (Melack / Novo / Forsberg)
The investigators were Melack, John M.; Novo, Evlyn Marcia Leao de Moraes; Hess, Laura; Forsberg, Bruce Rider; Gastil-Buhl, Mary; Lima, Ivan Bergier Tavares de; and Hamilton, Stephen K. You may contact Gastil-Buhl, Mary (mary@icess.ucsb.edu).
LBA Data Set Inventory ID: LC07_Monthly_Inundated_Areas
This data set reports monthly mean inundation areas for four cover classes of wetlands habitat: Open water (OW) river channel (RC) class, macrophyte (MA) class, and a flooded forest (FF) class, which also incorporates a flooded shrub class. The study area was in a quadrant covering the Central Amazon Basin and in a subset of this area covering the Amazon/Solimoes River mainstem. Monthly mean inundation areas data derived from SMMR were averaged for the period January 1979 through August 1987. Two basin-wide JERS-1 SAR data sets, timed to low- and high-water stages of the Amazon River were used to determine seasonal patterns of inundation.
Related_Data_Sets
- LBA-ECO LC-11 JERS-1 SAR Global Rain Forest mapping Project: Vol. AM-1, South America (Used to create mask and wetlands class map which was used to calculate areas)
- LBA-ECO LC-07 Passive Microwave Measurement of Inundated Area (Used to model monthly variation in flooding between two dates)
- LBA-ECO LC-07 Central Amazon Wetlands Mapping: Habitats and Mask (This is the class map the areas are modeled from)
- LBA-ECO LC-07 Central Amazon Wetlands Mask, 100 m, version 0 (This masks upland, the precursor to the wetlands habitat map)
2. Data Characteristics:
There is one comma-delimited data file in this data set.
File name: LC07_Amazon_wetland_habitats_monthly_flooded_area.csv
Monthly flooded wetland areas were calculated from a wetlands classification map and monthly estimates of flooded area. Flooded areas for four study areas and four wetlands classifications are given in square km.
| Column | Heading | Units/format | Description |
|---|---|---|---|
| 1 | Region | Region: Amazon Central, Amazon Mainstem, Amazon Mainstem West, Amazon Mainstem East | |
| 2 | Habitat_class | Wetland habitat classification: MA (macrophyte), FF (flooded forest), OW (open water), RC (river channel) | |
| 3 | Month | MM | Month |
| 4 | Flooded_area | square km | Monthly mean flooded area in square kilometers (means for the months between 1979-1987). |
Example Data Records:
| Region,Habitat_class,Month,Flooded_area Amazon Central,MA,1,45900 Amazon Central,MA,2,52484 ... Amazon Central,FF,1,69558 Amazon Central,FF,2,65987 ... Amazon Central,OW,1,36045 Amazon Central,OW,2,41576 ... Amazon Mainstem,MA,1,4077 Amazon Mainstem,MA,2,4196 ... Amazon Mainstem West,FF,1,9759 Amazon Mainstem West,FF,2,11711 ... Amazon Mainstem West,RC,11,5350 Amazon Mainstem West,RC,12,5350 ... Amazon Mainstem East,FF,1,1788 Amazon Mainstem East,FF,2,2427 ... Amazon Mainstem East,RC,11,3190 Amazon Mainstem East,RC,12,3190 |
Site boundaries:(All latitude and longitude given in decimal degrees and fractions)
| Site (Region) | Westernmost Longitude | Easternmost Longitude | Northernmost Latitude | Southernmost Latitude | Geodetic Datum |
|---|---|---|---|---|---|
| Central Amazon Basin (Amazon Basin) | -72 | -54 | 0 | -8 | World Geodetic System, 1984 (WGS-84) |
| Amazon/Solimoes River mainstem (Amazon Basin) | -70 | -54 | -2 | -5 | World Geodetic System, 1984 (WGS-84) |
| Western Reaches of Amazon/Solimoes River mainstem (Amazon Basin) | -70 | -58.5 | -2 | -5 | World Geodetic System, 1984 (WGS-84) |
| Eastern Reaches of Amazon/Solimoes River mainstem (Amazon Basin) | -58.5 | -54 | -2 | -5 | World Geodetic System, 1984 (WGS-84) |
Time period:
- The data set covers the period 1979/01/01 to 1996/06/30
- Temporal Resolution: monthly
Platform/Sensor/Parameters measured include:
- JERS-1 / JERS-1 SAR / LAND COVER
- NIMBUS-7 / SMMR / LAND CLASSES
- JERS-1 / JERS-1 SAR / LAND COVER
- JERS-1 / JERS-1 SAR / WETLANDS
3. Data Application and Derivation:
The SAR-based mapping provided a basis for improved estimates of the contribution of wetlands to biogeochemical and hydrological processes in the Amazon basin, a key question in the Large-Scale Biosphere-Atmosphere Experiment in Amazonia. This data was derived from the wetlands habitat map (Hess et al., 2003) and passive microwave monthly data (Hamilton et al., 2002).
The data were applied to calculate methane emissions from Amazonian wetlands (Melack et al., 2004). Accurate estimation of methane emissions from wetlands requires knowledge of seasonal changes in vegetation and inundation. In addition to biogeochemical applications, information on the seasonal extent of floodplain habitats is also required for effective management of Amazon fisheries, since many key fish species harvested in the Amazon basin obtain nutrition in flooded forests or from organic matter derived from floodplain algae (Hess et al., 2003). Knowledge of the spatial and temporal variability of inundation in floodplains is also fundamental for the conservation and management of floodplain rivers (Junk, 1997; Hamilton, 1999). The information is also useful in simulation models of water and material fluxes through riverine systems (Vorosmarty et al., 1997).
This data was applied to calculate methane emissions. Results reported in Melack, 2004. Derivation: This data was derived from the wetlands habitat map (Hess, 2003) and passive microwave monthly data (Hamilton, 2002). The habitat map product was derived from the GRFM mosaic (see LC-11 data set).
4. Quality Assessment:
Thematic accuracy of the wetland mapping was assessed using high-resolution digital videography acquired during two aerial surveys of the Brazilian Amazon. A polygon-based segmentation and clustering was used to delineate wetlands extent with an accuracy of 95%. A pixel-based classifier was used to map wetlands vegetation and flooding state based on backscattering coefficients of two-season class combinations. Producer’s accuracy for flooded and nonflooded forest classes ranged from 78% to 91%, with lower accuracy (63–65%) for flooded herbaceous vegetation. Seventeen percent of the 1.77 million km2 study area was occupied by wetlands, which were 96% inundated at high water and 26% inundated at low water. Flooded forest constituted nearly 70% of the entire wetlands area at high water, but there are large regional variations in the proportions of wetlands habitats.
The inundation patterns imaged on the SAR mosaics must be considered in relation to long-term river stage records. Timing of the annual flood wave varies little, but the wave amplitude is affected by regional climatic factors such as ENSO events. For the main stem floodplain near Manaus, the high-water mosaic images were acquired at river stages approx. 20 cm higher than the long-term mean high-water stage and the low-water mosaic images were acquired at river levels about 3.5 m below mean low-water stage. The recurrence interval for river stage as low as that captured on the SAR low water mosaic is 10 years. Thus, the SAR mosaics represent average high-water conditions, and lower than average low water conditions, for the central main stem floodplain.
A normal distribution with a SD of 25% of the mean was used for the SMMR estimates of inundated area per month based on the sensitivity analysis in Sippel et al. (1998). A normal distribution with a SD of 10% of the mean was used for open water in the Solimoes/Amazon River channel based on Sippel et al. (1998).
(Excerpt from Melack, 2004, p. 536)
Uncertainties in the areas of wetland habitats were estimated with class probabilities derived from error matrices based on randomly located test pixels (Hess et al., 2003) and sampling frequencies derived from mapped class proportions in the fringing floodplains of the Solimoes/Amazon mainstem and in the 1.77 km2 central quadrant (Table 2). The uncertainties, which reflect both the degree of confusion between classes and the relative areas of the classes for each date and region, range from 2% to 13%. A normal distribution with a SD of 25% of the mean was used for the SMMR estimates of inundated area per month based on the sensitivity analysis in Sippel et al. (1998). A normal distribution with a SD of 10% of the mean was used for open water in the Solimoes/Amazon River channel based on Sippel et al. (1998).
5. Data Acquisition Materials and Methods:
SAR Mosaics and Delineation of Study Areas
Synthetic aperture radar (SAR) images acquired by the Japanese Earth Resource Satellite-1 (JERS-1) as part of the Global Rain Forest Mapping (GRFM) Project were mosaicked and radiometrically calibrated at the NASA Jet Propulsion Laboratory. Two basin-wide data sets were acquired, timed to low- and high-water stages of the Amazon River (August-September 1995 and May-August 1996, respectively), to determine seasonal patterns of inundation.
The study focused on a subset of the basin-wide mosaics, extending 18 degrees in longitude by 8 degrees in latitude and corresponding to the Central Amazon Basin region (the magenta box in Figure 1). With an area of 1.77 million km2, the study quadrant covered about one third of the lowland Amazon basin (defined as areas less than 500 m in elevation) and included the main stem of the Amazon River from slightly downstream of the Napo River confluence to slightly downstream of the Tapajos River, the Negro River south of the Uaupes River confluence, and the lower reaches of the Tapajos, Trombetas, Madeira, Purus, Japura, Jurua, and Ica rivers. The quadrat received complete coverage during the low-water imaging; at high-water stage, scenes covering approximately 12,000 km2 were not imaged.
A subset of the Central Amazon Basin, the Solimoes/Amazon Mainstem floodplain (outlined in orange in Figure 1), was delineated based on geomorphology as indicated by side-looking airborne radar images from the RADAMBRASIL project (Sippel et al., 1992), SMMR analyses of inundated area (Sippel et al., 1998), and JERS-1 analyses of inundation, vegetation, and geomorphology (Hess et al., 2003).
Site description
Amazon Central is a 1.77 km2 quadrant covering the Central Amazon Basin
between 0 and 8 degrees S latitude and 72 to 54 degrees W longitude.
Amazon Mainstem is a region covering the Amazon/Solimoes river mainstem
from 70 degrees W to 54 degrees W. The study quadrant covered about one
third of the lowland Amazon basin (defined as areas less than 500 m in
elevation) and included the main stem of the Amazon River from slightly
downstream of the Napo River confluence to slightly downstream of the
Tapajos River, the Negro River south of the Uaupes River confluence,
and the lower reaches of the Tapajos, Trombetas, Madeira, Purus,
Japura, Jurua, and Ica rivers.
Habitat description
The flooded area was partitioned into four habitat classes (Melack,
GCB, 2004): Open water (OW); river channel (RC)
class, which is combined in the open water class (OW) for the overall
Central Amazon Basin, but the two classes are separate for the three mainstem
sub-areas; macrophyte (MA) class, which also incorporates a
flooded woodland class
and a mixed class; and a flooded forest (FF) class, which also
incorporates a flooded shrub class.
Amazon Central Basin wetland habitats - monthly mean inundated areas in square km
| Class ID | Jan | Feb | Mar | Apr | May | Jun | Jul | Aug | Sep | Oct | Nov | Dec |
|---|---|---|---|---|---|---|---|---|---|---|---|---|
| MA | 45,900 | 5,2484 | 58,532 | 65,987 | 71,185 | 60,602 | 6,0017 | 53,867 | 38,899 | 29,382 | 28,322 | 37,946 |
| FF | 69,558 | 87,478 | 110,698 | 142,002 | 170,939 | 173,801 | 134,232 | 95,529 | 51,135 | 28,379 | 33,051 | 51,877 |
| OW | 36,045 | 41,576 | 46,428 | 52,463 | 56,519 | 51,698 | 53,653 | 49,807 | 37,568 | 28,536 | 24,471 | 29,775 |
Videographic Surveys
Four aerial videographic surveys of the central Amazon region were
conducted during high- and low-water periods to acquire data sets
suitable for training of classification algorithms and assessment of
classification accuracy. These Validation Overflights for Amazon
Mosaics surveys (VOAM95, VOAM96, VOAM975, and VOAM99) acquired ground
documentation of temporally dynamic inundation status over the large,
remote region with persistent cloud cover. VOAM95 and VOAM96 data were
acquired nearly simultaneously with the SAR mosaic scenes covering the
JERS-1 survey flight lines. VOAM975 and VOAM99 were follow-up surveys
conducted to expand the ground data set to a more extensive region and
to improve the geolocation accuracy and resolution of the video data
(Hess et al., 2002; 2003).
Creation of Wetlands Mask
A wetlands mask distinguishing wetlands from nonwetlands areas was
created in order to calculate total wetlands area and spatial
distribution, and eliminate nonwetlands areas with backscattering
statistics similar to those of wetlands. For this study, wetlands were
defined as (1) areas that were inundated during either or both JERS-1
mosaic acquisition periods and (2) areas not flooded on either date,
but which were adjacent to or surrounded by flooded areas and which
displayed landforms consistent with wetlands geomorphology.
Mapping of Vegetation and
Inundation
Following wetlands delineation, areas within the wetlands mask were
classified into ‘‘cover states’’ for both flooded and nonflooded seasons.
For this data set, only flooded classes were used to calculate
inundated areas. Some cover classes from Hess et al. (2003) were
combined to produce four categories (i.e. floating macrophytes, flooded
forest, open water, and mainstem river channel). The floating
macrophyte area (MA) included flooded woodland habitat that commonly
has floating macrophytes covering much of the water’s surface and a
mixed herbaceous habitat along channel edges. The flooded shrub habitat
was added to the flooded forest (FF) habitat. For the mainstem
Solimoes/Amazon River, river channel areas (RC) were obtained from
Sippel et al. (1998) and were accounted for separately from the rest of
the open water category (OW).
Monthly Mean Inundation Areas
Monthly mean inundation areas were derived from analysis of the 37-GHz
polarization difference observed by the Scanning Multichannel Microwave
Radiometer (SMMR) operated on board the Nimbus-7 satellite from January
1979 through August 1987 (Sippel et al., 1998; Hamilton et al., 2002).
The SMMR observation period coincided with a relatively complete set of
stage observations for South American rivers and facilitated comparison
of the satellite information with ground observations of the timing of
flooding. The passive microwave monthly data of total flooded area did not discriminate between different flooded habitats.
Wetlands Monthly Flooded
Habitat Areas
For this data set, the wetlands habitat map (Hess et al., 2003) was
combined with the passive microwave monthly data (Sippel et al., 1998; Hamilton
et al., 2002) to model the possible distribution of flooded habitats by month.
The dual-season habitat map at low- and high-water was considered as the
end-points of the monthly distribution of habitat areas.
6. Data Access:
This data is available through the Oak Ridge National Laboratory (ORNL) Distributed Active Archive Center (DAAC).
Data Archive Center:
Contact for Data Center Access Information:
E-mail: uso@daac.ornl.gov
Telephone: +1 (865) 241-3952
7. References:
Hamilton, S.K., S.J. Sippel, and J.M. Melack. 2002. Comparison of inundation patterns among major South American floodplains. J. of Geophysical Research-Atmospheres, 107(D20): Article-8038.
Hess, L.L.,E.M.L.M. Novo, D.M. Slaymaker, J. Holt, C. Steffen, D.M. Valeriano, L.A.K. Mertes, T. Krug, J.M. Melack, M. Gastil, C. Homes, and C. Hayward. 2002. Geocoded digital videography for validation of land cover mapping in the Amazon basin. Int. J. Remote Sensing, 23(7): 1527-1556.
Hess, L.L., J.M. Melack, E.M.L.M. Novo, C.C.F. Barbosa, and M. Gastil. 2003. Dual-season mapping of wetland inundation and vegetation for the central Amazon basin. Remote Sensing of Environment, 87: 404–428.
Melack, J.M., L.L. Hess, M. Gastil, B.R. Forsberg, S.K. Hamilton, I.B.T. Lima, and E.M.L.M. Novo. 2004. Regionalization of methane emissions in the Amazon Basin with microwave remote sensing. Global Change Biology, 10: 530-544.
Sippel, S.J., S.K. Hamilton, J.M. Melack, and E.M.L.M. Novo. 1998. Passive microwave observations of inundation area and the area/stage relation in the Amazon River floodplain. Int. J. Remote Sensing, 19(16): 3055-3074.
Related Publications
- Chapman, B., P. Siqueira, and A. Freeman. 2002. The JERS Amazon Multi-Season Mapping Study (JAMMS): Observation strategies and data characteristics. International Journal of Remote Sensing, 23: 1427– 1446.
- Federal Geographic Data Committee. 1997. National vegetation classification standard (FGDC-STD-005). Washington, DC, USA.