Get Data
Summary:
This data set reports (1) total aboveground dry biomass based on detailed estimates of all live and dead plant material, (2) results from repeated surveys of aboveground biomass allowing the calculation of above-ground productivity, and (3) soil chemical and physical characteristics for 50 1- ha plots of undisturbed and fragmented central Amazonian rainforest within the Biological Dynamics of Forest Fragments Project (BDFFP) study area. The reported data are plot-level summaries based on plant and soil samples and measurements obtained over the 1997 to 2001 timeframe.
The BDFFP study area is an experimentally fragmented landscape spanning 1,000 km2 located 70–90 km north of Manaus, Amazonas, Brazil. For additional information about the BDFFP and research conducted at the site, please visit their web site at http://pdbff.inpa.gov.br/index.html.
There are six comma-separated ASCII data files with this data set.
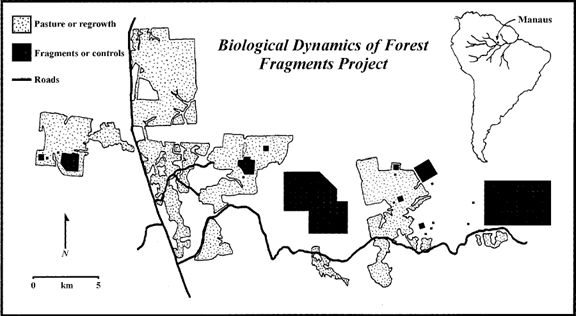
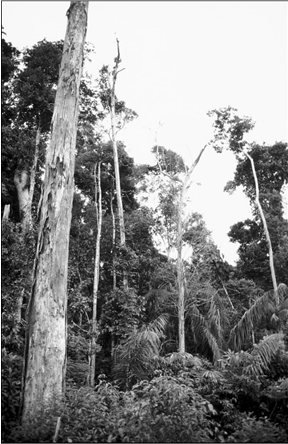
Figure 1. (A) Location and layout of Biological Dynamics of Forest Fragments Project (BDFFP) study area north of Manaus. (B) Typical tree mortality and damage near the margins of Amazonian forest fragments. From Nascimento and Laurance (2004).
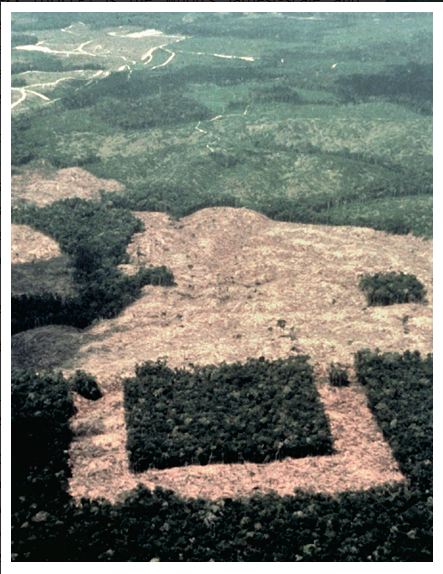
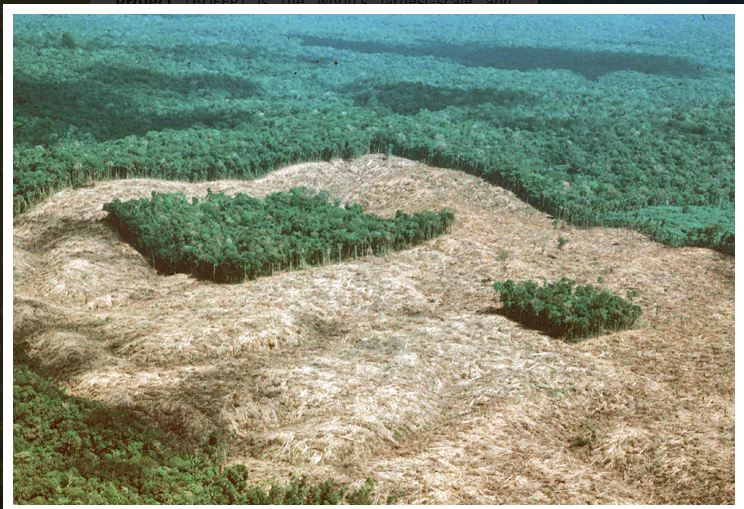
Figure 2. Photos of the BDFFP experimentally fragmented landscape during initial forest clearing, 1981-1987. Source: Smithsonian Tropical Research Institution, http://www.stri.si.edu/english/research/facilities/affiliated_stations/bdffp/index.php
Data Citation:
Cite this data set as follows:
Nascimento, H.E.M. and W.F. Laurance. 2011. LBA-ECO LC-05 Biomass and Soil Properties of Fragmented Forests, Amazonas, Brazil. Available on-line [http://daac.ornl.gov] from Oak Ridge National Laboratory Distributed Active Archive Center, Oak Ridge, Tennessee, U.S.A. http://dx.doi.org/10.3334/ORNLDAAC/1040
Implementation of the LBA Data and Publication Policy by Data Users:
The LBA Data and Publication Policy [http://daac.ornl.gov/LBA/lba_data_policy.html] is in effect for a period of five (5) years from the date of archiving and should be followed by data users who have obtained LBA data sets from the ORNL DAAC. Users who download LBA data in the five years after data have been archived must contact the investigators who collected the data, per provisions 6 and 7 in the Policy.
This data set was archived in September of 2011. Users who download the data between September 2011 and August 2016 must comply with the LBA Data and Publication Policy.
Data users should use the Investigator contact information in this document to communicate with the data provider. Alternatively, the LBA Web Site [http://lba.inpa.gov.br/lba/] in Brazil will have current contact information.
Data users should use the Data Set Citation and other applicable references provided in this document to acknowledge use of the data.
Table of Contents:
- 1 Data Set Overview
- 2 Data Characteristics
- 3 Applications and Derivation
- 4 Quality Assessment
- 5 Acquisition Materials and Methods
- 6 Data Access
- 7 References
1. Data Set Overview:
Project: LBA (Large-Scale Biosphere-Atmosphere Experiment in the Amazon)
Activity: LBA-ECO
LBA Science Component: Carbon Dynamics
Team ID: LC-05 (Laurance / Mesquita)
The investigators were Laurance, William F.; Albernaz, Ana Luisa K. M.; Mesquita, Rita Guimaraes; Silveira, Marcos; Andrade, Ana Cristina Segalin de; Bergen, Scott; Da Costa, Carlos; Delamonica, Patricia; Hepolito, Rosely Cavalcante; Luizao, Flavio Jesus; Monaco, Luciana Magalhaes; Moreira, Marcelo Paustein; Nascimento, Henrique Eduardo; Rittl, Carlos; Rubenstein, Adriana; Schroth, Goetz; Vasconcelos, Heraldo L.; Venticinque, Eduardo Martins; Warriner Laurance, Susan Gai and Williamson, G. Bruce. You may contact Nascimento, Dr. Henrique (nascimentoh@tivoli.si.edu).
LBA Data Set Inventory ID: LC05_BDFF_Biomass_Soils
This data set reports (1) total aboveground dry biomass based on detailed estimates of all live and dead plant material, (2) results from repeated surveys of aboveground biomass allowing the calculation of above-ground productivity, and (3) soil chemical and physical characteristics for 50 1-ha plots of undisturbed and fragmented central Amazonian rainforest within the Biological Dynamics of Forest Fragments Project (BDFFP) study area. The reported data are plot-level summaries based on plant and soil samples and measurements obtained over the 1997 to 2001 timeframe. Amazonian forests play a key role in the global carbon cycle, but there is much uncertainty about the quantity and distribution of carbon stored in these forests and soils.
2. Data Characteristics:
There are six comma-separated ASCII data files with this data set.
File #1: LC05_BDFF_Large_Tree_Biomass.csv
Large trees: For each 1 ha plot biomass of trees greater than or equal to 10 cm diameter at breast height ((DBH) measured at 1.3 m or above butresses) was reported from the most recent census (1997-1999).
| Column | Heading | Units/format | Description |
|---|---|---|---|
| 1 | Plot | Unique identifier for each 1 ha plot (fragment number for 1 ha plots; fragment number.replicate number for plots within larger fragments or contiguous forest) | |
| 2 | Site | Site type FRAG= forest fragment: MC= contiguous forest | |
| 3 | Fragment_size | ha | Fragment size in hectares (ha), contiguous forest is represented by MC |
| 4 | Edge_distance | m | Distance to the nearest forest edge in meters (m) |
| 5 | DBH_class | Diameter classes: where class 1 = 10.0-19.9 cm DBH, class 2 = 20.0-39.9 cm DBH, and class 3 = >= 40 cm DBH | |
| 6 | Biomass_primary_sp | Mg/ha | Biomass in Megagrams per hectare (Mg/ha) of primary species with DBH greater than or equal to 10 cm |
| 7 | Biomass_cecropia | Mg/ha | Biomass in Megagrams per hectare (Mg/ha) of cecropia trees with DBH greater than or equal to 10 cm |
| 8 | Biomass_pioneer_sp | Mg/ha | Biomass in Megagrams per hectare (Mg/ha) of all individuals classified as pioneer species with DBH greater than or equal to 10 cm |
| 9 | Density_primary_sp | stems/ha | Density in number of stems per hectare (stems/ha) of trees of species associated with mature forest with diameters greater than or equal to 10 cm |
| 10 | Density_cecropia | stems/ha | Density in number of stems per hectare (stems/ha) of cecropia trees with diameters greater than or equal to 10 cm |
| 11 | Density_pioneer_sp | stems/ha | Density in number of stems per hectare (stems/ha) of pioneer species with diameter greater than or equal to 10 cm |
| For allometric equations used to calculate the biomass of each component see Nascimento and Laurance (2002): Forest Ecology and Management, 168:311-321 | |||
Example data records
Plot,Site,Fragment_size,Edge_distance,DBH_class,Biomass_primary_sp,Biomass_cecropia,Biomass_pioneer_sp, Density_primary_sp,Density_cecropia,Density_pioneer_sp 1101,MC,MC,700,1,44.782,0.247,0.141, 360,4,2 1101,MC,MC,700,2,129.809,0.956,0, 178,4,0 1101,MC,MC,700,3,166.998,0,1.723, 53,0,1 ... 3304.1,FRAG,100ha,52,1,50.918,0.441,1.193, 405,8,13 3304.1,FRAG,100ha,52,2,144.481,0.281,0.296, 202,1,1 3304.1,FRAG,100ha,52,3,156.269,0,0, 46,0,0 ... 3402.7,MC,MC,3000,1,45.864,0.023,0.488, 368,1,7 3402.7,MC,MC,3000,2,117.646,0,0.696, 168,0,3 3402.7,MC,MC,3000,3,160.643,0,0, 50,0,0 ... |
File #2: LC05_BDFF_Small_Tree_Biomass.csv
Small trees: In 1999-2000 the diameters of small trees ( 5.0 to 9.9 cm DBH) were recorded in 13 quadrants (20 x 20 m each) that were evenly arrayed over each plot.
| Column | Heading | Units/format | Description |
|---|---|---|---|
| 1 | Plot | Unique identifier for each 1 ha plot (fragment number for 1 ha plots; fragment number.replicate number for plots within larger fragments or contiguous forest) | |
| 2 | Edge_distance | m | Distance to the nearest forest edge in meters (m) |
| 3 | Fragment_size | ha | Fragment size in hectares (ha), contiguous forest is represented by MC |
| 4 | Site | Site type FRAG= forest fragment: MC= contiguous forest | |
| 5 | Small_trees_primary_sp | Mg/ha | Biomass in megagrams per hectare (Mg/ha) of primary species with DBH between 5 and 9.9 cm |
| 6 | Small_pioneer_sp | Mg/ha | Biomass in megagrams per hectare (Mg/ha) of pioneer species with DBH between 5 and 9.9 cm |
| 7 | Small_cecropia | Mg/ha | Biomass in megagrams per hectare (Mg/ha) of cecropia with DBH between 5 and 9.9 cm |
| 8 | Small_palm | Mg/ha | Biomass in megagrams per hectare (Mg/ha) of palm trees with DBH between 5 and 9.9 cm |
| 9 | Sapling_primary_sp | Mg/ha | Biomass in megagrams per hectare (Mg/ha) of primary species saplings with DBH between 1 and 4.9 cm |
| 10 | Sapling_pioneer_sp | Mg/ha | Biomass in megagrams per hectare (Mg/ha) of pioneer species with DBH between 1 and 4.9 cm |
| 11 | Sapling_cecropia | Mg/ha | Biomass in megagrams per hectare (Mg/ha) of cecropia trees with DBH between 1 and 4.9 cm |
| 12 | Sapling_palm | Mg/ha | Biomass in megagrams per hectare (Mg/ha) of palm trees with DBH between 1 and 4.9 cm |
Example data records
|
Plot,Edge_distance,Fragment_size,Site, Small_trees_primary_sp,Small_pioneer_sp,Small_cecropia,Small_palm,Sapling_primary_sp,Sapling_pioneer_sp,Sapling_cecropia,Sapling_palm 1101,700,MC,MC, 12.5379,0.2652,0.0437,0.1436,5.4185,0.1282,0.0766,0.0209 1102,1150,MC,MC, 11.2747,1.3608,0.0389,0.4263,5.3849,0.6901,0.0466,0 1103,1103,MC,MC, 12.8869,0.9554,0.2757,0.1824,5.5273,0.1234,0.0041,0.0344 ... 1201.1,1300,MC,MC, 14.9283,0.5261,0.0554,0.2481,6.541,0.3265,0.2151,0 1201.2,1100,MC,MC, 14.9561,0.1682,0.2207,0.1215,6.8117,0.0442,0,0.018 1201.3,1250,MC,MC, 12.2791,0.6878,0.0546,0.3828,6.1053,0.1963,0.022,0 ... 2206.1,70,10ha,FRAG, 14.3763,2.6924,0.3416,0.2089,6.9418,1.2055,0.2135,0 2206.4,70,10ha,FRAG, 16.5087,1.8255,0.1085,0.3462,6,6527,0.6666,0.1002,0.2574 2206.5,70,10ha,FRAG, 13.4975,1.476,0,0.1388,5.9786,0.5839,0.0073,0 ... |
File #3: LC05_BDFF_Necromass.csv
Coarse woody debris: All woody debris greater than or equal to 10 cm diameter on the forest floor or in the understory was measured in the 1999-2000 sampling campaign. Debris was sampled along 26 15-m long transects evenly arrayed across each plot. Debris was separated into two clases; rotton and sound.
Fine woody debris: Fine woody debris ( between 2.5 and 9.9 cm diameter) was estimated using the same techniques described above for coarse woody debris and 26 5 m long transects in each plot.
Snags: Standing dead trees (> or equal to 10 cm DBH) in each plot were identified in the 1999-2000 sampling campaign. Dry necromass was determined using the formulas developed by Chambers et al. 2001 with values reduced by 10% to account for the loss of leaves and fine branches (Delaney et al. 1998).
| Column | Heading | Units/format | Description |
|---|---|---|---|
| 1 | Plot | Unique identifier for each 1 ha plot (fragment number for 1 ha plots; fragment number.replicate number for plots within larger fragments or contiguous forest) | |
| 2 | Fragment_size | ha | Fragment size in hectares (ha), contiguous forest is represented by MC |
| 3 | Site | Site type: FRAG= forest fragment: MC= contiguous forest | |
| 4 | Edge_distance | m | Distance to the nearest forest edge in meters (m) |
| 5 | Log_edge_distance | m | Log base 10 transformed edge distance |
| 6 | FWD | Mg/plot | Total mass in megagrams per plot (Mg/plot) of fine woody debris in the size class defined as diameter between 2.5 and 9.9 cm |
| 7 | CWD | Mg/plot | Total mass in megagrams per plot (Mg/plot) of coarse woody debris in the size class defined as diameter >= 10cm |
| 8 | CWD_1 | Mg/plot | Total mass in megagrams per plot (Mg/plot) of coarse woody debris in the size class defined as 10-19.9 cm |
| 9 | CWD_2 | Mg/plot | Total mass in megagrams per plot (Mg/plot) of coarse woody debris in the size class defined as 20-39.9 cm |
| 10 | CWD_3 | Mg/plot | Total mass in megagrams per plot (Mg/plot) of coarse woody debris in the size class defined as 40-59.9 cm |
| 11 | CWD_4 | Mg/plot | Total mass in megagrams per plot (Mg/plot) of coarse woody debris in the size class defined as >=60 cm |
| 12 | CWD_NP | Mg/plot | Total mass in megagrams per plot (Mg/plot) of sound coarse woody debris |
| 13 | CWD_P | Mg/plot | Total mass in megagrams per plot (Mg/plot) of rotten coarse woody debris |
| 14 | Snags | Mg/plot | Total biomass in megagrams per plot (Mg/plot) of standing dead trees |
| 15 | Snag_1 | Mg/plot | Standing dead biomass in megagrams per plot (Mg/plot) for the size class defined by DBH between 10.0 and 19.9 cm |
| 16 | Snag_2 | Mg/plot | Standing dead biomass in megagrams per plot (Mg/plot) for the size class defined by DBH between 20.0 and 39.9 cm |
| 17 | Snag_3 | Mg/plot | Standing dead biomass in megagrams per plot (Mg/plot) for the size class defined by DBH greater than or equal to 40 cm |
Example data records:
| Plot,Fragment_size,Site,Edge_distance,Log_edge_distance,FWD,CWD,CWD_1,CWD_2,CWD_3,CWD_4,CWD_NP,CWD_P, Snags,Snag_1,Snag_2,Snag_3 1101,MC,MC,700,2.8,3.4,23.3,3.9,4.2,11.5,3.6,9,14.3, 9.3,0.4,0.9,7.9 1102,MC,MC,1150,3.1,2.7,28.7,9.1,13,6.6,0,7.7,21, 12.6,1.6,1.8,9.2 ... 1201.1,MC,MC,1300,3.1,1.6,29.2,6.4,12.8,10,0,12.4,16.8, 4.2,0.6,3.6,0 1201.2,MC,MC,1100,3,2.7,18.8,3.9,6.9,6.7,1.4,9.1,9.7, 6.8,1.1,1.2,4.5 ... 1501.1,MC,MC,1200,3.1,3.2,14.1,3.3,6.1,4.7,0,3.9,10.2, 8.6,3.9,4.7,0 1501.2,MC,MC,1500,3.2,4.1,21.1,7.2,3,4.5,6.4,2.3,18.8, 8.3,0.4,7.9,0 .... 3209.2,10ha,FRAG,70,1.8,4.3,35.3,3.9,10.2,12.8,8.4,20.2,15.2, 0.4,0.1,0.3,0 3209.3,10ha,FRAG,150,2.2,4.2,21.6,2.5,5.2,13.9,0,6.7,0, 8.6,2.4,6.2,0 ... 20000.1,MC,MC,53,1.7,5,21.4,4.4,8.3,5.9,2.8,5.7,0, 11.3,0.6,2,8.7 5.7,3.6,2.1,0 20000.2,MC,MC,53,1.7,3.9,25.2,6,4.9,14.3,0,14.3,0, 8.1,1.7,2.6,3.7 |
File #4: LC05_BDFF_Biomass_Fluxes.csv
Forest biomass dynamics: Three parameters were derived to estimate the rates of biomass production, mortality, and decomposition on each plot: (1) tree recruitment and growth, (2) coarse woody debris production, and (3) coarse woody debris turnover.
Additional sampling information:
Fine litter: Litter standing crop was estimated in the wet season of 2001 using 26 samples (50 x 50 cm) arrayed over each plot.
Seedlings: Seedlings (defined as stems > 50 cm height but < 1 cm DBH) were counted within 13 samples (2 x 2 m) evenly arrayed over each plot in 1999-2000. Sample count was multiplied by average seedling mass to determine biomass per area.
Stemless palms: To estimate biomass of stemless palms in each plot, 13 subquadrants (5 x 5 m) were sampled within each plot. Leaves of individual plants were classified as small (less than or equal to 2 m height), medium (between 2 and 3 m height) and large (greater than 3 m height). Number of leaves in each class was multiplied by average mass to determine biomass.
Lianas: All lianas greater than or equal to 1 cm DBH were measured at 1.3 m height between 1997 and 1999. Stems greater than or equal to 2 cm DBH were measured in the entire 1 ha plot while smaller stems were measured in the 13 5 x 5 m sub quadrants.
| Column | Heading | Units/format | Description |
|---|---|---|---|
| 1 | Plot | Unique identifier for each 1 ha plot (fragment number for 1 ha plots; fragment number.replicate number for plots within larger fragments or contiguous forest) | |
| 2 | Log_edge_distance | Log base ten of the distance to the nearest forest edge | |
| 3 | Slope | degrees | Mean plot slope in degrees based on 25 clinometer measurements in each plot |
| 4 | Mortality_rate | % | Rate of tree death in percent (%) using data from all censuses |
| 5 | Large_tree_biomass_1999 | Mg/ha | Biomass (in Mg/ha) of large trees (greater than or equal to 10 cm DBH) measured in the 1999 census |
| 6 | CWD_prod_large_trees_CN | Mg/ha | Coarse woody debris production (in Mg/year) using data from all censuses derived using the Chambers and Nelson models |
| 7 | Biomass_increase_CN | Mg/ha | Increase (in Mg/year) in biomass from recruitment and growth calculated using data from all censuses using Chambers and Nelson models |
| 8 | Wood_turnover | y-1 | Annual wood turnover rate (y-1) calculated by dividing average coarse debris production by the standing stock of coarse wood debris (the sum of coarse downed wood debris plus snags) |
| 9 | CWD | Mg/ha | Coarse woody debris standing stock in megagrams per hectare (Mg/ha) |
| 10 | FWD | Mg/ha | Fine woody debris pool in megagrams per hectare (Mg/ha) |
| 11 | Snags | Mg/ha | Biomass in megagrams per hectare (Mg/ha) of standing dead trees |
| 12 | Litter | Mg/ha | Mass in megagrams per hectare (Mg/ha) of litter (debris < 2 cm in diameter) |
| 13 | Seedling_biomass | Mg/ha | Biomass in megagrams per hectare (Mg/ha) of live seedlings (defined as stems greater than 50 cm in height but less than 1cm diameter) |
| 14 | Sapling_biomass | Mg/ha | Biomass in megagrams per hectare (Mg/ha) of live saplings (defined as diameter between 1-5 cm) |
| 15 | Small_tree_biomass | Mg/ha | Biomass in megagrams per hectare (Mg/ha) of small trees (defined as diameter between 5-10 cm) |
| 16 | Stemless_palm_biomass | Mg/ha | Biomass in megagrams per hectare (Mg/ha) of stemless palms |
| 17 | Liana_biomass | Mg/ha | Biomass in megagrams per hectare (Mg/ha) of lianas |
| 18 | Total_necromass | Mg/ha | Sum of coarse woody debris stocks, fine woody debris stocks and snags biomass in megagrams per hectare (Mg/ha) |
| 19 | CWD_snags | Mg/ha | Sum of coarse woody debris and snags in megagrams per hectare (Mg/ha) |
| 20 | Live_biomass | Mg/ha | Sum of seedling, sapling, small tree, stemless palms and liana biomasses in megagrams per hectare (Mg/ha) |
| 21 | AXIS_1 | Plot scores of nonmetric multidimensional scaling (NMDS) axis 1 based on the ordination of 50 plots and 14 attributes | |
| 22 | AXIS_2 | Plot scores of nonmetric multidimensional scaling (NMDS) axis 2 based on the ordination of 50 plots and 14 attributes | |
| 23 | AXIS_3 | Plot scores of nonmetric multidimensional scaling (NMDS) axis 3 based on the ordination of 50 plots and 14 attributes | |
| 24 | CWD_prod_large_trees_Chambers | Mg/ha | Coarse woody debris production between the latest two censuses derived using Chambers and Nelson models in megagrams per year (Mg/year) |
| 25 | Census_interval | y | Census interval in years between the latest two censuses |
| 26 | CWD_prod_large_trees_Santos | Mg/ha | Coarse woody debris production between the latest two censuses derived using Santos model in Mg/year |
| 27 | Biomass_increase_Santos | Mg/ha | Increase, in megagrams per year (Mg/year), in biomass from recruitment and growth calculated using data from all censuses using Santos model |
| 28 | Wood_turnover_Santos | y-1 | Annual rate of wood turnover (y-1) calculated using data from the last census only and derived using the Santos model |
| Missing data are represented by -9999 | |||
| Model references: Santos, 1996; Nelson et al., 1999; and Chambers et al., 2001. | |||
Example data records
|
Plot,Log_edge_distance,Slope,Mortality_rate,Large_tree_biomass_1999,CWD_prod_large_trees_CN,Biomass_increase_CN,Wood_turnover,CWD,FWD,Snags,Litter, Seedling_biomass,Sapling_biomass,Small_tree_biomass,Stemless_palm_biomass,Liana_biomass,Total_necromass,CWD_snags,Live_biomass,AXIS_1,AXIS_2,AXIS_3, CWD_prod_large_trees_Chambers, Census_interval,CWD_prod_large_trees_Santos,Biomass_increase_Santos,Wood_turnover_Santos 1101,2.8,12.6,1.2,341.7,3.6,5,0.1,23.3,3.4,9.3,7.9, 0.5,6.5,13,1.9,8,43.8,32.6,29.8,-0.7,0,-0.4, 2.3,8.3,2.4,5.3,0.1 1102,3.1,10,2.9,253.3,7.3,4.8,0.2,28.7,2.7,12.6,7.7, 0.6,6.7,13.1,1.5,4,51.8,41.3,25.9,0.1,-0.7,-0.7, 3.2,8.3,3.2,4.8,0.1 ... 1501.1,3.1,4,1.2,341.8,-9999,-9999,-9999,14.1,3.2,8.6,7.1, 0.3,6.8,13.6,1.8,7.9,33,22.7,30.5,-9999,-9999,-9999, -9999,7.9,-9999,-9999,-9999, 1501.2,3.2,15.2,1.3,346,-9999,-9999,-9999,21.1,4.1,8.3,9.9, 0.5,6.4,13.8,1,9.3,43.3,29.4,21,-9999,-9999,-9999, -9999,7.9,-9999,-9999,-9999 ... 3304.9,2.5,16.2,1.2,372.5,5.2,0.1,44.3,4.6,1.1,7.1, 0.6,7.1,13.5,1.6,5.4,57,45.4,28.2,-0.5,-0.4,0.5, 5.1,6.2,5.2,6.4,0.1 3304.1,1.7,21.9,1.4,377.6,7.3,8.8,0.2,32,3,8.9,6.6, 0.6,5.2,13.8,2.1,4.7,50.5,40.9,26.4,-0.6,-0.9,-0.2, 5.4,6.2,5.5,10.9,0.1 ... |
File #5: LC05_BDFF_Biomass_Census_Data_1980-1997.csv
Reports results from repeated surveys of aboveground biomass allowing the calculation of above-ground productivity in these plots.
| Column | Heading | Units/format | Description |
|---|---|---|---|
| 1 | Plot_number | Plot number | |
| 2 | Plot_ID | Unique identifier for each 1 ha plot (fragment number for 1 ha plots; fragment number.replicate number for plots within larger fragments or contiguous forest) | |
| 3 | Site | Site type: FRAG= forest fragment, MC= contiguous forest | |
| 4 | Census_year | YYYY | Year biomass census was taken |
| 5 | Biomass | Mg/ha | Biomass of trees greater than 10 cm DBH, in megagrams per hectare (Mg/ha), calculated using the Santos Model and diameters measured in the associated census |
| 6 | Edge_dist | m | Distance to the nearest forest-pasture edge in meters (m) |
| Missing data are represented by -9999 | |||
| Model reference: Santos, 1996. | |||
Example data records
|
Plot_number,Plot_ID,Site,Census_year,Biomass,Edge_dist 1,1101,MC,1981,342407.5,700 1,1101,MC,1987,345274.56,700 1,1101,MC,1991,353828.85,700 2,1102,MC,1981,363108.75,1150 2,1102,MC,1987,356719.84,1150 2,1102,MC,1991,271724.87,1150 3,1103,MC,1981,283681.6,1103 3,1103,MC,1987,301551.47,1103 3,1103,MC,1992,277841.79,1103 4,1104,FRAG,1981,349061.38,50 4,1104,FRAG,1988,348163.09,50 4,1104,FRAG,1991,352365.55,50 ... |
File #6: LC05_BDFF_Soil_Characteristics.csv
Soil characteristics: A total of 25 soil parameters were recorded from surface soil samples (0-20 cm depth) collected in 1997. Each 1-ha plot was divided into 25 quadrants of 20 x 20 m each. Within each plot, 9 to 13 quadrants were sampled using an alternating pattern to provide good coverage of the plot. Fifteen soil samples to 20 cm depth were collected at random locations within each quadrant then thoroughly mixed and subsampled.
| Column | Heading | Units/format | Description |
|---|---|---|---|
| 1 | Plot_ID | Unique identifier for each 1 ha plot (fragment number for 1 ha plots; fragment number.replicate number for plots within larger fragments or contiguous forest) | |
| 2 | Biomass_trees | Mg/ha | Biomass of all trees greater than 10 cm DBH in megagrams per hectare (Mg/ha) calculated using the dos Santos model and diameters measured between January 1981 and January 1987 |
| 3 | Soil_clay_fraction | % | Soil clay fraction in percent (%), defined as particles with diameter less than 0.002 mm, determined using the pipette method |
| 4 | Soil_silt_fraction | % | Soil silt fraction in percent (%), defined as particles with diameters between 0.002 and 0.05 mm, determined using the pipette method |
| 5 | Soil_fine_sand_fraction | % | Soil fine sand fraction in percent (%), defined as particles with diameters between 0.05 and 0.2 mm, determined using the pipette method |
| 6 | Soil_coarse_sand_fraction | % | Soil coarse sand fraction, defined as particles with diameters between 0.2 and 2 mm, determined using the pipette method |
| 7 | Avail_water_capacity | % | Available water capacity or maximum plant available water in percent (%) calculated as the difference between field capacity and wilting point |
| 8 | Ave_slope_plottd | degrees | Mean plot slope in degrees based on 25 clinometer measurements in each plot |
| 9 | Cu_conc | ppm | Soil copper concentration in parts per million (ppm) determined using atomic absorption spectrophotometry at CENA after digestion with HNO3, HClO4 and H2SO4 |
| 10 | Fe_ppm | ppm | Soil iron concentration in parts per million (ppm) determined using atomic absorption spectrophotometry at CENA after digestion with HNO3, HClO4 and H2SO4 |
| 11 | Zn_conc | ppm | Soil zinc concentration in parts per million (ppm) determined using atomic absorption spectrophotometry at CENA after digestion with HNO3, HClO4 and H2SO4 |
| 12 | Mn_conc | ppm | Soil manganese concentration determined using atomic absorption spectrophotometry at CENA after digestion with HNO3, HClO4 and H2SO4 |
| 13 | pH_H2O | pH of soil determined in a slurry with water | |
| 14 | Al_conc | meq/100 | Soil aluminum concentration in milliequivalents per 100 g (meq/100g) determined using atomic absorption spectrophotometry at CENA after digestion with HNO3, HClO4 and H2SO4 |
| 15 | H_conc | meq/100 | Soil hydrogen concentration in milliequivalents per 100 g (meq/100g) determined using atomic absorption spectrophotometry at CENA after digestion with HNO3, HClO4 and H2SO4 |
| 16 | Ca_conc | meq/100 | Soil calcium concentration in milliequivalents per 100 g (meq/100g) determined using atomic absorption spectrophotometry at CENA after digestion with HNO3, HClO4 and H2SO4 |
| 17 | N_total_conc | % | Soil nitrogen concentration in percent (%) determined by Kjeldhal digest |
| 18 | C_conc | % | Soil organic carbon concentration in percent (%) determined using dry combustion |
| 19 | CN_ratio | Mass based ratio of soil organic carbon to nitrogen | |
| 20 | Mg_conc | meq/100 | Soil magnesium concentration in milliequivalents per 100 g (meq/100g) determined using atomic absorption spectrophotometry at CENA after digestion with HNO3, HClO4 and H2SO4 |
| 21 | K_conc | meq/100 | Soil potassium concentration in milliequivalents per 100 g (meq/100g) determined using atomic emission spectrophotometry at CENA after digestion with HNO3, HClO4 and H2SO4 |
| 22 | PO4_conc | meq/100 | Soil phosphate concentration in milliequivalents per 100 g (meq/100g) determined on an autoanalyzer using the molybdate blue reaction |
| 23 | P_total_conc | ppm | Soil total phosphorus concentration in parts per million (ppm) determined on an autoanalyzer using the molybdate blue reaction after digest in HNO3, HCLO4 and HF |
| 24 | Na_conc | meq/100 | Soil sodium concentration in milliequivalents per 100 g (meq/100g) determined using atomic absorption spectrophotometry at CENA after digestion with HNO3, HClO4 and H2SO4 |
| 25 | S_conc | ppm | Soil sulfur concentration in parts per million (ppm) determined using atomic absorption spectrophotometry at CENA after digestion with HNO3, HClO4 and H2SO4 |
| 26 | CEC | meq/100 | Cation exchange capacity in milliequivalents per 100 g (meq/100g) calculated as the sum of K, Ca, Mg, AL and H ion concentrations |
| 27 | Al_sat | % | Aluminum saturation in percent (%) defined as ((Al conc + H conc)/CEC)* 100 |
| 28 | TEB | meq/100 | Total exchangeable bases, in milliequivalents per 100 g (meq/100g), calculated as the sum of K, Ca , Mg and Na ion concentrations |
| 29 | DpH | Delta pH determined as the difference beteen pH measured in a slurry with water and pH determined in a slurry with KCl | |
| All soil measurements are for surface soils (0- 20 cm depth) and represent the mean of 9-13 composite soil samples per plot. | |||
| Missing values are represented by -9999 | |||
Example data records
|
Plot_ID,Biomass_Trees,Soil_clay_fraction,Soil_silt_fraction,Soil_fine_sand_fraction,Soil_coarse_sand_fraction,Avail_water_capacity,Ave_slope_plot,Cu_conc, Fe_conc,Zn_conc,Mn_conc,pH_H2O,Al_conc,H_conc,Ca_conc,N_total_conc,C_conc,CN_ratio,Mg_conc,K_conc,PO4_conc,P_total_conc,Na_conc,S_conc, CEC,Al_Sat,TEB,Delta_pH 1101,355850,44.12,20.21,7.38,28.28,8.45,6.3,0.35, 130.1,2.3,2.29,4.42,1.24,0.57,0.03,0.15,1.21,8.29,0.04,0.06,0.027,128.9,-9999,-9999, 1.94,93.09,0.14,-0.315384615 1102,363106.4,47.51,18.15,8.58,25.75,6.32,11.9, 0.31,105.23,2.99,1.87,4.33,1.48,0.71,0.05,0.14,1.33,9.19,0.05,0.06,0.041,97.6,-9999, -9999,2.35,93.33,0.16,-0.293846154 ... 1301.1,325559.4,30.18,19.41,12.87,37.55,-9999,-9999, -9999,-9999,-9999,-9999,-9999,-9999,-9999,-9999,-9999,1.05,-9999,-9999,-9999,-9999,-9999,-9999, -9999,-9999,-9999,-9999,-0.38692 1301.2,349318.8,52.16,16.69,6.95,24.21,-9999,-9999, -9999,-9999,-9999,-9999,-9999,-9999,-9999,-9999,-9999,1.31,-9999,-9999,-9999,-9999,-9999,-9999, -9999,-9999,-9999,-9999,-0.25692 ... 3402.8,293357.2,63.76,31,1.24,4,-9999,1.4, -9999,-9999,-9999,-9999,-9999,-9999,-9999,-9999,-9999,1.78,-9999,-9999,-9999,-9999,-9999,-9999, -9999,-9999,-9999,-9999,0.01 3402.9,308979.5,61.7,32.49,1.39,4.413,-9999,4, -9999,-9999,-9999,-9999,-9999,-9999,-9999,-9999,-9999,1.69,-9999,-9999,-9999,-9999,-9999,-9999, -9999,-9999,-9999,-9999,-0.30083 |
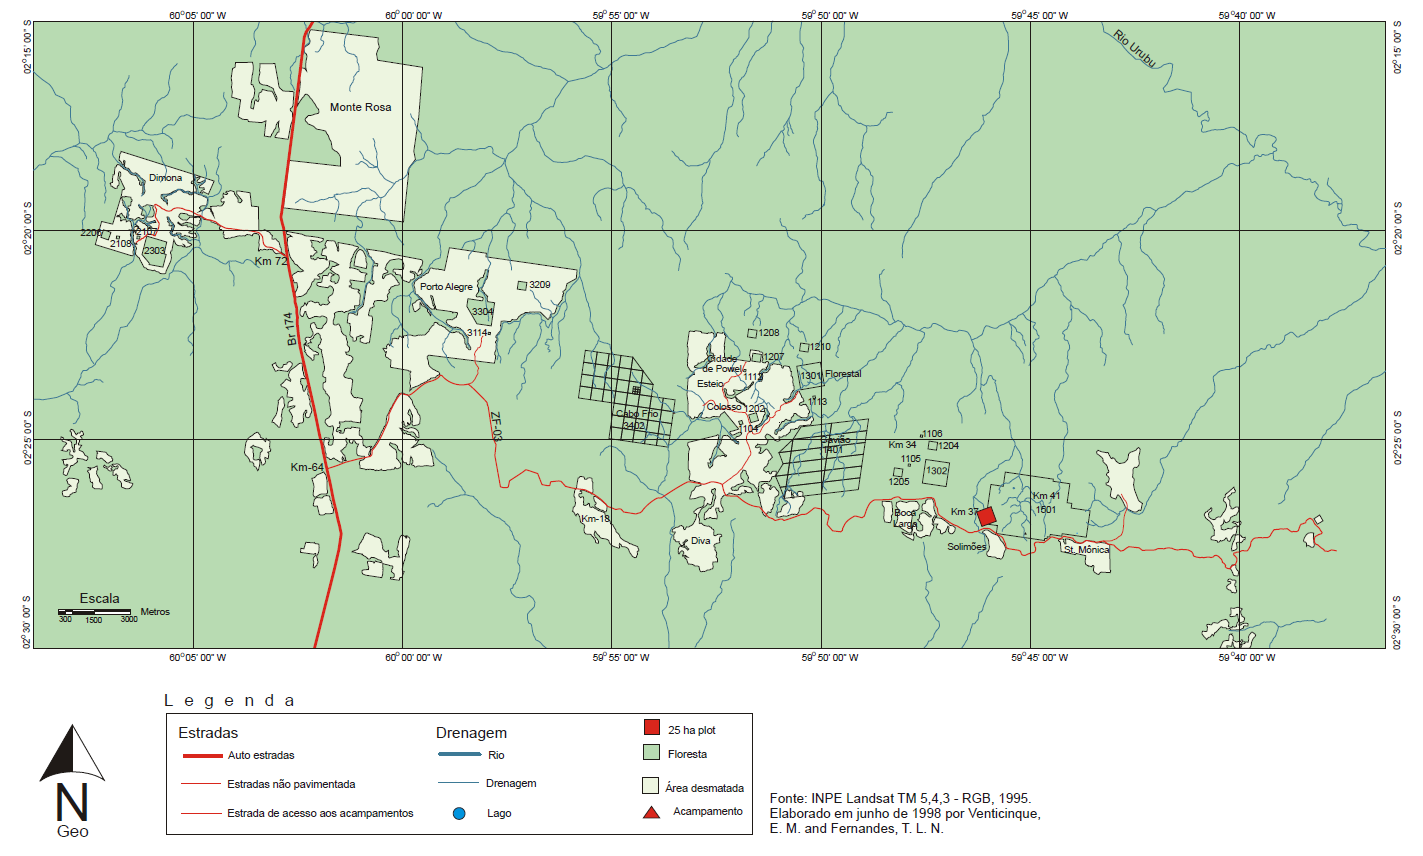
Site boundaries: (All latitude and longitude given in decimal degrees)
| Site (Region) | Westernmost Longitude | Easternmost Longitude | Northernmost Latitude | Southernmost Latitude | Geodetic Datum |
|---|---|---|---|---|---|
| Amazonas (Manaus) - ZF3 Biological Dynamics of Forest Fragments Project (BDFFP) | -60.06400 | -60.06400 | -2.33300 | -2.33300 | World Geodetic System, 1984 (WGS-84) |
Coordinates for individual plots within forest fragments and undisturbed forest were not provided. The following map shows locations of plots, roads (estrada), water features (drenegem), and forested and deforested areas (area desmatada).
Time period:
- The data set covers the period 1987/01/01 to 2001/05/05.
- Temporal Resolution: Annual
Platform/Sensor/Parameters measured include:
- FIELD INVESTIGATION / HUMAN OBSERVER / LAND PRODUCTIVITY
- FIELD INVESTIGATION / HUMAN OBSERVER / ABOVEGROUND BIOMASS
3. Data Application and Derivation:
Amazonian forests play a key role in the global carbon cycle, but there is much uncertainty about the quantity and distribution of carbon stored in these forests. Models of carbon cycling depend on accurate estimates of both biomass and necromass as well as the fluxes in and out of different ecosystem carbon pools. These data represent a subset of a larger data set that includes repeated measurements of ecosystem biomass and necromass pools in both forest fragments and contiguous forest. These data allow the calculation of rates of productivity and mortality and permit detailed analysis of the effects of forest fragmentation and patch size on key pools and processes in the carbon cycle.
4. Quality Assessment:
Not performed.
5. Data Acquisition Materials and Methods:
Study area:
This work was done in an experimentally fragmented landscape approximately 80 km north of Manaus, state of Amazonas, Brazil. The natural vegetation of the area is terra firme evergreen rain forests with high species diversity, exceeding 280 species per hectare for trees with a DBH greater than 10 cm (Oliveira and Mori 1999). The forest canopy is 30-37 m tall with emergents reaching 55 m (Laurance 2001). Rainfall ranges from 1900 to 3500 mm annually with a pronounced dry season between June and October.
In the early to mid 1980s forest fragments ranging in size from 1 to 100 hectares were isolated by distances of 70 to 1000 m from the surrounding forest by clearing and burning during the establishment of pastures on three large cattle ranches. Fragments were fenced to prevent encroachment by cattle, and reserves in the surrounding contiguous forest were delineated to serve as controls.
Sixty-nine permanent 1 ha plots were established in the early 1980s for a long term study of tree mortality, damage and growth and species composition changes. We randomly selected 50 of these plots for the present study; 30 in fragments (4 in 1 ha fragments, 4 in each of 3 10 ha fragments, and 7 in each of 2 100 ha fragments). The remaining 20 plots were located in contiguous forest control reserves that mimic the spatial arrangement of the fragment plots.
Methods:
Forest Biomass Large trees: For each 1- ha plot, biomass of trees greater than or equal to 10-cm diameter at breast height ((DBH) measured at 1.3 m or above butresses) was reported from the most recent census (1997-1999). For all species except the common pioneer species, diameter measurements were converted to biomass using an allometric model derived by destructively sampling 315 trees in a local forest (Chambers et al. 2001). Because pioneer species tend to have lower wood densities than old growth species two additional models; one for species in the Cecropiaceae family and the second for Bellucia spp., Vismia spp. and Goupia glabra were used to calculate biomass based on the work done by Nelson et al. (1999).
Small trees: In 1999-2000 the diameters of small trees (5.0 to 9.9 cm DBH) were recorded in 13 quadrants (20 x 20 m each) that were evenly arrayed over each plot. Biomass was estimated using allometric equations specific to each functional group; primary forest trees (Chambers et al. 2001), pioneer species (Nelson et al. 1999) and palms (Hughes 1997).
Saplings: In 1999-2000 the diameters of small trees (1.0 to 4.9 cm DBH) were recorded in 13 quadrants (5 x 5 m each) that were evenly arrayed over each plot. Biomass was estimated using allometric equations specific to each functional group; primary forest trees (Nascimento and Laurance 2002), pioneer species (Nelson et al. 1999) and palms (Hughes 1997).
Seedlings: Seedlings (defined as stems > 50 cm height but < 1 cm DBH) were counted within 13 samples (2 x 2 m) evenly arrayed over each plot in 1999-2000. Sample count was multiplied by average seedling mass to determine biomass per area.
Stemless palms: To estimate biomass of stemless palms in each plot, 13 subquadrants (5 x 5 m) were sampled within each plot. Leaves of individual plants were classified as small (less than or equal to 2 m height), medium (between 2 and 3 m height) and large (greater than 3 m height). Number of leaves in each class was multiplied by average mass to determine biomass.
Lianas: All lianas greater than or equal to 1 cm DBH were measured at 1.3 m height between 1997 and 1999. Diameter measurements were converted to biomass using allometric equations developed for northern Amazonia (Putz 1983). Stems greater than or equal to 2 cm DBH were measured in the entire 1 ha plot while smaller stems were measured in the 13 5 x 5 m sub quadrants.
Forest necromass coarse woody debris: All woody debris greater than or equal to 10-cm diameter on the forest floor or in the understory was measured in the 1999-2000 sampling campaign using the planar-intersect method (Van Wagner 1968, Brown 1974). Debris was sampled along 26 15-m long transects evenly arrayed across each plot. Debris was separated into two clases; rotton and sound and necromass was calculated using formulas from Brown (1974) and wood densities from Nascimento and Laurance (2002).
Fine woody debris: Fine woody debris (between 2.5 and 9.9-cm diameter) was estimated using the same techniques described above for coarse woody debris and 26 5- m long transects in each plot.
Snags: Standing dead trees (> or equal to 10 cm DBH) in each plot were identified in the 1999-2000 sampling campaign. Dry necromass was determined using the formulas developed by Chambers et al. 2001 with values reduced by 10% to account for the loss of leaves and fine branches (Delaney et al. 1998).
Fine litter: Litter standing crop was estimated in the wet season of 2001 using 26 samples (50 x 50 cm) arrayed over each plot. All material above the soil surface was removed and weighed in the field; subsamples were brought to the lab for determination of oven dry weights.
Forest biomass dynamics: Three parameters were derived to estimate the rates of biomass production, mortality and decomposition on each plot: Tree recruitment and growth, Coarse woody debris production, and Coarse woody debris turnover. Tree recruitment and growth includes the recruitment of new trees into the large tree size class (greater than or equal to 10 cm DBH.) as well as the biomass increment of the trees in the large tree class based on repeated forest surveys between the early to mid 1980s (depending on the plot) and 1999. Allometric formulas from Chambers, Nelson and dos Santos models were used to calculated biomass. Values for each plot were increased by 20 percent to compensate for major structural damage. Coarse woody debris production was determined as the production of total necromass per plot based on the data from repeated surveys and a 20 percent increase of measured values to account for necromass production from tree damage (Chambers et al. 2001). This value (measured necromass rates plus 20 percent) was then multiplied by 0.85 whcih is the estimated fraction of tree mass that is greater than or equal to 10 cm DBH in this forest (Chambers et al. 2001). Turnover of coarse woody debris was calculated by dividing the average coarse woody debris production by the standing stock of coarse woody debris ( coarse woody debris on the forest floor and understory plus the snags, cf Delaney et al. 1998).
Statistical interrelationships between the 14 biomass and necromass parameters were assessed using nonmetric multidimensional scaling (NMDS), a robust ecological ordination method with the PC ORD package (McCune and Mefford 1995).
Soil characteristics: A total of 25 soil parameters were recorded from surface soil samples (0-20 cm depth). Each 1-ha plot was divided into 25 quadrants of 20 x 20 m each. Within each plot 9 to 13 quadrants were sampled using an alternating pattern to provide good coverage of the plot. Fifteen soil samples to 20-cm depth were collected at random locations within each quadrant then thoroughly mixed and subsampled. In all cases values for the soil parameters were determined separately for quadrant then combined to yield a mean value for each plot. Soil texture was determined using the pipette method to divide soil particles into 4 size classes: clay, silt, fine sand and coarse sand. Available water capacity was estimated as the difference between field capacity (soil moisture content under a suction of 0.33 atmospheres) and wilting point (soil moisture content under a suction of 15 atmospheres). Soil pH was measured on water slurries with a pH meter. Total N was determined after a Kjeldhal digest (Parkinson and Allen 1975) while total organic C was determined by dry combustion. Phosphate concentrations were measured on an autoanalyzer using the molybdenum blue method (Jorgenson 1977) while total P was measured as phosphate using the same method after a digestion in HNO3, HClO4 and HF (Lim and Jackson 1982). Potassium was determined by atomic emission spectroscopy at the Brazilian Center for Nuclear Energy and Agriculture (CENA) at the University of Sao Paulo campus in Piracicaba SP. All other elemental concentrations (Ca, Mg, Na, S, Cu, Fe, Mn, Zn and Al) were measured by atomic absorption spectrophotometry after digestion with HClO4, HNO3 and H2SO4 (Jorgenson 1977).
6. Data Access:
This data is available through the Oak Ridge National Laboratory (ORNL) Distributed Active Archive Center (DAAC).
Data Archive Center:
Contact for Data Center Access Information:
E-mail: uso@daac.ornl.gov
Telephone: +1 (865) 241-3952
7. References:
Brown, J.K. 1974 Handbook for inventorying downed woody material.USDA Forest Service, Ogden UT USA.
Chambers, J.Q., J. Santos, R. Ribeiro and N. Niguchi. 2001. Tree damage, allometric relationships, and above-ground net primary production in central Amazon forest. Forest Ecology and Management 152:73-84.
Delaney, M., S. Brown, A.E. Lugo, A. Torres-Lezama and N.B. Quintero. 1998. The quantity and turnover of dead wood in permanent forest plots in six life zones of Venezuela. Biotropica 30:2-11
Hughes, R.F. 1997. Effects of deforestation and land use on biomass, carbon and nutrient pools in the Los Tuxtlas region, Mexico. Dissertation, Oregon State University, Corvallis OR USA.
Jordan, C, and Uhl, C. 1978. Biomass of a tierra firme forest of the Amazon Basin. Oecologia Plantarum 13, 387-400.
Jorgenson, S.S. 1977. Guia Analtico: Metodologia Utilizada para Analises Quimicas de Rotina. Centro de Energia Nuclear na Agricultura (CENA), Piracicaba SP Brazil p 24.
Laurance, W.F., Laurance, S.G., Ferreira, L.V., Rankin-de Merona, J.M., Gascon, C. And Lovejoy, T.E.1997. Biomass collapse in Amazonian forest fragments. Science 278, 1117-1118.
Laurance, W.F., Ferreira, L.V., Rankin-de Merona and Laurance, S.G. 1998. Rain forest fragmentation and the dynamics of Amazonian tree commuities, Ecology, 69, 2032-2040.
Laurance, W.F. 2001. The hyper-diverse flora of the central Amazon: an overview. Pages 47-53 in R.O. Bierregard, C Gascon, TE Lovejoy and R. Mesquita (editors) Lessons from Amazonia: ecology and conservation of a fragmented forest. Yale University Press, New Haven CT, USA.
Lovejoy, T.E., Bierregaard, R.O., Rylands, A.B., Malcolm, J.R., Quintela, C.E., Harper, L.H., Brown, K.S., Powell, A.H., Powell, G.V.N., Schubart, H.O.R. and Hays, M.B.1986. Edge and other effects of isolation on Amazon forest fragments. In: Soule, M.E. (ed.) Conservation Biology: The Science of Scarcity and Diversity. Sinauer, Sunderland MA pp 257- 285.
McCune, B. and M.J. Mefford. 1995. PC-ORD for Windows: multivariate analysis of ecological data. Version 3.04 MjM Software Glenenden Beach OR, USA.
Nascimento, H.E.M. and W.F. Laurance. 2002. Total above-ground biomass in central Amazonian rainforests: a landscape-scale study. Forest Ecology and Management 168: 311-321.
Nelson, B., R. Mesquita, J. Pereira, S. Souza, G. Batista and L. Couto. 1999. Allometric regressions for improved estimates of secondary forest biomass in the central Amazon. Forest Ecology and Management 117: 149-167.
Oliveira de, A.A. and S.A. Mori. 1999. A central Aamzonian terra firme forest. I. High tree species richness on poor soils. Biodiversity and Conservation 8: 1219-1244.
Putz, F.E. 1983. Liana biomass and leaf area of a tierra firme forest in the Rio Negro Basin, Venezuela. Biotropica 15: 185-189.
Santos, J. 1996. Analise de moelos de regressao para estimar a fitomassa de floresta tropical umida de terra-firme da Amazonia Central. Ph.D. Thesis, Universidade Federale de Vicosa, Minas Gerais Brazil.
Van Wagner, C.E. 1968. The line intersect method in forest fuel sampling, Forest Science 14: 20-26.
Related Publications
- Nascimento H.E.M. and W.F. Laurance. 2004. Biomass dynamics in Amazonian forest fragments. Ecological Applications 14(4):S127.
- Laurance, W.F., P.M. Fearnside, S.G. Laurance, P. Delamonica, T.E. Lovejoy, J. Rankin-de Merona, J.Q. Chambers, and C. Gascon. 1999. Relationship between soils and Amazon forest biomass: A landscape-scale study. Forest Ecology and Management 118(1-3):127-138.
- Laurance, W.F., L.V. Ferreira, C. Gascon, and T.E. Lovejoy. 1998. Biomass decline in Amazonian forest fragments. Science 282:26-31.