Get Data
Summary:
This data set contains topographic/geomorphological data associated with the four Intensive Study Areas (ISAs) in the Northern Ecuadorian Amazon (northern Oriente) that are part of the University of North Carolina's Carolina Population Center (CPC) Ecuador Projects study.
Study area boundaries were developed directly from 1:50,000 topographical maps. Point elevation features and 20-meter elevation contours were digitized from these same maps. Digital elevation models (DEMs) were derived from these elevation data and, in turn, terrain aspect and terrain slope were derived from the digital elevation models. Only boundary data were provided for the southwestern ISA. These data are provided in ESRI shapefile format and GeoTiff. There are six compressed (*.zip) data files with this data set.
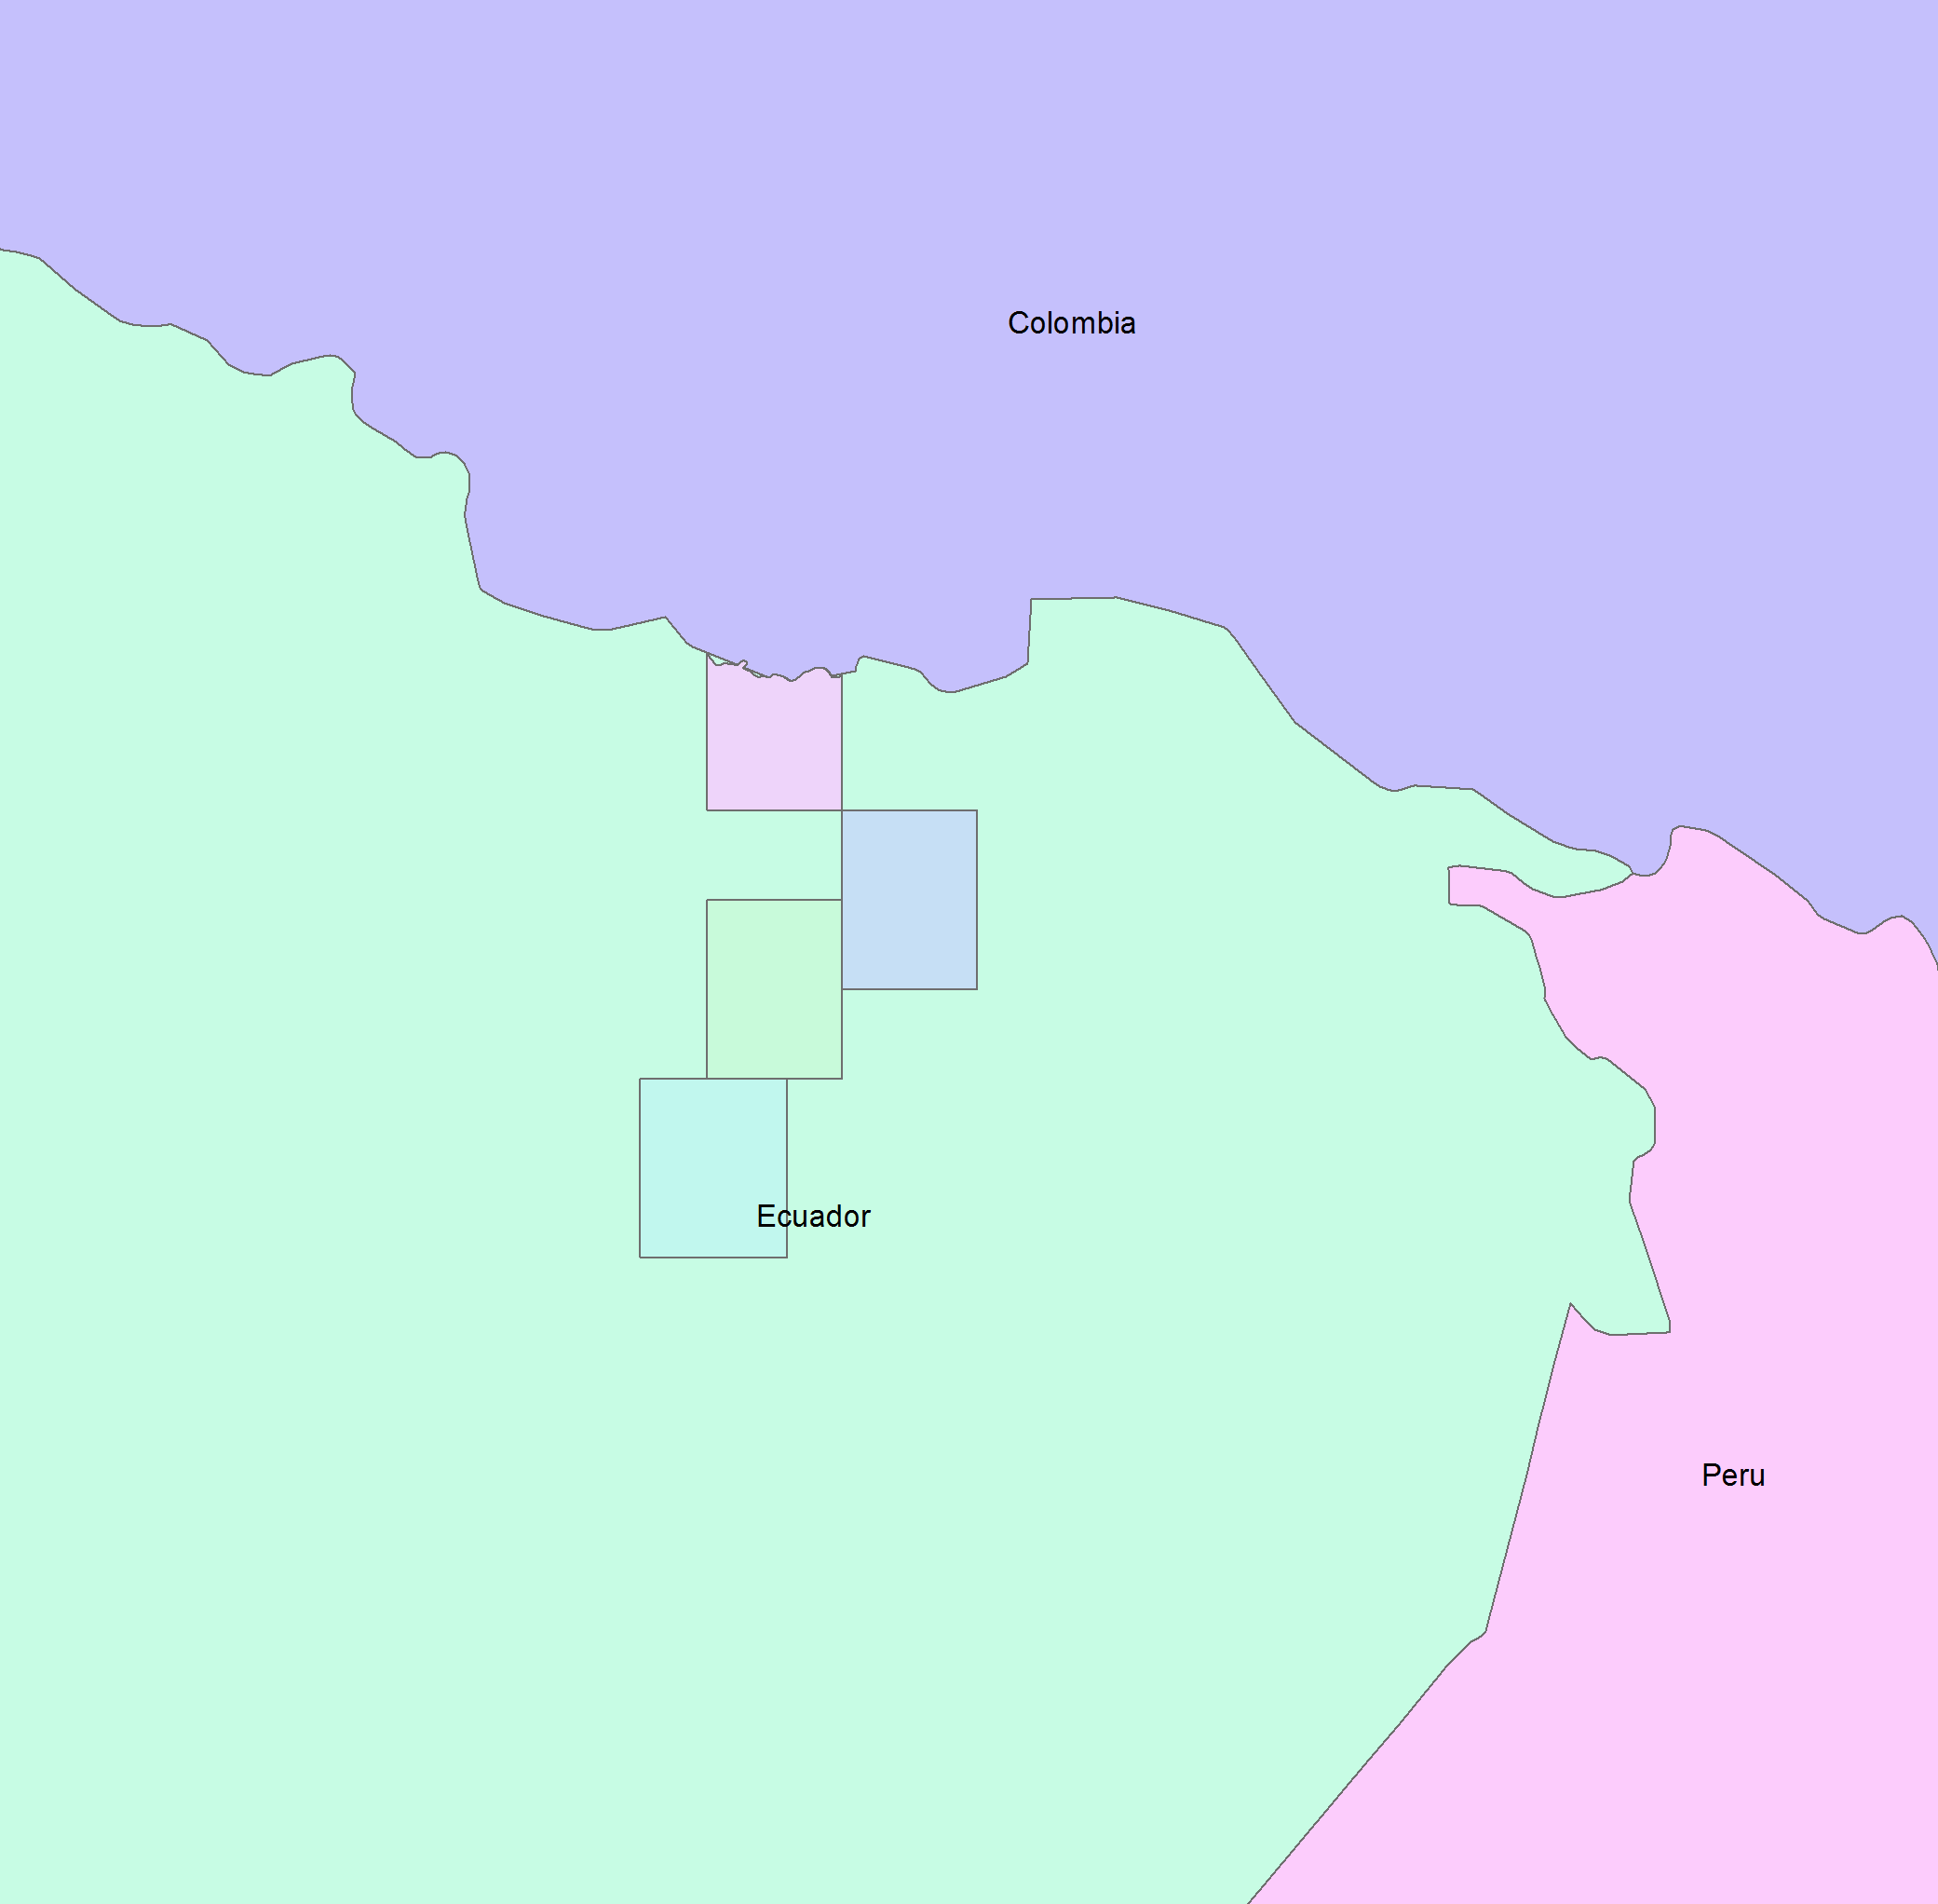
Figure 1. Intensive study areas image boundaries from the University of North Carolina's Carolina Population Center (CPC) Ecuador Projects.
Data Citation:
Cite this data set as follows:
Bilsborrow, R.E., S.J. Walsh and B.G. Frizzelle. 2012. LBA-ECO LC-01 Topographic Data for Intensive Study Areas, Northern Ecuadorian Amazon. Data set. Available on-line [http://daac.ornl.gov] from Oak Ridge National Laboratory Distributed Active Archive Center, Oak Ridge, Tennessee, U.S.A. http://dx.doi.org/10.3334/ORNLDAAC/1082
Implementation of the LBA Data and Publication Policy by Data Users:
The LBA Data and Publication Policy [http://daac.ornl.gov/LBA/lba_data_policy.html] is in effect for a period of five (5) years from the date of archiving and should be followed by data users who have obtained LBA data sets from the ORNL DAAC. Users who download LBA data in the five years after data have been archived must contact the investigators who collected the data, per provisions 6 and 7 in the Policy.
This data set was archived in May 2012. Users who download the data between May 2012 and April 2017 must comply with the LBA Data and Publication Policy.
Data users should use the Investigator contact information in this document to communicate with the data provider. Alternatively, the LBA Web Site [http://lba.inpa.gov.br/lba/] in Brazil will have current contact information.
Data users should use the Data Set Citation and other applicable references provided in this document to acknowledge use of the data.
Table of Contents:
- 1 Data Set Overview
- 2 Data Characteristics
- 3 Applications and Derivation
- 4 Quality Assessment
- 5 Acquisition Materials and Methods
- 6 Data Access
- 7 References
1. Data Set Overview:
Project: LBA (Large-Scale Biosphere-Atmosphere Experiment in the Amazon)
Activity: LBA-ECO
LBA Science Component: Human Dimensions
Team ID: LC-01 (Bilsborrow / Walsh / Garcia)
The investigators were Bilsborrow, Richard E.; Walsh, Stephen J. and McGregor, Stephen J. You may contact Walsh, Stephen J. (swalsh@email.unc.edu); Bilsborrow, Richard E. (richard_bilsborrow@unc.edu) and Frizzelle, Brian (brian_frizzelle@unc.edu).
LBA Data Set Inventory ID: LC01_Topography_Ecuador_ISA
This data set contains topographic/geomorphological data associated with the four Intensive Study Areas (ISAs) in the Northern Ecuadorian Amazon (northern Oriente) that are part of the University of North Carolina's Carolina Population Center (CPC) Ecuador Projects study.
Study area boundaries were developed directly from 1:50,000 topographical maps. Point elevation features and 20-meter elevation contours were digitized from these same maps. Digital elevation models (DEMs) were derived from these elevation data and, in turn, terrain aspect and terrain slope were derived from the digital elevation models. Only boundary data were provided for the southwestern ISA.
Related data sets (data from studies conducted in same region):
- LBA-ECO LC-01 City, Community, and Road Maps, Northern Ecuadorian Amazon: 1990-2002
- LBA-ECO LC-01 Hydrography, Morphology, Edaphology Maps, Northern Ecuadorian Amazon
- LBA-ECO LC-01 National, Provincial, and Park Boundaries, Ecuador
- LBA-ECO LC-01 Northern Ecuadorian Amazon Household Surveys, Summary Results: 1999
- LBA-ECO LC-01 SRTM 90-Meter Digital Elevation Model, Northern Ecuadorian Amazon
- LBA-ECO LC-01 Landsat TM Land Use/Land Cover, Northern Ecuadorian Amazon: 1986-1999
2. Data Characteristics:
There are six compressed (*.zip) files with this data set. The site boundaries, contours and elevation points are provided in zipped ESRI ArcGIS shapefiles. When unzipped, each shapefile contains seven files (.dbf, .prj, .sbn, .sbx, .shp, .shp.xml, .shx.). Aspect, DEM and slope data are provided in zipped GeoTiff files.
All files have the projection parameters listed below:
- Projected Coordinate System: WGS_1984_UTM_Zone_18S
- Projection: Transverse_Mercator
- False_Easting: 500000.000000
- False_Northing: 10000000.000000
- Central_Meridian: -75.000000
- Scale_Factor: 0.999600
- Latitude_of_Origin: 0.000000
- Linear_Unit: Meter
- Geographic Coordinate System: GCS_WGS_1984
- Datum: D_WGS_1984
- Prime Meridian: Greenwich
- Angular Unit: Degree
The table below indicates the files present for each attribute for the 4 ISA study areas:
| ISA | Aspect | Boundaries | Contours | DEM | Elevations | Slope |
|---|---|---|---|---|---|---|
| North | north_aspect.e00 | bnd_nisa.e00 | ctr_north.e00 | north_dem.e00 | pt_north.e00 | north_slope.e00 |
| South | south_aspect.e00 | bnd_sisa.e00 | ctr_south.e00 | south_dem.e00 | pt_south.e00 | south_slope.e00 |
| Southwest | bnd_swisa.e00 | |||||
| East | east_aspect.e00 | bnd_eisa.e00 | ctr_east.e00 | east_dem.e00 | pt_east.e00 | east_slope.e00 |
File Names
Boundaries.zip: boundary data for the 4 ISA study areas. The Southwest boundary includes the name of the study area in the NAME field.
Elevations.zip: point elevation data in meters. The elevation information is provided in the ELEV field in the attribute table.
Contours.zip: 20-meter contours in meters above sea level are provided in line shapefile format. The elevation of each contour can be found in CTRLINE field in the attribute table.
DEM.zip: DEM data consists of a sampled array of elevations interpolated from elevation contours and a sampled array of elevations for ground positions at a relatively normally spaced interval. The spatial resolution of this DEM is 30 meters, meaning that each raster pixel represents a 30 m by 30 m area on the ground, and each pixel has one elevation value, in meters above sea level.
Aspect.zip: aspect is the downslope direction of the maximum rate of change on a hillside. It is derived from a digital elevation model (DEM). Each pixel is attributed with a value that represents the compass direction, in degrees clockwise from 0 at north, in which the hillside faces. The raster resolution of the data set is based on the resolution of the source DEM (in this case, 30 meters).
Slope.zip: slope is the rate of maximum change in the elevation values from the surrounding eight pixels, through the pixel of interest. It is derived from a digital elevation model (DEM). The pixels are attributed with the slope rate of change in degrees. The range of slope values is 0 to 90, where 0 indicates perfectly flat terrain, and 90 indicates a vertical wall. The raster resolution of the data set is based on the resolution of the source DEM (in this case, 30 meters).
Site boundaries: (All latitude and longitude given in decimal degrees)
| Site (Region) | Westernmost Longitude | Easternmost Longitude | Northernmost Latitude | Southernmost Latitude | Geodetic Datum |
|---|---|---|---|---|---|
| Northern Ecuadorian Amazon- Eastern ISA (Ecuador) | -76.752607 | -76.50167 | -0.003319 | -0.33694 | World Geodetic System, 1984 (WGS-84) |
| Northern Ecuadorian Amazon- Northern ISA (Ecuador) | -77.001945 | -76.751846 | 0.288862 | -0.003319 | World Geodetic System, 1984 (WGS-84) |
| Northern Ecuadorian Amazon- Southern ISA (Ecuador) | -77.002551 | -76.75194 | -0.16972 | -0.50389 | World Geodetic System, 1984 (WGS-84) |
| Northern Ecuadorian Amazon- Southwestern ISA (Ecuador) | -77.127167 | -76.855167 | -0.503414 | -0.804885 | World Geodetic System, 1984 (WGS-84) |
Time period:
- The data set covers the period: 1993
- Temporal Resolution: not applicable, data were digitized from maps published in 1993
Platform/Sensor/Parameters measured include:
- MAPS / DIGITIZER / BOUNDARY SURVEYS
- TOPOGRAPHIC MAP / DIGITIZER / TOPOGRAPHICAL RELIEF
3. Data Application and Derivation:
Typical application of data:
The ISA boundary data set may be used for cartographic representation of the study areas on maps, as a reference for clipping larger data sets, and as a physical limit for selected analyses.
The elevations and contours shapefiles can be used in conjunction to derive a DEM. Tthese data should not be used alone to create a DEM, as the accuracy would be very poor. The derived DEM can be used for any analyses that require an elevational component, for example to calculate slope or potential wetness index values, or for simple three-dimensional representation of the ISA.
The terrain aspect GeoTiff can be used for any analyses that require a directional terrain component, or for simple three-dimensional representation of the ISA.
Derivation of data:
ISA boundaries:
Four 1:50,000 topographic maps were identified as containing the ISA. The ISA extent was selected to be the full north-south extent, and to lie centered between the east and west extents of the four topographic maps.
The latitude coordinates were taken from the four corners of the four-topo group. The longitude coordinates were recorded as the coordinates lying at the central east-west point on each topo map. The latitude/longitude coordinates were converted to UTM, Zone 18 South projection. The four UTM coordinates were used to generate a boundary polygon for the ISA.
Contour vectors:
Elevation contours were digitized and attributed from topographic maps. The two contour coverages were edge-matched and appended.
DEMs:
The elevation contour data and the point elevation data were used to generate the DEM in ARC/INFO. The TOPOGRID command was used. The contour data were the primary basis for the interpolation, with the point elevations enhancing the quality of the interpolation. An ISA subset of the 1:50,000 hydrography data was used to make the DEM hydrologically correct. A 60-meter margin was applied to the process to allow TOPOGRID to better interpolate the pixels on the boundaries of the ISA. A tolerance of 10 meters was applied to the process to assist in the smoothing
of the surface and the removal of sinks in the drainage enforcement process. This value was chosen as half of the contour interval.
Terrain aspect:
The directional aspect values assigned to the pixels in the data set were generated with the ASPECT algorithm in ARC/INFO, which calculates the direction of greatest elevational change based on surrounding pixels. Aspect values are derived solely from DEM data.
Terrain slope data:
The SLOPE command in ARC/INFO was used to derive terrain slope. For each pixel, SLOPE takes the values of the eight surrounding pixels, fits a plane to the 3x3 pixel array, and calculates the rate of maximum elevational change along the slope. That rate value is assigned to the central pixel. Slope values are derived solely from the DEM data.
4. Quality Assessment:
Data usage guidance:
Boundaries: There are no usage constraints.
Contour vectors: There are no use constraints. However, potential users should
be aware of possible ramifications of using the contours to create a DEM of too fine
a resolution, given the interval of the contours. Horizontal accuracy is assumed
to be within the NMAS standards for a map of this scale.
DEMs: There are no use constraints. However, potential users should be aware
that the resolution of this data set makes it inappropriate for any analyses where
the scale of analysis is finer than 30 meters. An accuracy assessment of the elevation
values has not been performed.
Point elevations: Attribution was based on the elevations assigned to points
on the source map. There is 100% agreement for attribution between each digitized
point and its source point. Accuracy of the attribution is dependent solely on the
accuracy of the data source.
Terrain aspect: An accuracy assessment of the aspect values has not been performed.
Terrain slope: An accuracy assessment of the slope values has not been performed.
5. Data Acquisition Materials and Methods:
Site description
The ISA study area in the northeastern Ecuadorian Amazon measures approximately 90,000 ha in size and is spatially and functionally linked to the regional capital and largest central place within the Oriente, Lago Agrio
(Messina and Walsh, 2001). The northeastern Ecuadorian Amazon is significant from social, biophysical, and geographical bases,
with complex terrain and LULC variability. Settlers in the Napo and Sucumbios provinces, the two dominant Cantons or States, settled on 50
ha plots, clearing primary forest to grow subsistence crops, coffee, and for pasturage. The western Amazon region, bordering the Andes and lying at the headwaters of the Amazon River basin, possesses several major centers of endemism, including the Napo. The annual precipitation is high (2,800 mm/year), so there is no distinct dry season. Despite the region's global biodiversity and carbon sequestration significance, agricultural settlement and concurrent deforestation threaten the region.
Study areas:
The four intensive study areas in the northern Ecuadorian Amazon included the Northern Intensive Study Area (NISA), which includes the area around Lago Agrio; the Southern Intensive Study Area (SISA), which includes the area around La Joya de los Sachas; the Eastern Intensive Study Area (EISA), which includes the area around Shushufindi; and the Southwestern Intensive Study Area (SWISA), which includes the area around Coca.
Data for ISA boundaries, contour vectors, DEMs and point elevations were all derived from 1: 50,000 topographic maps. Maps for the sites were published in 1993 and obtained from the Instituto Geografico Militar de Ecuador (IGM) in 1999.
Individual maps used in generating the data for each ISA include: NISA: General Farfan, Nueva Loja EISA: Pacayacu, Shushufindi SISA: La Joya de los Sachas, San Francisco de Orellana
Terrain aspect: aspect data are derived from DEMs. The DEMs were developed by interpolating elevation contours and point elevations digitized from 1:50,000 scale source maps.
Terrain slope: the ISA DEMs were used to generate the slope surface. The SLOPE command in ARC/INFO was used. For each pixel, SLOPE takes the values of the eight surrounding pixels, fits a plane to the 3x3 pixel array, and calculates the rate of maximum elevational change along the slope. That rate value is assigned to the central pixel.
6. Data Access:
This data is available through the Oak Ridge National Laboratory (ORNL) Distributed Active Archive Center (DAAC).
Data Archive Center:
Contact for Data Center Access Information:
E-mail: uso@daac.ornl.gov
Telephone: +1 (865) 241-3952
7. References:
Messina J.P. and S.J. Walsh. 2001. 2.5D Morphogenesis: modeling landuse and landcover dynamics in the Ecuadorian Amazon. Plant Ecology 156(1):75-88.
Related Publications
- Pan, W.K.Y., S.J. Walsh, R.E. Bilsborrow, B.G. Frizzelle, C.M. Erlien, and F. Baquero. 2004. Farm-level models of spatial patterns of land use and land cover dynamics in the Ecuadorian Amazon. Agriculture Ecosystems & Environment 101(2-3):117-134.