Summary:
This data set provides mean leaf area index (LAI), dendrometry band measurements, and litterfall mass from samples collected at the km 67 research site, Tapajos National Forest, Para, Brazil. Litterfall collections were from January 23, 2004 through December 3, 2004, dendrometer measurements were monthly between December 2003 and December 2004, and LAI measurements were collected from January 26, 2004 through November 3, 2004.
All measurements were taken at the km 67 site in the Tapajos National Forest. This site is situated in an area of Amazonian primary tropical forest belonging to the municipality of Belterra, Para, Brazil. The forest is mostly evergreen with a few deciduous species. The canopy is characterized by large emergent trees up to 55-m tall, with a closed canopy at approximately 40-m; there are few indications of recent anthropogenic disturbance other than hunting trails. Measurement plots (50) were established along 4 transects at the site and within each plot, 5 subplots were established. The longest transect (25 m x 500 m) was the location of 20 (25 m x 25 m) plots. The other 3 transects (25 m x 250 m) contain 10 plots per transect. Note that the assignment of plots to transects is not provided.
There are four comma-delimited data files (.csv) with this data set.
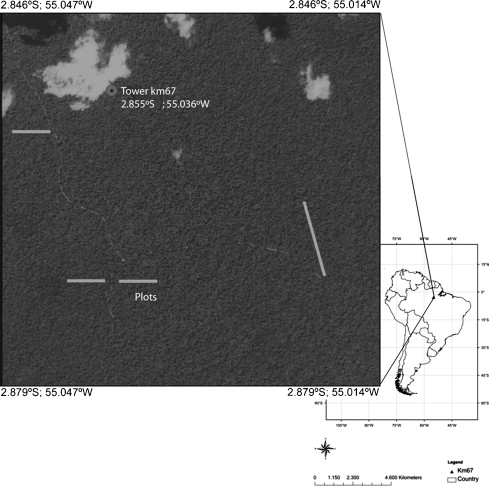
Fig. 1. Location of the study area (plots) in Tapajo´ s National Forest, Belterra, State of Para, Brazil. This is an Ikonos image showing the layout of 4 transects. The longest transect (25 m x 500 m) shows the location of 20 (25 m x 25 m) plots. The other 3 transects (25 m x 250 m) contain 10 plots per transect. Each plot has 5 subplots (not shown). From Malhado et al., 2009.
Data Citation:
Cite this data set as follows:
Costa, M.H. and W. Cohen. 2013. LBA-ECO CD-15 LAI and Productivity Data, km 67, Tapajos National Forest: 2003-2004. Data set. Available on-line [http://daac.ornl.gov] from Oak Ridge National Laboratory Distributed Active Archive Center, Oak Ridge, Tennessee, U.S.A. http://dx.doi.org/10.3334/ORNLDAAC/1167
Implementation of the LBA Data and Publication Policy by Data Users:
The LBA Data and Publication Policy [http://daac.ornl.gov/LBA/lba_data_policy.html] is in effect for a period of five (5) years from the date of archiving and should be followed by data users who have obtained LBA data sets from the ORNL DAAC. Users who download LBA data in the five years after data have been archived must contact the investigators who collected the data, per provisions 6 and 7 in the Policy.
This data set was archived in June 2013. Users who download the data between June 2013 and May 2018 must comply with the LBA Data and Publication Policy.
Data users should use the investigator contact information in this document to communicate with the data provider.
Data users should use the Data Set Citation and other applicable references provided in this document to acknowledge use of the data.
Table of Contents:
- 1 Data Set Overview
- 2 Data Characteristics
- 3 Applications and Derivation
- 4 Quality Assessment
- 5 Acquisition Materials and Methods
- 6 Data Access
- 7 References
1. Data Set Overview:
Project: LBA (Large-Scale Biosphere-Atmosphere Experiment in the Amazon)
Activity: LBA-ECO
LBA Science Component: Carbon Dynamics
Team ID: CD-15 (Cohen / Costa)
The investigators were Cohen, Warren B.; Costa, Marcos Heil; Ahl, Douglas Eric; Andrade, Ricardo Guimaraes; Budney, John Walter; Castleton, Dulce; Figueiredo, Daniel Nunes; Gower, Stith Tom; Kennedy, Robert E.; Maiersperger, Thomas Krueger; Portilho, Kleber da Costa; Ritts, Dave; Senna, Monica Carneiro Alves; Filho, Jose Danilo Souza and Turner, David P. You may contact Cohen, Warren B. (warren.cohen@orst.edu) and Costa, Marcos Heil (mhcosta@ufv.br).
LBA Data Set Inventory ID: CD15_Productivity
This data set provides mean leaf area index (LAI), dendrometry band measurements, and litterfall mass from samples collected at the km 67 research site, Topajos National Forest, Para, Brazil. Litterfall collections were from January 23, 2004 through December 3, 2004, dendrometer measurements were monthly between December 2003 and December 2004, and LAI measurements were collected from January 26, 2004 through November 3, 2004.
All measurements were taken at the km 67 site in the Tapajos National Forest. This site is situated in an area of Amazonian primary tropical forest belonging to the municipality of Belterra, Para, Brazil. The forest is mostly evergreen with a few deciduous species. The canopy is characterized by large emergent trees up to 55-m tall, with a closed canopy at approximately 40-m; there are few indications of recent anthropogenic disturbance other than hunting trails. Measurement plots (50) were established along 4 transects at the site and within each plot, 5 subplots were established. The longest transect (25 m x 500 m) was the location of 20 (25 m x 25 m) plots. The other 3 transects (25 m x 250 m) contain 10 plots per transect. Note that the assignment of plots to transects is not provided.
2. Data Characteristics:
Data are presented in four comma-separated ASCII files:
File 1: CD15_Litterfall_2003_2004.csv
File 2: CD15_LAI_2004.csv
File 3: CD15_Dendrometer_measurements_2003_2004.csv
File 4: CD15_dendrometry_dates.csv
File 1. CD15_Litterfall_2004.csv. Measurements were made from January 23, 2004 through December 3, 2004.
| Column | Variable | Units/format | Description |
|---|---|---|---|
| 1 | Sample_date | YYYYMMDD | Sample Date |
| 2 | Plot | Plot identification: each 25 x 25 m plot was given a unique identification number: 1-50 | |
| 3 | Subplot | Subplot identification: each plot was divided into 5 subplots | |
| 4 | Mass_litterfall | g | Weight of dry leaves in grams (g) per litter basket: each litter basket had a surface area of 0.25 meters squared |
Example data records:
|
Sample_date,Plot,Subplot,Mass_litterfall 20040123,1,1,6.8 20040223,1,1,5.6 ... 20040426,26,2,6.8 20040524,26,2,3.7 ... 20041126,50,5,7.2 20041203,50,5,8.1 |
File 2. CD15_LAI_2004.csv. Measurements were made from January 26, 2004 through November 3, 2004.
| Column | Variable | Units/format | Description |
|---|---|---|---|
| 1 | Plot | Plot identification: each 25 x 25 m plot was given a unique identification number: 1-50 | |
| 2 | Year | YYYY | Year of sampling |
| 3 | Month | MMM | Month in which measurements were made |
| 4 | Day | dd | Day of the month on which measurements were made |
| 5 | N | Number of point measurements (one per subplot) used in plot average | |
| 6 | LAI | m2 per m2 | Mean leaf area index measured with a LI-COR LAI 2000 and reported in meters squared per meter squared |
| 7 | lai_se | m2 per m2 | Standard error of the leaf area index reported in meter squared per meter squared |
| 8 | fpar | Mean fraction of absorbed photosythetic active radiation (fpar) calculated using the 'difn' output from the LAI 2000 | |
| 8 | fpar_se | Standard error of the mean fpar value |
Example data records:
|
Plot,Year,Month,Day,N,LAI,lai_se,fpar,fpar_se 1,2004,JAN,26,5,6.53,0.21,0.99,0 2,2004,JAN,26,5,6.27,0.14,1,0 ... 50,2004,MAY,24,5,5.306,0.229,0.988,0.002 1,2004,JUN,25,5,6.448,0.199,0.994,0.002 ... 49,2004,NOV,3,5,5.362,0.533,0.97,0.01 50,2004,NOV,3,5,5.526,0.415,0.986,0.003 |
File #3: CD15_Dendrometer_measurements_2003_2004.csv. Measurements were made from December 2003 through November 2004.
| Column | Variable | Units/format | Description |
|---|---|---|---|
| 1 | Plot | Plot identification: each 25 x 25 m plot was given a unique identification number | |
| 2 | Subplot | Subplot identification: each plot was divided into 5 subplots | |
| 3 | Tree_no | Tree identification | |
| 4 | Diameter | cm | Diameter at breast height at the beginning of the study |
| 5 | Band_122003 | mm | Dendrometer band measurement in December 2003 reported in millimeters (mm) |
| 6 | Band_012004 | mm | Dendrometer band measurement in January 2004 reported in millimeters (mm) |
| 7 | Band_022004 | mm | Dendrometer band measurement in February 2004 reported in millimeters (mm) |
| 8 | Band_032004 | mm | Dendrometer band measurement in March 2004 reported in millimeters (mm) |
| 9 | Band_042004 | mm | Dendrometer band measurement in April 2004 reported in millimeters (mm) |
| 10 | Band_052004 | mm | Dendrometer band measurement in May 2004 reported in millimeters (mm) |
| 11 | Band_062004 | mm | Dendrometer band measurement in June 2004 reported in millimeters (mm) |
| 12 | Band_072004 | mm | Dendrometer band measurement in July 2004 reported in millimeters (mm) |
| 13 | Band_082004 | mm | Dendrometer band measurement in August 2004 reported in millimeters (mm) |
| 14 | Band_102004 | mm | Dendrometer band measurement in October 2004 reported in millimeters (mm) |
| 15 | Band_112004 | mm | Dendrometer band measurement in November 2004 reported in millimeters (mm) file |
| 16 | Band_final | mm | Final dendrometer band measurement done on November 30 or December 1 or December 3 2004 reported in millimeters (mm) |
| 17 | Comments | Notations from the field notebooks | |
| missing data are represented by -9999 | |||
Example data records:
|
Plot,Subplot,Tree_no,Diameter ,Band_122003,Band_012004,Band_022004,Band_032004, Band_042004,Band_052004,Band_062004,Band_072004,Band_082004,Band_102004,Band_112004,Band_final,Comments 1,1,1,80.5,-9999,37.2,-9999,-9999, -9999,-9999,-9999,-9999,-9999,-9999,-9999,48.4,ladder 1,1,2,63.9,11.6,12.3,12.2,12.4, 12.7,12.5,12.5,10.2,12.7,12.6,12.7,13.2,-9999 ... 25,2,636,-9999,-9999,-9999,-9999,-9999, -9999,-9999,-9999,-9999,-9999,-9999,-9999,-9999,-9999 25,3,640,23.1,20.4,20.7,21.1,20.4, 21.4,21.4,21.3,21.3,21.5,21.5,22.2,20,-9999 ... 50,5,783,18.6,33.5,32.2,34.2,33.3, 34.8,34.8,35.9,35.9,36.2,37,35.2,35.8,-9999 50,5,784,51.2,-9999,37,44.1,48.5, 53.7,56.8,59.2,59.3,60.4,64.9,70,78.7,-9999 |
File 4: CD15_dendrometry_dates.csv
This file contains the dates the dendrometry measurements reported in file 3, CD15_Dendrometer_measurements_2003_2004.csv, were taken in each plot, for measurements one through 11, and the final measurement date (YYYYMMDD).
Example data records:
|
Plot,First_measurement_date,Second_measurement_date,Third_measurement_date,Fourth_measurement_date, Fifth_measurement_date,Sixth_measurement_date,Seventh_measurement_date,Eighth_measurement_date, Ninth_measurement_date,Tenth_measurement_date,Eleventh_measurement_date,Final_measurement_date 1,20031210,20040126,20040226, 20040323,20040427,20040525,20040626, 20040726,20040825,20041004,20041103,20041130 2,20031210,20040126,20040226, 20040323,20040427,20040525,20040626, 20040726,20040825,20041004,20041103,20041130 ... 49,20031222,20040127,20040226, 20040323,20040427,20040524,20040626, 20040726,20040826,20040906,20041101,20041130 50,20031222,20040127,20040226, 20040323,20040427,20040524,20040626, 20040726,20040826,20040906,20041101,20041130 |
Site boundaries: (All latitude and longitude given in decimal degrees)
| Site (Region) | Westernmost Longitude | Easternmost Longitude | Northernmost Latitude | Southernmost Latitude | Geodetic Datum |
|---|---|---|---|---|---|
| Para Western (Santarem) - km 67 Primary Forest Tower Site (Para Western (Santarem)) | -54.95900 | -54.95900 | -2.85700 | -2.85700 | World Geodetic System, 1984 (WGS-84) |
Time period:
- The data set covers the period 2003/12/10 to 2004/12/03.
- Temporal Resolution: Dendrometers were recorded monthly between December 2003 and November 2004.
Platform/Sensor/Parameters measured include:
- FIELD INVESTIGATION / WEIGHING BALANCE / BIOMASS
- FIELD INVESTIGATION / STEEL MEASURING TAPE / BIOMASS
- FIELD INVESTIGATION / DENDROMETERS / BIOMASS
- FIELD INVESTIGATION / LICOR PLANT CANOPY ANALYZER / CANOPY CHARACTERISTICS
3. Data Application and Derivation:
These data were collected as part of the Bigfoot Project which used field data and eddy flux meaurements to validate remote sensing estimates of gross and net primary productivity across a number of biomes.
4. Quality Assessment:
Dendrometer Data:
Concerns about dendrometer data are noted in the data file (e.g. band ruptured or replaced).
Important Quaity Note:
- The tree species and size classes determined during a 2001 reconnaissance trip are unavailable.
5. Data Acquisition Materials and Methods:
Site Description:
All measurements were taken at the km 67 site in the Tapajos National Forest. This site is situated in an area of Amazonian primary tropical forest belonging to the municipality of Belterra, Para state, Brazil. The forest is mostly evergreen with a few deciduous species. The canopy is characterized by large emergent trees up to 55-m tall, with a closed canopy at approximately 40-m; there are few indications of recent anthropogenic disturbance other than hunting trails.
- Abundant tree species include the tauari (Couratari guianensis),matamata (Eschweilera sp.), massaranduba (Manilkara huberi), andiroba (Carapa guianensis), tachi (Sclerolobium paniculatum), abiu (Pouteria sp.), breu (Protium decandro), and louro (Licaria guianensis).
- Soils are nutrient-poor clay oxisols with low organic content. The monthly incident photosynthetically active radiation (PAR) values vary from 640 to 850 mmol per m2 per s (Senna et al., 2005).
- The annual mean precipitation is 1911 mm, the mean temperature is 25 degrees C, and the dry season extends from July to November (Juarez et al., 2009).
50 plots were established along 4 transects at the site and within each plot, 5 subplots were established. The longest transect (25 m x 500 m) was the location of 20 (25 m x 25 m) plots. The other 3 transects (25 m x 250 m) contain 10 plots per transect. Note that the assignment of plots to transects is not provided. See Figure 1.
Litterfall:Litterfall was collected in 250 litter baskets (0.25 m2 surface area each) installed in each subplot and collected every month. The leaves were separated, dried in an oven for 24 h, and then weighed. Branches, fruits and seeds were discarded. The exact date of each collection is recorded in the data file. Samples were collected from January 23, 2004 through December 3, 2004.
LAI Measurements:
LAI measurements were made monthly from samples in the 25 x 25-m plots using three LAI-2000 Plant Canopy Analysers (Li-Cor, 1992). This technique is referred to as the indirect non-contact method and represents the projected area of leaves taking into account individual leaf inclinations (Scurlock et al., 2001). One of the instruments was installed on the top of a tower to measure the diffuse radiation on the top of the canopy, while the other two measured diffuse radiation at about 1-m high. The Plant Canopy Analyser measures diffuse radiation with a light sensor, in the 320 to 490 nm range where the radiation scattering by leaves is minimal. LI-COR software was used to determine the canopy transmittance and the LAI (m2 leaf area per m2 ground area) per subplot using an instrument specific formulation. The fraction of photosynthetically active radiation (fPAR) was estimated from the DIFN variable provided by the Li-Cor LAI-2000 Plant Canopy Analyzer (Gower et al., 1999). LAI data are included from January 26 through November 3, 2004.
Dendrometry Measurements:
Dendrometer measurments were made in 25 x 25-m plots and subplots. Woody biomass increment was determined from radial growth, measured using rust-resistant dendrometer bands (Walker and Whiteaker, 1988) to measure annual diameter growth. Dendrometer measurements were read monthly between December 2003 and November 2004. Actual dates for each reading are included in file 4, CD15_dendrometry_dates.csv.
Important Quality Note:
- The tree species and size classes determined during a 2001 reconnaissance trip are unavailable.
6. Data Access:
This data is available through the Oak Ridge National Laboratory (ORNL) Distributed Active Archive Center (DAAC).
Data Archive Center:
Contact for Data Center Access Information:
E-mail: uso@daac.ornl.gov
Telephone: +1 (865) 241-3952
7. References:
Gower, S.T., Kucharik, C.J., and J.M. Norman. 1999. Direct and indirect estimation of leaf area index, fAPAR and net primary production of terrestrial ecosystems. Remote Sensing of Environment 70:29-51.
Juarez, R.I.N., Rocha, H.R., Figueira, A.M.S., Goulden, M.L., Miller, S.D., 2009. An improved estimate of leaf area index based on the histogram analysis of hemispherical photographs. Agricultural and Forest Meteorology 149, 920-928.
Malhado, Ana C.M., Marcos H. Costa, Francisca Z. de Lima, Kleber C. Portilho, and Daniel N. Figueiredo. 2009. Seasonal leaf dynamics in an Amazonian tropical forest. Forest Ecology and Management, Volume 258, Issue 7, Pages 1161-1165, 10.1016/j.foreco.2009.06.002
Scurlock, J.M.O., Asner, G.P., Gower, S.T. 2001. Global Leaf Area Index Data from Field Measurements, 1932-2000. Available online [http://daac.ornl.gov/] from the ORNL Distributed Active Archive Center, Oak Ridge National Laboratory, Oak Ridge, Tennessee, U.S.A.
Senna, M.C.A., Costa, M.H., Shimabukuro, Y.E., 2005. Fraction of photosynthetically active radiation absorbed by Amazon tropical forest: a comparison of field measurements, modeling, and remote sensing. Journal of Geophysical Research 110, G01008.
Walker, L. R., and L. D. Whiteaker. 1988. Rust prevention on dendrometer bands. Biotropica 20:336-337.