Get Data
Summary:
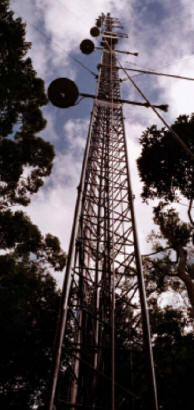
This data set contains a single text file which reports temperature measurements at the Pará Western (Santarém) - km 67, Primary Forest Tower Site. This site is in the Tapajos National Forest located in north central Brazil. Measurements extend from January 2002 through January 2006 (Figure 1).
Air temperature measurements were collected at 8 levels on the tower (61.9, 49.8, 39.1, 28.4, 18.3, 10.1, 2.8, and 0.6 m). Temperature measurements were made with aspirated thermistors (Met One 076B-4 aspiration with YSI 44032 thermistors) and averaged over a 1 hour interval.
Co-located measurements included a Licor gas analyzer that measured (a) the CO2 and H2O concentration profiles at 8 levels in and above the canopy (1 level every 2 minutes), (b) the instantaneous integrated canopy storage of CO2 and H2O, using a design that pulled air simultaneously through all 8 inlets (once every 20 minutes), and (c) eddy fluxes of CO2 and H2O were measured at two levels (58m and 47m) using tower-mounted closed-path Licor 6262 gas analyzers and Campbell CSAT3 sonic anemometers. A comprehensive set of meteorological parameters (air pressure, PAR, net radiation, precipitation, etc) were also measured. See related data sets.
With the permission of the author, Hutyra, L.R. 2007. Carbon and water exchange in Amazonian rainforests. Ph.D. Thesis, Department of Earth and Planetary Sciences, Harvard University, Cambridge, Massachusetts., is included as a companion file.
Data Citation:
Cite this data set as follows:
Hutyra, L. R., J. W. Munger, E. W. Gottlieb, B. C. Daube, P. B. Camargo and S. C. Wofsy. 2008. LBA-ECO CD-10 Temperature Profiles at km 67 Tower Site, Tapajos National Forest. Data set. Available on-line [http://daac.ornl.gov] from Oak Ridge National Laboratory Distributed Active Archive Center, Oak Ridge, Tennessee, U.S.A. doi:10.3334/ORNLDAAC/863
Implementation of the LBA Data and Publication Policy by Data Users:
The LBA Data and Publication Policy [http://daac.ornl.gov/LBA/lba_data_policy.html] is in effect for a period of five (5) years from the date of archiving and should be followed by data users who have obtained LBA data sets from the ORNL DAAC. Users who download LBA data in the five years after data have been archived must contact the investigators who collected the data, per provisions 6 and 7 in the Policy.
This data set was archived in May of 2008. Users who download the data between May 2008 and April 2013 must comply with the LBA Data and Publication Policy.
Data users should use the Investigator contact information in this document to communicate with the data provider. Alternatively, the LBA Web Site [http://lba.inpa.gov.br/lba/] in Brazil will have current contact information.
Data users should use the Data Set Citation and other applicable references provided in this document to acknowledge use of the data.
Table of Contents:
- 1 Data Set Overview
- 2 Data Characteristics
- 3 Applications and Derivation
- 4 Quality Assessment
- 5 Acquisition Materials and Methods
- 6 Data Access
- 7 References
1. Data Set Overview:
Project: LBA (Large-Scale Biosphere-Atmosphere Experiment in the Amazon)
Activity: LBA-ECO
LBA Science Component: Carbon Dynamics
Team ID: CD-10 (Wofsy / Kirchhoff)
The investigators were Munger, J. William; Daube, Bruce C.; Wofsy, Steven C.; Saleska, Scott R. and Hutyra, Lucy . You may contact Saleska, Scott Reid (saleska@email.arizona.edu) ; Wofsy, Steven C (scw@io.harvard.edu) ; Hutyra, Lucy (lrhutyra@u.washington.edu) and Gottlieb, Elaine W. (gottlieb@deas.harvard.edu)
LBA Data Set Inventory ID: CD10_Temperature_Profiles_Tapajos
Temperature profiles at the km67 flux tower sites, Tapajos National Forest, Santarem, Para, Brazil. Measurements extend from January 2002 - January 2006.
These data may be updated or reprocessed from time to time, and it is the user's responsibility to insure that you have the most recent version of the data. For the latest version, please see the following web site: Harvard University, LBA Web Page (http://atmos.seas.harvard.edu/lab/data/lbadata.html)
Related Data Sets:
LBA-ECO CD-10 H2O Profiles at km 67 Tower Site, Tapajos National Forest
LBA-ECO CD-10 CO2 Profiles at km 67 Tower Site, Tapajos National Forest
LBA-ECO CD-10 CO2 and H2O Eddy Fluxes at km 67 Tower Site, Tapajos National Forest
2. Data Characteristics:
The temperature profile data are reported in one comma separated ASCII text file, km67_temp_profile_2002_2006.txt .
Data File Documentation:
|
column
variable description 1 "JDstart(GMT)" decimal day (GMT, continuous from 1/1/00) NOTE 1: Tapajos Forest Local time (LT) = GMT - 4 hours NOTE 2: these times are time at the BEGINNING of the hour-long data aggregation interval, i.e., data at 12:00 are from aggregating measurements between 12:00 and 13:00 2 "T.C.filled.57.8m" filled temperature estimate for 57.8m (degrees C) 3 "T.C.57.8m.est" unfilled temperature estimate for 57.8m based on measurements at 61.94 and 49.75 m (degrees C) 4 "T.C.61.94m" measured temperature at 61.94m (degrees C) 5 "T.C.49.75m" measured temperature at 49.75m (degrees C) 6 "T.C.39.11m" measured temperature at 39.11m (degrees C) 7 "T.C.28.41m" measured temperature at 28.41m (degrees C) 8 "T.C.18.27m" measured temperature at 18.27m (degrees C) 9 "T.C.10.12m" measured temperature at 10.12m (degrees C) 10 "T.C.3.05m" measured temperature at 3.05m (degrees C) 11 "T.C.0.61m" measured temperature at 0.61m (degrees C) Missing value code is "NA" Values are comma separated |
Sample Data Record:
All of the temperature profile data are reported in km67_temp_profile_2002_2006.txt . The file has been gzippped to reduce file size.
|
JDstart(GMT),T.C.filled.57.8m,T.C.57.8m.est,T.C.61.94m,T.C.49.75m,T.C.39.11m,T.C.28.41m, T.C.18.27m,T.C.10.12m,T.C.3.05m,T.C.0.61m 733.75, 29.0789636, 29.0789636, 29.161, 28.92, 29.493, 29.8875, 29.888, 30.052, 29.502, 29.118 733.791666666667, 27.9061862, 27.9061862, 27.9775, 27.768, 28.372, 28.7155, 28.7155, 28.9645, 28.792, 28.6965 733.833333333333, 28.3374836, 28.3374836, 28.4025, 28.2115, 28.6965, 28.964, 28.926, 29.0985, 28.6965, 28.4485 733.875, 28.1601144, 28.1601144, 28.267, 27.953, 28.068, 28.2965, 28.2395, 28.354, 28.03, 27.878 733.916666666667, 28.1023748, 28.1023748, 28.277, 27.764, 27.074, 26.8385, 26.801, 26.8385, 26.8195, 26.8765 733.958333333333, 27.7337442, 27.7337442, 28.011, 27.1965, 25.937, 25.788, 25.8065, 25.975, 25.975, 26.087 |
Site boundaries: (All latitude and longitude given in degrees and fractions)
| Site (Region) | Westernmost Longitude | Easternmost Longitude | Northernmost Latitude | Southernmost Latitude | Geodetic Datum |
|---|---|---|---|---|---|
| Para Western (Santarem) - km 67 Primary Forest Tower Site (Para Western (Santarem)) | -54.959 | -54.959 | -2.857 | -2.857 | World Geodetic System, 1984 (WGS-84) |
Time period:
- The data set covers the period 2002/01/01 to 2006/01/18.
- Temporal Resolution: 1 hour
Platform/Sensor/Parameters measured include:
- TOWER / THERMISTOR / TEMPERATURE PROFILES
- TOWER / THERMISTOR / AIR TEMPERATURE
3. Data Application and Derivation:
Temperature profile measurements
4. Quality Assessment:
This data set can be considered final, but as always with data sets this large there are occasional individual points that are bad, but which for one reason or another, have not yet been removed.
5. Data Acquisition Materials and Methods:
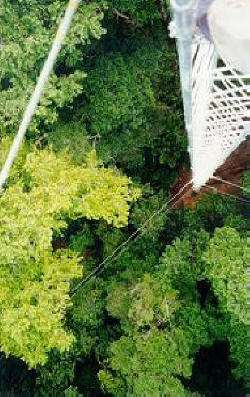
A 64 m tower (Rohn 55G, Peoria, IL) was instrumented for vertical profiles ofair temperature, CO2 and H2O concentrations, and eddy covariance measurements which commenced in April, 2001 and continued until the tower was destroyed when a falling tree hit the guy wires in January 2006.
Air temperature measurements were collected at 8 levels on the tower (61.9, 49.8, 39.1, 28.4, 18.3, 10.1, 2.8, and 0.6 m). Temperature measurements were made with aspirated thermistors (Met One 076B-4 aspiration with YSI 44032 thermistors) and averaged over a 1 hour interval.
Vertical profiles of CO2 and H2O concentrations were measured at 8 levels on the tower (62.2, 50, 39.4, 28.7, 19.6, 10.4, and 0.91 m). Sample air was drawn at 1000 sccm through the 8 profile inlets in sequence (2 minutes at each level). The profile concentration data were used to estimate the change in vertical average concentration between the ground and flux measurement height in order to calculate the column average storage of CO2. The profile IRGA was zeroed between each profile sequence and an absolute calibration at 325, 400, and 475 ppm was made every 6 or 12 hours, as for the eddy CO2 measurements.
A suite of environmental measurements was also made on the tower. Dataloggers (CR-10X, Campbell Scientific, Logan, UT), controlled the overall operation of the system. The data were downloaded via coaxial cable to a computer, housed in a climate controlled hut near the tower.
Sensors used include:
- THERMISTOR
6. Data Access:
This data is available through the Oak Ridge National Laboratory (ORNL) Distributed Active Archive Center (DAAC).
Data Archive Center:
Contact for Data Center Access Information:
E-mail: uso@daac.ornl.gov
Telephone: +1 (865) 241-3952
7. References:
Hutyra, L.R. 2007. Carbon and water exchange in Amazonian rainforests. Ph.D. Thesis, Department of Earth and Planetary Sciences, Harvard University, Cambridge, Massachusetts. With the kind permission of the author, this document is included as a companion file with this data set.
Hutyra, L. R., J. W. Munger, S. R. Saleska, E. Gottlieb, B. C. Daube, A. L. Dunn, D. F. Amaral, P. B. de Camargo, and S. C. Wofsy. 2007. Seasonal controls on the exchange of carbon and water in an Amazonian rain forest, J. Geophys. Res., 112, G03008, doi:10.1029/2006JG000365.
Saleska, S.R., Miller, S.D.,Matross, D.M., Goulden, M.L., Wofsy, S.C., da Rocha,H., de Camargo, P.B., Crill, P., Daube, B.C., de Freitas, H.C., Hutyra, L., Keller, M., Kirchhoff, V., Menton, M., Munger, J.W., Pyle, E.H., Rice, A.H, and Silva, H. 2003. Carbon fluxes in old-growth Amazonian rainforest: seasonality and disturbance-induced net carbon loss, Science, 302, 1554-1557.
Hutyra, L.R., Munger, J.W., Nobre, C.A., Saleska, S.R., Vieira, S.A., and Wofsy, S.C. 2005. Climatic variability and vegetation vulnerability in Amazonia, Geophysical Research Letters, 32, L24712.
Related Publications
- Saleska, S.R., S.D. Miller, D.M. Matross, M.L. Goulden, S.C. WOFSY, H.R. da Rocha, P.B. de Camargo, P. Crill, B.C. Daube, H.C. de Freitas, L. Hutyra, M. Keller, V. Kirchhoff, M. Menton, J.W. Munger, E.H. Pyle, A.H. Rice, and H. Silva (2003). Carbon in amazon forests: Unexpected seasonal fluxes and disturbance-induced losses. Science, Vol. 302, No. 5650, pp. 1554-1557.
- Xiao, X.M., Q.Y. Zhang, S. Saleska, L. Hutyra, P. De Camargo, S. Wofsy, S. Frolking, S. Boles, M. Keller, and B. Moore. (2005) Satellite-based modeling of gross primary production in a seasonally moist tropical evergreen forest. Remote Sensing of Environment 94(1):105-122.
- Hutyra, L.R., Munger, J.W., Nobre, C.A., Saleska, S.R., Vieira, S.A., Wofsy, S.C., Climatic variability and vegetation vulnerability in Amazonia, Geophysical Research Letters, 32, L24712, 2005.
- Huete, A.R., Didan, K., Shimabukuro, Y.E., Ratana, P., Saleska, S., Hutyra, L.R., Yang, W., Nemani, R.R. and Myneni, R. Amazon rainforests green-up with sunlight in dry season, Geophysical Research Letters, 33, L06405, 2006.
- Ichii, K., Hashimoto, H., White, M.A., Potter, C., Hutyra, L.R., Huete, A.R., Myneni, R.B., Nemani, R.R., Constraining rooting depths in tropical rainforests using satellite data and ecosystem modeling for accurate simulation of GPP seasonality, Global Change Biology, 13, 67-77, 2007.
- Hutyra, L.R., Munger, J.W., Gottlieb, E.W., Daube, B.C., Camargo, P.B., Wofsy, S.C., Controls on energy and carbon exchange in an evergreen tropical rainforest., submitted to Journal of Geophysical Research, Biogeosciences.