Get Data
Summary:
This data set contains a single comma seperated text file (*.csv) of half-hourly average CO mixing ratios measured from2001/04/18 to 2003/08/29 in the old-growth upland forest at the Pará Western (Santarém) - km 67, Primary Forest Tower Site. This site is in the Tapajos National Forest located in north central Brazil.
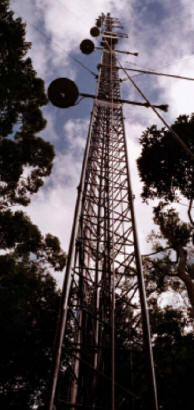
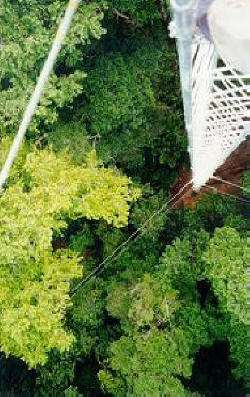
CO concentrations were measured in air drawn from above the canopytop of tower (approx. 64 meters) using a TEI 48CTL instrument modified for increased stability and sensitivity. The sensor was frequently zeroed by passing ambient air over a CO oxidation catalyst. The span was checked 4 times daily by sampling calibration gases at 100 and 500 ppb. Time in the file is given in UTC (decimal date) at the start of each half hour interval (Boian et al., 2006).
Associated meteorological parameters, CO2 concentrations and micrometerological fluxes are available in LBA-ECO CD-10 CO2
and H2O Eddy Flux Data at km 67 Tower Site, Tapajos National Forest.
Data Citation:
Cite this data set as follows:
Boian, C., V. W. J. H. Kirchhoff, J. W. Munger, S. R. Saleska, S. C. Wofsy. 2008. LBA-ECO CD-10 CO Concentrations at km 67 Tower Site, Tapajos National Forest. Data set. Available on-line [http://daac.ornl.gov] from Oak Ridge National Laboratory Distributed Active Archive Center, Oak Ridge, Tennessee, U.S.A. doi:10.3334/ORNLDAAC/856
Implementation of the LBA Data and Publication Policy by Data Users:
The LBA Data and Publication Policy [http://daac.ornl.gov/LBA/lba_data_policy.html] is in effect for a period of five (5) years from the date of archiving and should be followed by data users who have obtained LBA data sets from the ORNL DAAC. Users who download LBA data in the five years after data have been archived must contact the investigators who collected the data, per provisions 6 and 7 in the Policy.
This data set was archived in May of 2008. Users who download the data between May 2008 and April 2013 must comply with the LBA Data and Publication Policy.
Data users should use the Investigator contact information in this document to communicate with the data provider. Alternatively, the LBA Web Site [http://lba.inpa.gov.br/lba/] in Brazil will have current contact information.
Data users should use the Data Set Citation and other applicable references provided in this document to acknowledge use of the data.
Table of Contents:
- 1 Data Set Overview
- 2 Data Characteristics
- 3 Applications and Derivation
- 4 Quality Assessment
- 5 Acquisition Materials and Methods
- 6 Data Access
- 7 References
1. Data Set Overview:
Project: LBA (Large-Scale Biosphere-Atmosphere Experiment in the Amazon)
Activity: LBA-ECO
LBA Science Component: Carbon Dynamics
Team ID: CD-10 (Wofsy / Kirchhoff / Camargo)
The investigators were Wofsy, Steven C.; Camargo, Plinio B. de ; Kirchhoff, Volker W. J. H.; Artaxo, Paulo; Bright, Alfram V. H.; Budney, John Walter; Daube, Bruce C.; Hutyra, Lucy; Munger, James William and Saleska, Scott Reid . You may contact Munger, J. William (jwm@io.harvard.edu)
LBA Data Set Inventory ID: CD10_CO_Tapajos
This data set contains half-hourly average CO mixing ratios measured at the km67 eddy flux tower site in the Tapajos Forest near Santarem.
These data may be updated or reprocessed from time to time, and it is the user's responsibility to insure that you have the most recent version of the data. For the latest version, please see the following web site: Harvard University, LBA Web Page (http://atmos.seas.harvard.edu/lab/data/lbadata.html)
Related Data Sets:
LBA-ECO CD-10 CO2 and H2O Eddy Fluxes at km 67 Tower Site, Tapajos National Forest
LBA-ECO CD-10 H2O Profiles at km 67 Tower Site, Tapajos National Forest
2. Data Characteristics:
Data are provided in a comma delimited ASCII file: CO_km67_0103_30m.csv
Data File Description:
| Column | Heading | Description | |
|---|---|---|---|
| 1 | Cum_Date | Cumulative date (UTC, decimal) starts from January 1, 2001 - 2003 | |
| 2 | Date | Day of year (UTC, decimal) starts from January 1, 2001 | |
| 3 | CO | Half-hourly average concentration(ppb) | |
| 4 | Std_Dev | Standard deviation of half-hourly concentration(ppb) | |
| Date/time in the file is given in UTC at the start of each half hour interval. | |||
| Missing values are represented as -999. | |||
Sample Data Records:
Prepared by Bill Munger (jwm@io.harvard.edu),,, Last revised 6 March 2007,,, Missing or rejected data reported as -999,,, "Day of year (UTC, decimal) starts from January 1, 2001",,, Half-hourly average CO concentrations in ppb,,, Cum_Date,Date,CO,Std_Dev 108.5833,108.5833,-999,-999 108.6042,108.6042,85.9,3.3 108.625,108.625,86,3.3 108.6458,108.6458,87.4,2.9 ... 971.604,241.604,115.1,6.48 971.625,241.625,124.4,9.09 971.646,241.646,127.4,7.84 971.667,241.667,122.1,8.75 |
Site boundaries: (All latitude and longitude given in degrees and fractions)
| Site (Region) | Westernmost Longitude | Easternmost Longitude | Northernmost Latitude | Southernmost Latitude | Geodetic Datum |
|---|---|---|---|---|---|
| Para Western (Santarem) - km 67 Primary Forest Tower Site (Para Western (Santarem)) | -54.959 | -54.959 | -2.857 | -2.857 | World Geodetic System, 1984 (WGS-84) |
Time period:
- The data set covers the period 2001/04/18 to 2003/08/29.
- Temporal Resolution: 30 minute
Platform/Sensor/Parameters measured include:
- TOWER / IRGA (INFRARED GAS ANALYZER) / CARBON MONOXIDE
3. Data Application and Derivation:
This data set contains half-hourly average CO mixing ratios measured at the km67 eddy flux tower site in the Tapajos Forest near Santarem.
4. Quality Assessment:
Detection Limits
Based on 2 times thestandard deviation of the mean of zero measurements, the minimum detection limit is on theorder of 10 ppb.
Resolution/Precision
Based on the standard deviations of the means of replicate sample and calibration gas measurmements,the minimum resolution is 10 ppb or better.
5. Data Acquisition Materials and Methods:
Thermo Environmental Instruments model 48CTL analyzer inlet is located above the forest canopy at top of tower.
Measurements
The CO concentration data was determined using gas-filter-correlation IR absorption on a Thermo-Environmental Instruments 48CTL. Ambient air was dried by condensing water vapor at 2 deg C. Background instrument zero signal was determined every 15 minutes by removing CO from ambient air using a Sofnocat oxidizing catalyst. Instrument gain was determined by calibration with standards at about 100 ppb and 500 ppb CO.
Processing Steps
Raw data were initially separated into ambient sample, zero, low calibration, and high calibration, and transitional. Transitional data representing data immediately after switching modes were not used. 1-minute averages were computed for the zero, calibration and ambient signals. Zeros were subtracted from ambient and calibration signals to generatedifference signals. The two calibration values were used to construct a mean calibration curve, which was then used to convert the ambient signals to concentration. 1-minute average ambient concentrations were then further averaged to the half-hourly reported values.
Sensors used include:
- IRGA (INFRARED GAS ANALYZER)
6. Data Access:
This data is available through the Oak Ridge National Laboratory (ORNL) Distributed Active Archive Center (DAAC) or the EOS Data Gateway.
Data Archive Center:
Contact for Data Center Access Information:
E-mail: uso@daac.ornl.gov
Telephone: +1 (865) 241-3952
7. References:
Saleska, S. R., S. D. Miller, D. M. Matross, M. L. Goulden, S. C. Wofsy, H. R. da Rocha, P. B. de Camargo, P. Crill, B. C. Daube, H. C. de Freitas, L. Hutyra, M. Keller, V. Kirchhoff, M. Menton, J. W. Munger, E. H. Pyle, A. H. Rice, H. Silva, (2003) Carbon in Amazon forests: unexpected seasonal fluxes and disturbance-induced losses, Science, 302, 1554.
Boian, C., V.W.J.H. Kirchhoff, W. Munger, S.R. Saleska, S.C. Wofsy (2006) Very High CO Mixing Ratios at a Primary Forest Site, Revista Brasileira de Meteorologia, 21, 20-28.
Related Publications
- Boian, C., V.W.J.H. Kirchhoff, W. Munger, S.R. Saleska, S.C. Wofsy (2006) Very High CO Mixing Ratios at a Primary Forest Site, Revista Brasileira de Meteorologia, 21, 20-28.
- Saleska, S.R., S.D. Miller, D.M. Matross, M.L. Goulden, S.C. Wofsy, H.R. da Rocha, P.B. de Camargo, P. Crill, B.C. Daube, H.C. de Freitas, L. Hutyra, M. Keller, V. Kirchhoff, M. Menton, J.W. Munger, E.H. Pyle, A.H. Rice, and H. Silva. 2003. Carbon in amazon forests: Unexpected seasonal fluxes and disturbance-induced losses. Science 302(5650):1554-1557.