Get Data
Summary:
This data set reports the results of soil and vegetation surveys at four distinct areas within the Tapajos National Forest (TNF), 50 to 100 km south of Santarem, Para, Brazil, in November 1999. At 13 individual sites across the four areas, all located in primary forest, core soil samples at 10, 30 and 50 cm depths were collected and analyzed for dry mass, bulk density, texture, percentage carbon (C), percentage organic matter, and percentage nitrogen (N). At these 13 sites, vegetation was characterized along 250 m long by 10 m wide transects. Biomass was estimated for all stems over 10 cm DBH from allometric relationships for species, measured height, canopy dimension, and diameter. LAI was measured along the transect at 26 points with a LICOR LAI-2000. Canopy foliage samples were collected with a shotgun at dawn and leaf water potential was determined with a pressure chamber. Samples of foliage, wood, bark, fine roots, and litter were analyzed for %N, %C, delta 13C, and delta 15N. There are five comma-delimited ASCII data files with this data set.
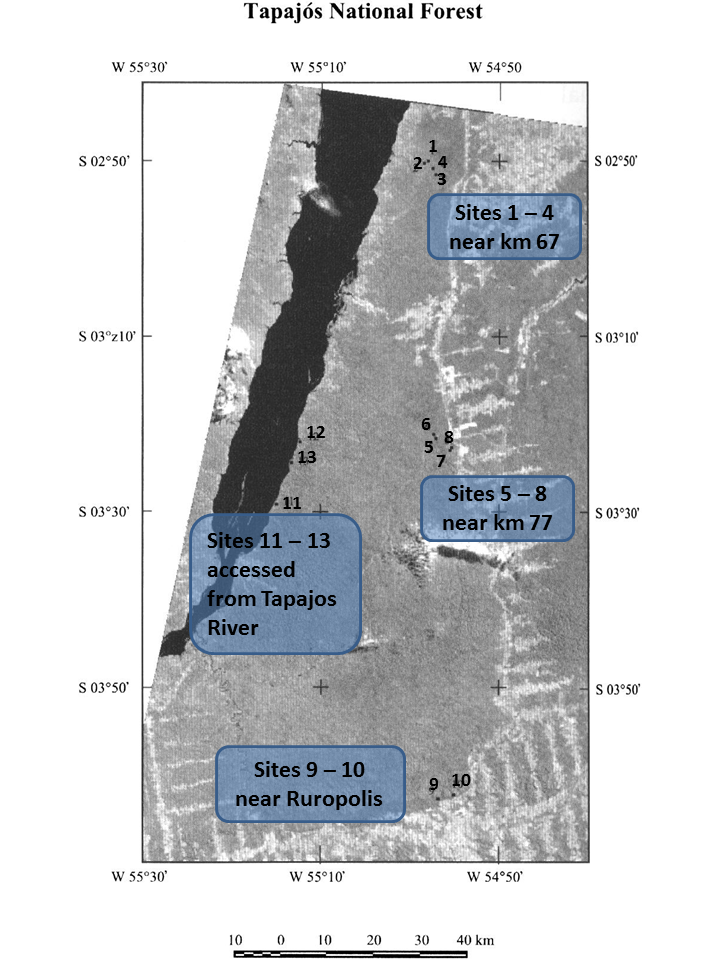
Figure 1. The location of the 13 study sites within the Tapajos National Forest in Para state, Brazil. Locations are marked on a Thematic Mapper/Landsatim age, path 227, row 062, 10 secs dislocated south, from 2 August, 1999, 30-m resolution. A color composition of bands 5(R), 4(G), 3(B) has been converted to gray scales. Note the Tapajos River in black along the western edge of the forest and the BR 163 road marking the eastern boundary. Clouds obscure some parts of the image.
Data Citation:
Cite this data set as follows:
Williams, M., Y.E. Shimabokuro and E.B. Rastetter. 2012. LBA-ECO CD-09 Soil and Vegetation Characteristics, Tapajos National Forest, Brazil. Data set. Available on-line [http://daac.ornl.gov] from Oak Ridge National Laboratory Distributed Active Archive Center, Oak Ridge, Tennessee, U.S.A. http://dx.doi.org/10.3334/ORNLDAAC/1104
Implementation of the LBA Data and Publication Policy by Data Users:
The LBA Data and Publication Policy [http://daac.ornl.gov/LBA/lba_data_policy.html] is in effect for a period of five (5) years from the date of archiving and should be followed by data users who have obtained LBA data sets from the ORNL DAAC. Users who download LBA data in the five years after data have been archived must contact the investigators who collected the data, per provisions 6 and 7 in the Policy.
This data set was archived in July of 2012. Users who download the data between July 2012 and June 2017 must comply with the LBA Data and Publication Policy.
Data users should use the Investigator contact information in this document to communicate with the data provider. Alternatively, the LBA website [http://lba.inpa.gov.br/lba/] in Brazil will have current contact information.
Data users should use the Data Set Citation and other applicable references provided in this document to acknowledge use of the data.
Table of Contents:
- 1 Data Set Overview
- 2 Data Characteristics
- 3 Applications and Derivation
- 4 Quality Assessment
- 5 Acquisition Materials and Methods
- 6 Data Access
- 7 References
1. Data Set Overview:
Project: LBA (Large-Scale Biosphere-Atmosphere Experiment in the Amazon)
Activity: LBA-ECO
LBA Science Component: Carbon Dynamics
Team ID: CD-09 (Williams / Shimabukuro)
The investigators were Williams, Mathew; Rastetter, Edward B.; Shimabukuro, Yosio Edemir and Herbert, Darrell Anthony . You may contact Williams, Mathew (mat.williams@ed.ac.uk)
LBA Data Set Inventory ID: CD09_Soils_Vegetation_Tapojos
This data set reports the results of soil and vegetation surveys at four distinct areas within the Tapajos National Forest (TNF), 50 to 100 km south of Santarem, Para, Brazil, in November 1999. At 13 individual sites across the four areas, all located in primary forest, core soil samples at 10, 30 and 50 cm depths were collected and analyzed for dry mass, bulk density, texture, percentage carbon (C), percentage organic matter, and percentage nitrogen (N). At these 13 sites, vegetation was characterized along 250 m long by 10 m wide transects. Biomass was estimated for all stems over 10 cm DBH from allometric relationships for species, measured height, canopy dimension, and diameter. LAI was measured along the transect at 26 points with a LICOR LAI-2000. Canopy foliage samples were collected with a shotgun at dawn and leaf water potential was determined with a pressure chamber. Samples of foliage, wood, bark, fine roots, and litter were analyzed for %N, %C, delta 13C, and delta 15N.
2. Data Characteristics:
There are 5 comma-delimited data files with this data set:
File 1: CD09_Soil_texture_C_and_N_TNF.csv
File 2: CD09_Biomass_inventory_TNF.csv
File 3: CD09_LAI_TNF.csv
File 4: CD09_Leaf_Water_Potential_TNF.csv
File 5: CD09_Vegetation_CN_TNF
File 1: CD09_Soil_texture_C_and_N_TNF.csv
| Column | Heading | Units/format | Description |
|---|---|---|---|
| 1 | Plot_ID | Sampling plot identification number: sampling plots 10 meters wide and 250 meters long were established at each location | |
| 2 | Subplot_ID | Subplot identification number: each plot was divided into 5 subplots | |
| 3 | Depth | cm | Sample depth |
| 4 | Wt_wet | g | Fresh weight of first soil sample in grams |
| 5 | Wt_dry | g | Weight in grams of soil sample after being dried in an oven at 105 degrees C |
| 6 | Bulk_density | g per cm3 | Soil bulk density in grams per cubic centimeter |
| 7 | GWC | percent | Gravimetric water content in percent of wet weight |
| 8 | C_conc | percent | Soil carbon concentration in percent by weight analyzed at EMBRAPA in Belem |
| 9 | SOM_conc | percent | Soil organic matter concentration in percent by weight analyzed at EMBRAPA in Belem |
| 10 | N_conc | percent | Soil nitrogen concentration in percent by weight analyzed at EMBRAPA in Belem |
| 11 | CN_ratio | Mass based soil carbon to nitrogen ratio | |
| 12 | Coarse_sand | percent | Percent of soil particles classified as coarse sand |
| 13 | Fine_sand | percent | Percent of soil particles classified as fine sand |
| 14 | Silt | percent | Percent of soil particles classified as silt |
| 15 | Clay | percent | Percent of soil particles classified as clay |
| Missing data are represented as -9999 | |||
Example data records
|
Plot_ID,Subplot_ID,Depth,Wt_wet,Wt_dry,Bulk_density,GWC,C_conc,SOM_conc,N_conc,CN_ratio,Coarse_sand,Fine_sand,Silt,Clay 1,1,3,65.08,48.97,0.57,24.75,5.99,10.31,0.44,13.6,5,1,12,82 1,8,104.94,1.21,5.27,0.97,1.67,0.06,16.2,54,27,5,14 ... 13,3,30,104.84,97.46,1.13,7.04,0.81,1.4,0.06,13.5,50,26,10,14 13,3,50,122.4,111.02,1.29,9.3,0.52,0.89,0.05,10.4,48,24,12,16 |
File 2: CD09_Biomass_inventory_TNF.csv
| Column | Heading | Units/format | Description |
|---|---|---|---|
| 1 | Sample_date | yyyymmdd | Sampling date (yyyymmdd) |
| 2 | Sample_year | yyyy | Sample year |
| 3 | Sample_month | mm | Sample month |
| 4 | Sample_day | dd | Sample day |
| 5 | Site | At each site (1-13), a sampling plot was established along a transect 250 m long and 10 m wide | |
| 6 | Subplot | Subplot identification number (1-5): each sampling plot was divided into 5 subplots 50 m long | |
| 7 | L/R | Left (L) or right (R) of the transect line | |
| 8 | Tree_no | Tree identification number | |
| 9 | Species | Identification of species with the local name | |
| 10 | dbh | cm | Diameter at breast height measured in centimeters (cm) |
| 11 | Height | m | Tree height estimated in meters |
| 12 | X | m | Distance along main plot axis in meters. Measurement is reset to zero at the boundary of each subplot |
| 13 | Y | m | Distance to left or right (see column 3) of the main axis |
| 14 | Canopy_x | m | Canopy dimension along the direction of the plot main axis |
| 15 | Canopy_y | m | Canopy dimension perpendicular to the direction of the plot main axis |
| 16 | Notes | Notations from the field notebooks | |
| 17 | Basal_area | cm2 | Basal area of stem calculated in centimeters squared |
| 18 | Biomass_INPE | kg | Biomass of the stem in kilograms calculated using the INPE allometric equations |
| 19 | Biomass_Laurance | kg | Biomass of the stem in kilograms calculated using the Laurance allometric equations |
| Missing values are indicated as -9999 | |||
Example data records
|
Sample_date,Sample_year,Sample_month,Sample_day,Site,Subplot,L/R,Tree_no,Species,dbh,Height, X,Y,Canopy_x,Canopy_y,Notes,Basal_area,Biomass_INPE,Biomass_Laurance 19991111,1999,11,11,1,1,L,1,BREU,17.7,17, 3.95,4.8,7.3,6.4,1,246.1,179.5,236.8 19991111,1999,11,11,1,1,R,2,UCHILISO,23.9,22, 4.1,4.9,7.4,8.8,2,448.6,406.5,495.1 ... 19991117,1999,11,17,6,1,L,3,ENVIRA PRETA,16.9,16, 14,3.5,5,4.9,111,224.3,155.2,211.3 19991117,1999,11,17,6,1,L,4, ENVIRA SURUCUCU,19.6,21, 15,0.9,4.1,5.1,112,301.7,266.6,304.2 ... 19991127,1999,11,27,13,5,L,114,UCUUBA T FOLHA,21.8,12, 44.8,0.9,-9999,-9999,-9999,373.3,191.6,395 19991127,1999,11,27,13,5,L,115,UCHIRANA,65.5,36, 50,2.9,-9999,-9999,-9999,3369.6,4429.3,5888.4 |
File 3: CD09_LAI_TNF.csv
| Column | Heading | Units/format | Description |
|---|---|---|---|
| 1 | Sample_year | yyyy | Sample year (yyyy) |
| 2 | Sample_month | mm | Sample month (mm) |
| 3 | Plot_ID | Sampling plot identification number: sampling plots 10 meters wide and 250 meters long were established at each location | |
| 4 | Subplot_ID | Subplot identification number: each plot was divided into 5 subplots | |
| 5 | Distance | m | Distance along the plot main axis where measurement was taken |
| 6 | LAI | Leaf area index measured at dawn or dusk using paired LAI-2000 instruments |
Example data records
|
Sample_year,Sample_month,Plot_ID,Subplot_ID,Distance,LAI 1999,11,1,1,0,7.39 1999,11,1,1,10,6.4 ... 1999,11,6,3,140,6.75 1999,11,6,3,150,6.08 ... 1999,11,13,5,240,7.48 1999,11,13,5,250,5.06 |
File 4: CD09_Leaf_Water_Potential_TNF.csv
| Column | Heading | Units/format | Description |
|---|---|---|---|
| 1 | Sample_date | yyyymmdd | Sampling date (yyyymmdd) |
| 2 | Sample_year | yyyy | Sample year |
| 3 | Sample_month | mm | Sample month |
| 4 | Sample_day | dd | Sample day |
| 5 | Plot_ID | Sampling plot identification number: sampling plots 10 meters wide and 250 meters long were established at each location | |
| 6 | Time | hh:mm | Time of measurement in local time (GMT-5) |
| 7 | Height | m | Estimated height from which leaves were collected |
| 8 | LWP | MPa | Leaf water potential in Mega Pascals measured with a PMS-600 pressure bomb |
| 9 | Gravity_corr_LWP | MPa | Gravity corrected leaf water potential |
| 10 | Local_name | Local name for tree species | |
| 11 | Notes | Notes from the field notebook | |
| Missing data are indicated by -9999 | |||
Example data records
|
Sample_datec,Sample_date,Sample_year,Sample_month,Sample_day,Plot_ID,Time, Height,LWP,Gravity_corr_LWP,Local_name,Notes 19991116,11/16/1999,1999,11,16,1,6:25, 30,0.3,0,Sucupira amarela,-9999 19991116,11/16/1999,1999,11,16,1,6:30, 23,0.25,0.02,Muirauba,-9999 ... 19991117,11/17/1999,1999,11,17,5,6:30, 17,0.1,-0.07,Angelim rajado,-9999 19991117,11/17/1999,1999,11,17,5,6:35, 18,0.2,0.02,Caraipe,-9999 ... 19991127,11/27/1999,1999,11,27,13,6:50, 28,0.67,0.39,Quaruba rosa,-9999 19991127,11/27/1999,1999,11,27,13,6:55, 26,0.3,0.04,Caraipe,-9999 |
File 5: CD09_Vegetation_CN_TNF.csv
| Column | Heading | Units/format | Description |
|---|---|---|---|
| 1 | Sample_date | yyyymmdd | Sampling date (yyyymmdd) |
| 2 | Sample_year | yyyy | Sample year |
| 3 | Sample_month | mm | Sample month |
| 4 | Plot_ID | Sampling plot identification number: sampling plots 10 meters wide and 250 meters long were established at each location | |
| 5 | Subplot_ID | Location of litter or root sample in transect (subplot identification number) | |
| 6 | Sample_type | Sample type: foliar samples are identified to species or life form | |
| 7 | Local_name | Stem identification for foliage samples with local name where available | |
| 8 | Height | m | Height at which foliage samples were collected in meters above the ground |
| 9 | delta13_C | per mil | Isotopic ratio of 13C/12C, measured with continuous flow on Finigan Delta Plus at CENA |
| 10 | C_conc | percent | Carbon concentration in percent measured on a combustion analyzer at CENA |
| 11 | delta15_N | per mil | Isotopic ratio of 15N/14N, measured with continuous flow on Finigan Delta Plus at CENA |
| 12 | N_conc | percent | Nitrogen concentration in percent measured on a combustion analyzer at CENA |
| 13 | CN_ratio | Mass based carbon to nitrogen ratio | |
| Missing dates are identified as "NDR" (no date recorded), though all samples were collected during November 1999; all other missing values are represented as -9999 | |||
Example data records
|
Sample_date,Sample_year,Sample_month,Sample_day,Plot_ID,Subplot_ID,Sample_type,Local_name,Height,delta13_C,C_conc,delta15_N,N_conc,CN_ratio 19991116,1999,11,16,1,-9999,Foliage,Angelim rajado,20,-30.5,47.04,8.35,3.73,12.63 19991116,1999,11,16,1,-9999,Foliage,Gombeira,30,-27.16,48.68,6.31,3.32,14.64 ... 19991119,1999,11,19,7,-9999,Foliage,Angelim da mata,25,-30.49,49.23,3.73,2.12,23.2 19991118,1999,11,18,7,-9999,Bark,not identified,-9999,-30.7,47.23,4.52,1.11,42.93... NDR,1999,11,-9999,13,3,Roots,not identified,-9999,-28.84,49.11,2.41,1.88,26.2 19991127,1999,11,27,13,-9999,Wood,not identified,-9999,-28.65,47.45,1.64,0.36,131.91 |
Site boundaries: (All latitude and longitude given in decimal degrees)
| Site (Region) | Westernmost Longitude | Easternmost Longitude | Northernmost Latitude | Southernmost Latitude | Geodetic Datum |
|---|---|---|---|---|---|
| Para Western (Santarem) - Tapajos National Forest (Para Western (Santarem)) | -55.20944 | -54.90806 | -2.83806 | -4.04778 | World Geodetic System, 1984 (WGS-84) |
| Para Western (Santarem) - km 67 Primary Forest Tower Site (Para Western (Santarem)) | -54.95900 | -54.95900 | -2.85700 | -2.85700 | World Geodetic System, 1984 (WGS-84) |
| Para Western (Santarem) - km 83 Logged Forest Tower Site (Para Western (Santarem)) | -54.97806 | -54.95139 | -2.83806 | -2.85889 | World Geodetic System, 1984 (WGS-84) |
Locations of the 13 study sites as shown in figure 1.
| Site | Latitude (S) | Longitude (W) |
|---|---|---|
| 1 | -2.838083 | -54.969333 |
| 2 | -2.840417 | -54.998222 |
| 3 | -2.873917 | -54.951556 |
| 4 | -2.858806 | -54.95617 |
| Sites 1-4 are near the km 67 camp | ||
| 5 | -3.356333 | -54.946583 |
| 6 | -3.351000 | -54.949250 |
| 7 | -3.380806 | -54.911444 |
| 8 | -3.375917 | -54.910472 |
| Sites 5-8 are near the km 77 camp | ||
| 9 | -4.047778 | -54.941000 |
| 10 | -4.041278 | -54.907917 |
| Sites 9-10 are near Ruropolis | ||
| 11 | -3.488944 | -55.256833 |
| 12 | -3.367833 | -55.209833 |
| 13 | -3.408639 | -55.222917 |
| Sites 11-13 are accessed from the Tapajos river | ||
Time period:
- The data set covers the period 1999/11/01 to 1999/11/29
- Temporal Resolution: one-time survey
Platform/Sensor/Parameters measured include:
- FIELD INVESTIGATION / PLANT CANOPY ANALYZER / PLANT CHARACTERISTICS
- LABORATORY / CHN ANALYZER / LITTER CHARACTERISTICS
- FIELD INVESTIGATION / PRESSURE CHAMBER / LEAF CHARACTERISTICS
- FIELD INVESTIGATION / STEEL MEASURING TAPE / BIOMASS
- FIELD INVESTIGATION / HUMAN OBSERVER / FOREST COMPOSITION/STRUCTURE
- LABORATORY / LEAF AREA METER / LEAF CHARACTERISTICS
- LABORATORY / MASS SPECTROMETER / LEAF CHARACTERISTICS
- FIELD INVESTIGATION / HUMAN OBSERVER / VEGETATION SPECIES
- LABORATORY / /ANALYSIS / SOIL TEXTURE
- LABORATORY / KJELDAHL DIGESTION / NITROGEN
- LABORATORY / ANALYSIS / CARBON
- FIELD INVESTIGATION / SOIL CORING DEVICE / SOIL BULK DENSITY
- LABORATORY / SOIL MOISTURE PROBE / SOIL MOISTURE/WATER CONTENT
3. Data Application and Derivation:
Data were used to investigate hypotheses concerning expected patterns in ecosystem structure and function, patterns that could ultimately assist the process of scaling up (Williams et al., 2002).
- Soil texture is a key control on soil moisture content and thus leaf water status. Leaf water potential measurements and biomass C isotope data will indicate greater soil moisture stress on sandier soils.
- Soil texture is a key control on total soil nutrient content and thus on ecosystem nutrient cycling. Vegetation nutrient stocks will be lower on sandy soils than on loam and clay soils.
- Available soil water and soil nutrient stocks are critical controls on C cycling. Increased soil moisture stress and lower soil nutrient stocks on sandy soils will result in reduced primary production and less standing biomass than on clay and loam soils.
Data were used to investigate how variation in the key biotic controls on gross primary production (GPP) observed within and among sites is propagated into predictions of GPP. Is there significant variability in GPP among sites? And how does variability in the biotic constraints on production at fine scales translate into uncertainty in regional predictions?
4. Quality Assessment:
Quality control information is included Williams et al. 2002.
5. Data Acquisition Materials and Methods:
Study area:
The study region is located within the Tapajos National Forest (TNF), 50 km south of Santarem, Para, Brazil, lying between latitudes 2°45'S and 4°S and longitudes 54°50'W and 55°20'W. The TNF is bordered on its western edge by the Tapajos River 29 m above sea level (a.s.l.), a major tributary of the Amazon. The steep escarpment along the river (50 m a.s.l.) prevents flooding of the TNF during high-flow events. Above the escarpment, the TNF is characterized in the north by old erosional remnant plateaus, with further escarpments corresponding to changes in soil texture. There is a very limited drainage net work, and the underlying geology is comprised of slanted alternating beds of sand and clay deposited as a lacustrine-fluvial sequence. The southern TNF is drained by a small river flowing east, and the terrain is more dissected and variable. Most of the TNF is at altitudes of 150-200 m a.s.l., and water table depths typically vary from 60 to 140 m (E. Moran and R. Cosme personal communications).
Selection of Survey Sites
- Sites 1, 3, and 4 were located at the top and site 2 at the bottom of an approximately 50-m escarpment that runs roughly parallel to the river. Sites 3 and 4 were located off the access road connecting the km 67 camp to BR 163, the mostly unpaved national route than runs along the eastern flank of the TNF. At the top of the escarpment, depth to water table exceeded 110 m. Since the escarpment was approximately 50 m high, we estimate that water table depth at site 2 still exceeded 50 m.
- Sites 5-8 were located near the km 117 forest camp, in the central and eastern portion of the TNF. A roughly 50-m escarpment separated sites 5 and 6 (top) from sites 7 and 8 (bottom).
- Sites 9 and 10 were located in the southeastern corner of the TNF, near the small town of Ruropolis, at an altitude of 200 m. Site 9 was within a few hundred meters of a tributary of the Tapajos River that runs along the southern border of the TNF. Site 10 was located in more hilly terrain further to the northeast.
- Ssites 11-13 were accessed from the eastern shore of the Tapajos River; all were located on bluffs that rose steeply from the shore, and all sites were at an altitude of approximately 50 m. Much of the shore showed signs of human disturbance, except for the area we selected where the bluffs had restricted access.
Sampling plot transects:
At each site, sampling plots were marked out along a transect 250 m long and 10 m wide. Transects were oriented away from the entry direction and perpendicular to any access trail and/or nearby river, and thus away from likely sources of disturbance.
Each sampling plot was divided into five equally sized subplots with a length of 50 m.
Soil Surveys:
Within each transect, two soil pits were dug approximately 0.6 m deep and
prepared a smooth vertical face. Paired soil cores were then collected from the
face at three depths-0.1 m, 0.3 m, and 0.5 m using a precision-lathed stainless steel corer.
Litter was brushed away from a nearby area and paired cores of surface soil were collected by vertical insertion. We combined paired cores and recorded wet mass. Samples were then dried at 60°C for 2 days and shipped to the soils laboratory of Raimundo Cosme at EMBRAPA, Belem, PA, Brazil. The samples were analyzed for dry mass, texture, percentage C, percentage organic matter, and percentage nitrogen (N). From volumes of corers, we determined the bulk density for each soil layer.
Vegetation Surveys:
To determine woody biomass within each transect, we recorded the diameter at 1.35 m (DBH) of all stems larger than 0.1 m DBH. Buttressed trees were measured just above the buttress. A local mateiro (woodsman) identified the common name associated with each stem.
Biomass (B) was estimated using allometric relationships described in Laurance and others (1999) that is a function of DBH, with a 12% increment applied to account for the presence of trees smaller than 0.1 m DBH: B = 600 (exp{3.323 + (2.456(ln(d/l00)))}).
A pair of LAI-2000 plant canopy analyzers (LI-COR Inc.,
Lincoln, NE, USA)
were used to estimate leaf area index (LAI). Along each transect, survey points were located at 10-m intervals (26 in all). To minimize the confounding effects of direct sun on the instruments,
readings were collected at dusk or dawn. In addition, the analyzers were oriented so that the observer's back was to the sun at all times. To determine a differential reading for LAI estimation, the paired instruments were used contemporaneously, one located on level ground in a clearing near the study site (usually the forest camp or the river shore), the other deployed along the transect.
Foliage was sampled from the upper canopy with a shotgun. At each site six or seven samples
were collected from different canopy species, tending to select the larger and more accessible trees.
At least five leaves were collected for each sample, avoiding yellow and brownish leaves. All leaf outlines were traced onto paper. In the laboratory, we cut out the tracings and determined leaf area using a LI 3100 area meter (U-COR Inc.) and recorded the mass of the associated dried leaves.
Leaf mass per area was then estimated for each sample.
Wood samples were collected with a coring hammer from at least a dozen larger stems in the first 50-m section of the 250 -m transect at each site. At each soil pit,
leaf litter grab samples and leaf fine roots were collected from the surface soil layers. Fine-root samples were washed gently later on the day of sampling. All vegetation samples were dried at 60°C for 48 h and then shipped to the laboratory of Reynaldo Victoria at the Centro de Energia Nuclear na Agricultura (CENA), Piricicaba, SP, Brazil. Samples were then weighed, ground, and analyzed for percentage C, percentage N, and stable isotope ratios of C and N.
At each site, close to dawn (between 6 AM and 7 AM), three
to seven foliage samples were collected from the upper canopy using a shotgun.
Dawn leaf water potential (Psi) for individual leaves was determined using a scholander pressure bomb (Model 600, PMS Instrument Co., Corvallis, OR, USA).
The height from which the foliage was collected (height estimates ranged from 10 to 37 m)
was visually estimated and then a gravitational correction was applied (0.01 MPa/m) to give an estimate of water potential
in the rooting zone. We judged the instrumental precision at ±0.1 MPa.
Estimating height visually is relatively imprecise, but an imprecision of ±5 m
in height propagates into an error of ±0.05 MPa in water potential estimates.
Given that effects of height-based uncertainty and/or bias are thus likely similar to or smaller than instrumental error, more precise techniques for height estimate are not justified.
Leaf water potential
Height estimates were used to correct these data for gravitational effects.
6. Data Access:
This data is available through the Oak Ridge National Laboratory (ORNL) Distributed Active Archive Center (DAAC).
Data Archive Center:
Contact for Data Center Access Information:
E-mail: uso@daac.ornl.gov
Telephone: +1 (865) 241-3952
7. References:
Williams, M., Y.E. Shimabukuro, D.A. Herbert, S. Pardi Lacruz, C. Renno and E.B. Rastetter (2002) Heterogeneity of soils and vegetation in eastern Amazonian rain forest; implications for scaling up biomass and production. Ecosystems, 5: 692-704.
Related Publications
- Herbert, D.A., M. Williams, and E.B. Rastetter. (2003) A model analysis of N and P limitation on carbon accumulation in Amazonian secondary forest after alternate land-use abandonment. Biogeochemistry 65(1):121-150.