Get Data
Summary:
This data set contains summary data for monthly leaf area index (LAI) and plant area index (PAI) at the km 83 Tower Site, in the Tapajos National Forest, Para, Brazil. LAI was estimated for hemispherical photographs of leaves collected between 2000 and 2003, using the histogram and gap-fraction analysis methods.
There are two data files with this data set: one comma-delimited ASCII data file with this data set which contains the monthly summary LAI and PAI data, and one compressed (*.zip) file that contains hemispherical photo images (.bmp) for 2000-2001. The images include those taken pre-logging and post-logging at the measurement site for the purpose of comparing LAI. In addition, there is a companion file containing a program code developed for LAI analysis provided as an ASCII text file.
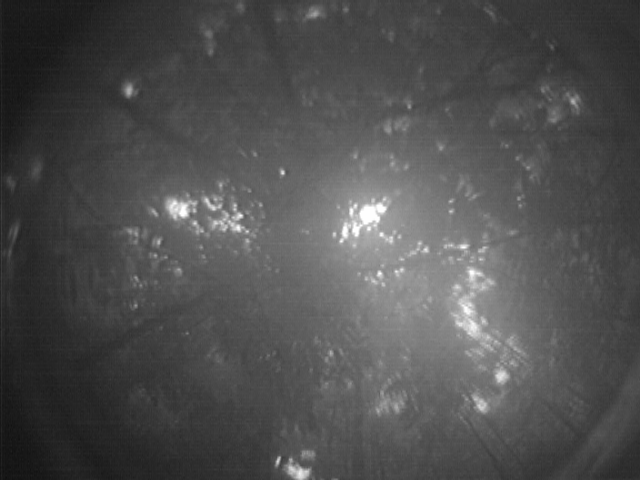
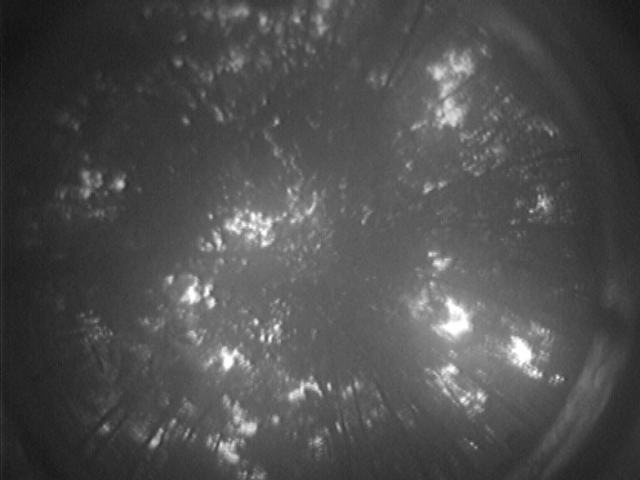
Figure 1. Below-canopy hemispherical photographs in the tropical forest. Images collected with the CI-110 device.
Data Citation:
Cite this data set as follows:
Juarez, R.N., H.R. da Rocha, A.M. Figueira, M.L. Goulden, and S.D. Miller. 2010. LBA-ECO CD-04 LAI Estimated from Photos, km 83 Tower Site, Tapajos National Forest. Data set. Available on-line [http://daac.ornl.gov] from Oak Ridge National Laboratory Distributed Active Archive Center, Oak Ridge, Tennessee, U.S.A. http://dx.doi.org/10.3334/ORNLDAAC/1103
Implementation of the LBA Data and Publication Policy by Data Users:
The LBA Data and Publication Policy [http://daac.ornl.gov/LBA/lba_data_policy.html] is in effect for a period of five (5) years from the date of archiving and should be followed by data users who have obtained LBA data sets from the ORNL DAAC. Users who download LBA data in the five years after data have been archived must contact the investigators who collected the data, per provisions 6 and 7 in the Policy.
This data set was archived in July of 2012. Users who download the data between July 2012 and June 2017 must comply with the LBA Data and Publication Policy.
Data users should use the Investigator contact information in this document to communicate with the data provider. Alternatively, the LBA website [http://lba.inpa.gov.br/lba/] in Brazil will have current contact information.
Data users should use the Data Set Citation and other applicable references provided in this document to acknowledge use of the data.
Table of Contents:
- 1 Data Set Overview
- 2 Data Characteristics
- 3 Applications and Derivation
- 4 Quality Assessment
- 5 Acquisition Materials and Methods
- 6 Data Access
- 7 References
1. Data Set Overview:
Project: LBA (Large-Scale Biosphere-Atmosphere Experiment in the Amazon)
Activity: LBA-ECO
LBA Science Component: Carbon Dynamics
Team ID: CD-04 (Goulden / Rocha)
The investigators were Andreae, Meinrat O.; Artaxo, Paulo; Bonora, Luceia; Correia, Alexandre Lima; Correia, Francis Wagner Silva; de Andrade Junior, Gilberto; Ganzeveld, Laurens; Kesselmeier, Juergen; Meixner, Franz X.; Metzger, Swen; Rottenberger, Stefanie; Souza, Suellem and Juarez, Robinson Negron. You may contact Juarez, Robinson Negron (rjuarez@tulane.edu).
LBA Data Set Inventory ID: CD04_LAI_Estimates
This data set contains summary data for monthly leaf area index (LAI) and plant area index (PAI) at the km 83 Tower Site, in the Tapajos National Forest, Para, Brazil. Utilizing the histogram and gap-fraction analysis methods, LAI was estimated for hemispherical photographs of leaves collected between 2000 and 2003.
Related data set
- LBA-ECO CD-04 Leaf Area Index, km 83 Tower Site, Tapajos National Forest, Brazil (LAI determined from litter basket samples collected in 2000-2001).
2. Data Characteristics:
There are two data files with this data set: one in comma-delimited format (.csv) and one in compressed format (*.zip). The compressed data file contains three compressed files that contain hemispherical photo images collected from 2000-2001.
There is one companion ASCII text file of the program code developed for LAI analysis (.txt).
File 1: CD04_LAI_PAI_photos.csv:
Summary data for the calculations of LAI and PAI between 2000 and 2003 as a comma-delimited
ASCII file.
| Column | Heading | Units/format | Description |
|---|---|---|---|
| 1 | Year | yyyy | Year in which the hemispherical photos were taken (yyyy): 2000-2003 |
| 2 | Month | mm | Month in which the hemispherical photos were taken: 1= January and 12= December |
| 3 | Row | Location of photographs within the sampling grid: A-M (see data set documentation ) | |
| 4 | Status | Status of the site with respect to logging operations: Pre-logging or Logged. Selective logging began in September 2001. | |
| 5 | No_photos | Number of hemispherical photos included in the calculation of PAI and LAI | |
| 6 | PAI | m2 per m2 | Mean plant area index for the sampling row in meters squared per meter squared (m2 per m2) calculated using the Beer-Lambert equation |
| 7 | LAI | m2 per m2 | Mean leaf area index for the row in meters squared per meter squared (m2 per m2) calculated from hemispherical photos |
Example data records:
|
Year,Month,Row,Status,No_photos,PAI,LAI 2000,6,A,Pre-logging,5,4.9,6.36 2000,6,B,Pre-logging,16,4.03,5.23 2000, 6, C, Pre-logging, 29, 4.6, 5.97 ... 2001, 5, C, Pre-logging, 5, 5.17, 6.71 2001, 5, E, Pre-logging, 12, 4.64, 6.03 2001, 5, G, Pre-logging, 10, 4.99, 6.48 ... 2003, 5, G, Logged, 11, 3.26, 4.23 2003, 5, L, Logged, 7, 3.18, 4.13 2003, 5, M, Logged, 4, 3.87, 5.03 |
File 2: CD04_LAI_Hemispherical_Images.zip
This data file is comprised of three compressed files which
contain hemispherical photo images (.bmp) taken at the forest measurement site
between 2000-2001. The images include those taken pre-logging and post-logging
at the measurement site for the purpose of comparing LAI.
File names:
CD04_LAI_precut.zip
CD04_LAI_postcut.zip
CD04_LAI_May2001.zip
Companion file: LAI_OTV_gap_fraction_program.txt:
Individual file names indicate the row-column-month-year that the image was taken. See figure 2.
The text file of the program code developed for LAI analysis was run on a 1GHz Pentium III PC using the Interactive Data Language IDL 6.0.
Site boundaries: (All latitude and longitude given in decimal degrees)
| Site (Region) | Westernmost Longitude | Easternmost Longitude | Northernmost Latitude | Southernmost Latitude | Geodetic Datum |
|---|---|---|---|---|---|
| Para Western (Santarem) - km 83 Logged Forest Tower Site (Para Western (Santarem)) | -54.97070 | -54.97070 | -3.01700 | -3.01700 | World Geodetic System, 1984 (WGS-84) |
Time period:
- The data set covers the period 2000/06/01 to 2003/05/30
- Temporal Resolution: monthly survey
Platform/Sensor/Parameters measured include:
- FIELD SURVEY / CAMERAS / LEAF CHARACTERISTICS
- ANALYSIS / CAMERAS / LEAF CHARACTERISTICS
3. Data Application and Derivation:
The optimal threshold value (OTV), the gray-level required to separate the background (sky) and the foreground (leaves), was analytically calculated using the Entropy Cross Over method (Sahoo et al. 1997). The OTV was used to calculate the LAI using the well-known gap fraction method. This methodology was tested in a managed Amazon forest in the state of Para, Brazil.
4. Quality Assessment:
In general, the error between observed and calculated LAI was ~6%. The methodology presented is suitable for the calculation of LAI since it is responsive to sky conditions, automatic, easy to implement, faster than commercially available software, and requires less data storage (Juarez et al., 2009).
During image capture, the brightness (luminosity) and contrast (between background and foreground) were tuned to provide visual quality. In general it was observed that high and low brightness values often led to low and high estimates of LAI, respectively. Although contrast and brightness should combine to give better estimates of LAI, their tuning also depended on sky luminosity and canopy architecture.
5. Data Acquisition Materials and Methods:
Site description:
The research was conducted at a tropical forest site located in the Tapajos National Forest, near the micrometeorological tower installed near the km 83 post of BR-163 (Cuiaba-Santarem highway), approximately 70 km south of Santarem, Para, Brazil, and at 153 m above sea level (Goulden et al. 2004). The vegetation is dense tropical humid forest with a canopy height of ~35-40 m, with yellow distrophic latosol (clay oxisol) soil. The annual mean precipitation and temperature are 1,911 mm and 25 degrees C, respectively, with the dry season defined from July to November. Evapotranspiration ranges between ~4 mm day-1 in the dry season to ~3 mm day-1 in the wet season (da Rocha et al. 2004). The site was selectively logged in September 2001, removing 12% of the canopy at our measurement site (Miller et al. 2007).
Sampling grid:
At the forest site, below-canopy images were collected at nodes of a 300 m x 600 m regular grid that extended 500 m east, 100 m west, 150 m south, and 150 m north of the flux tower.
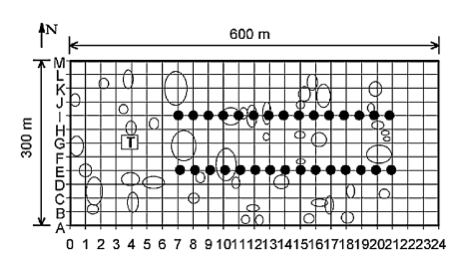
Figure 2. Regular grid used under the tropical forest site to collect the below-canopy hemispheric images. Full circles are litterfall traps, ellipses are the gaps created by the selective logging (after September 2001), and T is the micrometeorological tower (3°1’1.2”S, 54°58’14.52”W).
Image processing:
LAI was estimated by the use of the gap-fraction method (Norman and Campbell, 1989) with hemispherical photographs (images) and histogram analysis.
The images were collected using the CI-110 Digital Plant Canopy Imager (CID Inc., Camas, Washington, USA), mounted on a tripod, aligned to magnetic north, leveled to 90 cm height aboveground, and connected to a notebook computer. The CI-110 Digital Plant Canopy Imager deploys a 150 degree fish-eye lens image, recorded as 180912 pixels, 24-bits gray-level files (BMP format) with 3-by-m-by-n arrays. The set of images were captured using an azimuth angle range from 0 degrees to 360 degrees , and its zenith angle from 0 degrees to 75 degrees. The image files were converted into 8-bit (2D) images by extracting one channel, which reduced to one-third the storage size. This procedure is justifiable since at the gray-level the three channels (blue, red, yellow) have the same values.
The histogram analysis was performed using the converted set of images. For the analysis, each image was divided into seven 10 degree-strips from 5 to 75 degrees and the gap fraction and LAI were calculated for each annulus in a pixel-per-pixel basis (using the Interactive Data Language IDL 6.0 running on a 1GHz pentium III PC). LAI was also calculated using the device software (CI-110, Production 1.0, CID Inc. 1997, 1998).
6. Data Access:
This data is available through the Oak Ridge National Laboratory (ORNL) Distributed Active Archive Center (DAAC).
Data Archive Center:
Contact for Data Center Access Information:
E-mail: uso@daac.ornl.gov
Telephone: +1 (865) 241-3952
7. References:
da Rocha, H.R., M.L. Goulden, S.D. Miller, M.C. Menton, L.D.V.O. Pinto, H.C. Freitas and A.M.S. Figuiera. 2004. Seasonality of water and heat fluxes over a tropical forest in eastern Amazonia. Ecological Applications 14(4): S22-S32.
Goulden, M.L., S.D. Miller, H.R. da Rocha, M.C. Menton, H.C. Freitas, A.M.S. Figuiera and C.A.D. Sousa. 2004. Diel and seasonal patterns of tropical rainforest CO2 exchange. Ecological Applications 14(4) S42-S54.
Juarez, Robinson Negron, H.R. da Rocha, A.M.S. Figueira, M.L. Goulden, and S.D. Miller. 2009. An improved estimate of leaf area index based on the histogram analysis of hemispherical photographs. Agric. Forest Meteorol. 149: 920-928.
Miller,S.D., M.L. Goulden, H. da Rocha. 2007. The effect of canopy gaps on subcanopy ventilation and scalar fluxes in a tropical forest. Agricultural and Forest Meteorology 142: 25-34.
Norman, J.M., Campbell, G.S., 1989. Canopy Structure. In: Pearcy, R.W., Ehlesinger, J., Mooney, H.A., Rundel, P.W. (Eds.), Plant Physiological Ecology. Field Methods and Instrumentation. Chapman and Hall, London, pp. 301–325.
Sahoo, P.K., Slaaf, D.W. and Albert, T.A., 1997. Threshold selection using a minimal histogram entropy difference. Optical Engineering, 36(7): 1976-1981.
Sakai RK, Fitzjarrald DR, Moraes OLL, Staebler RM, Acevedo OC, Czikowsky MJ, Da Silva R, Brait E, Miranda V. (2004) Land-use change effects on local energy, water, and carbon balances in an Amazonian agricultural field. Global Change Biology, 10, 895-907.