Get Data
Summary:
Eddy correlation and micrometeorological measurements began in 2001 and continued through 2005 at the pasture site at km 77 on BR-163 just south of the city of Santarem, Para, Brazil. Measurements included turbulent fluxes (momentum, heat, water vapor, and CO2) using the eddy covariance (EC) approach. Other measurements included the CO2 profile, air temperature, humidity, wind speed profile, downward and upward solar and terrestrial radiation, downward and upward photosynthetically active radiation (PAR), atmospheric pressure, rainfall, soil temperature, soil moisture, and soil heat flux. Data are presented in 5 comma-separated ASCII value (csv) files each corresponding roughly to one calendar year.
At the beginning of the measurements, in September 2000, the field was a pasture. In November 2001, the pasture was burned, plowed, and planted in upland (non-irrigated) rice. Land use practices during the study period were recorded and are included in a table in Section 5 of this guide.
The EC system was composed of a 3D sonic anemometer (ATI 3D) and an infrared analyzer (LICOR 6262) installed on a 20m tower in the agricultural field. The methodology to calculate the flux is described in detail in Sakai et al. (2004) and a companion file is included that describes in detail the formulae used to calculate the eddy flux variables (CD03_Pasture_Flux_Calculations.pdf).
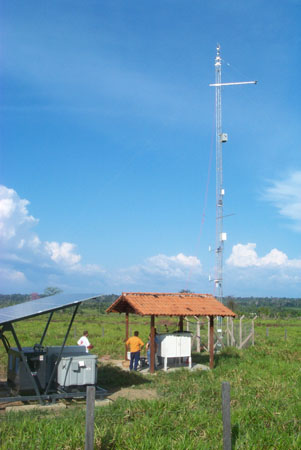
Eddy flux and micrometeorological measurement site, Pasture Site at km 77 on BR-163 just south of the city of Santarem, Para, Brazil.
Data Citation:
Cite this data set as follows:
Fitzjarrald, D.R. and R.K. Sakai. 2010. LBA-ECO CD-03 Flux-Meteorological Data, km 77 Pasture Site, Para, Brazil: 2000-2005. Data set. Available on-line [http://daac.ornl.gov] from Oak Ridge National Laboratory Distributed Active Archive Center, Oak Ridge, Tennessee, U.S.A. doi:10.3334/ORNLDAAC/962
Implementation of the LBA Data and Publication Policy by Data Users:
The LBA Data and Publication Policy [http://daac.ornl.gov/LBA/lba_data_policy.html] is in effect for a period of five (5) years from the date of archiving and should be followed by data users who have obtained LBA data sets from the ORNL DAAC. Users who download LBA data in the five years after data have been archived must contact the investigators who collected the data, per provisions 6 and 7 in the Policy.
This data set was archived in March of 2010. Users who download the data between March 2010 and February 2015 must comply with the LBA Data and Publication Policy.
Data users should use the Investigator contact information in this document to communicate with the data provider. Alternatively, the LBA Web Site [http://lba.inpa.gov.br/lba/] in Brazil will have current contact information.
Data users should use the Data Set Citation and other applicable references provided in this document to acknowledge use of the data.
Table of Contents:
- 1 Data Set Overview
- 2 Data Characteristics
- 3 Applications and Derivation
- 4 Quality Assessment
- 5 Acquisition Materials and Methods
- 6 Data Access
- 7 References
1. Data Set Overview:
Project: LBA (Large-Scale Biosphere-Atmosphere Experiment in the Amazon)
Activity: LBA-ECO
LBA Science Component: Physical Climate
Team ID: CD-03 (Fitzjarrald / Moraes)
The investigators were Fitzjarrald, David R.; Moraes, Osvaldo Luiz Leal de; Acevedo, Otavio C; Czikowsky, Matthew J.; Sakai, Ricardo; Tsoyreff, Alexander and da Silva, Rodrigo . You may contact Fitzjarrald, Dr. David R. (fitz@asrc.cestm.albany.edu) and Sakai, Dr. Ricardo K. (sakai@asrc.cestm.albany.edu)
LBA Data Set Inventory ID: CD03_Pasture_Flux
Eddy correlation measurements were recorded between September 2000 and the end of 2005 at the pasture site in Santarem region. The EC system includes a 3D sonic anemometer (ATI 3D) and an infrared analyzer (LICOR 6262) installed on a 20m tower. Other measurements include the air temperature, humidity, and wind speed profile, downward and upward solar and terrestrial radiation, downward and upward PAR, atmospheric pressure, rainfall, soil temperature, soil moisture, and soil heat flux. In addition to soil and atmospheric measurements, a detailed record of the land use at the site is included in section 5.
2. Data Characteristics:
Data were collected at the pasture site located at km 77 on BR-163 just south of the city of Santarem Para. Measurements began in 2001 and continued through 2005. Data are presented in 5 comma-separated ASCII value (csv) files each corresponding roughly to one calendar year. All files have the same format.
File naming convention:
Filename: CD-03_Pasture_CO2_Fluxes_Km77_Para_YYYY.csv
where YYYY = 2001, 2002, 2003, 2004, 2005
Missing data are represented as -9999
Column Descriptions:
| Column | Column Heading | Units | Description |
|---|---|---|---|
| 1 | year | YYYY | |
| 2 | Julian_day | decimal day | Julian day or fractional day (e.g., 1.22917) corresponding to the middle of the 30 minute averaging period based on GMT. Local time is GMT - 4. |
| 3 | hh | decimal hour | Decimal hour (e.g., 4.25) corresponding to the middle of the 30 minute averaging period based on GMT. Local time is GMT - 4. |
| 4 | wT | K*m/s | Sensible heat flux. (Kinematic form. To convert to W/m2, multiply by the air density and the specific heat constant at constant pressure.) |
| 5 | wT_status | 0= data; 1=gap filling; 2= no data no filling; 3= nighttime+ low ustr (ustr.min = 0.2 m/s) | |
| 6 | wq | Kg/Kg*m/s | Latent Heat Flux. (Kinematic form. The unit Kg/Kg is the water vapor mixing ratio, that is (Kg of water vapor)/(Kg of air). To convert to W/m2, multiply by the air density and by the latent heat constant for condensation.) |
| 7 | wq_status | 0= data; 1=gap filling; 2= no data no filling; 3= nighttime+ low ustr (ustr.min = 0.2 m/s) | |
| 8 | wco2 | mg CO2/m2/s | CO2 flux. Rate of vertical transfer of CO2 calculated from measurements above the canopy. Negative values denote movement of CO2 into the canopy. |
| 9 | wco2_status | 0= data; 2= no data no filling | |
| 10 | ustr | m/s | friction velocity; ustr.min=0.2m/s |
| 11 | ustr_status | 0= data; 2= no data no filling | |
| 12 | nee | mg CO2/m2/s | Net Ecosystem Exchange. Net ecosystem exchange, including subcanopy C02 storage. Subcanopy storage includes the entire column from the ground to the height of the eddy covariance system. |
| 13 | nee_status | 0= data; 1=gap filling; 2= no data no filling; 3= nighttime+ low ustr (ustr.min = 0.2 m/s) | |
| 14 | S_dw | W/m2 | Downward solar radiation flux measured using a Kipp & Zonen net radiometer (model CG2, or CNR1) at 18 m height |
| 15 | S_up | W/m2 | Upward solar radiation flux measured using a Kipp & Zonen net radiometer (model CG2, or CNR1) at 18 m height |
| 16 | L_dw | W/m2 | Downward terrestrial radiation flux measured using a Kipp & Zonen net radiometer (model CG2, or CNR1) at 18 m height |
| 17 | L_up | W/m2 | Upward terrestrial radiation flux measured using a Kipp & Zonen net radiometer (model CG2, or CNR1) at 18 m height |
| 18 | PAR_dw | micromol/m2/s | Downward photosynthetically active radiation flux measured using quantum sensors (Licor, model LI - 190) at 18 m height |
| 19 | PAR_up | micromol/m2/s | Upward photosynthetically active radiation flux measured using quantum sensors (Licor, model LI - 190) at 18 m height |
| 20 | Ta_1 | degrees C | Air temperature at 11.31 m height: Measured using CS500 or HMP45C probes. All probes were enclosed in ventilated radiation shields (MET-ONE, model 076B). |
| 21 | Ta_2 | degrees C | Air temperature at 4.79 m height |
| 22 | Ta_3 | degrees C | Air temperature at 2.20 m height |
| 23 | RH_1 | % | Relative humidity at 11.31 m height: Measured using Vaisala CS500 or HMP45C probes. All probes were enclosed in ventilated radiation shields (MET-ONE, model 076B) |
| 24 | RH_2 | % | Relative humidity at 4.79 m height |
| 25 | RH_3 | % | Relative humidity at 2.20 m height |
| 26 | q_1 | g/Kg | Specific Humidity at 11.31 m height |
| 27 | q_2 | g/Kg | Specific Humidity at 4.79 m height |
| 28 | q_3 | g/Kg | Specific Humidity at 2.20 m height |
| 29 | press | millibars | Air pressure measured using a Vaisala pressure sensor (model PTB101B) located in the meterological shed. |
| 30 | Ts_1 | degrees C | Soil temperature at 0.14 m depth. Soil temperature measured with Campbell Sci. model CS107 probe |
| 31 | Ts_2 | degrees C | Soil temperature at 0.24 m depth |
| 32 | Ts_3 | degrees C | Soil temperature at 0.50m depth |
| 33 | Ts_4 | degrees C | Soil temperature at 1.5 m depth |
| 34 | Ts_5 | degrees C | Soil temperature at 2.0 m depth |
| 35 | G_1 | W/m2 | Soil heat flux at 0.19 m depth: Soil heat flux plate (Campbell Sci. model HFT-3) |
| 36 | G_2 | W/m2 | Soil heat flux at 1.0 m depth |
| 37 | Fsoil | m3/m3 | Soil moisture content at 0.29 m depth: Soil moisture content measured with a Campbell Scientific (model CS615). Soil moisture content calibration performed by Pedro Moura/ Humberto da Costa (IAG-USP). |
| 38 | precip | mm | Precipitation data using a tipping bucket model TE525m installed close to the ground. |
| 39 | u2D_1 | m/s | u component (W->E) from 2D (ATI, model CATI) sonic at 12 m |
| 40 | u3D | m/s | u component (W->E) from 3D sonic (ATI, SATI/3K) model at 8.3 m |
| 41 | u2D_2 | m/s | u component (W->E) from 2D (ATI, model CATI) sonic at 7.2 m |
| 42 | u2D_3 | m/s | u component (W->E) from 2D (ATI, model CATI) sonic at 2.7 m |
| 43 | v2D_1 | m/s | v component (S->N) from 2D (ATI, model CATI) sonic at 12 m |
| 44 | v3D | m/s | v component (S->N) from 3D sonic (ATI, SATI/3K) model at 8.3 m |
| 45 | v3D_2 | m/s | v component (S->N) from 2D (ATI, model CATI) sonic at 7.2 m |
| 46 | v3D_3 | m/s | v component (S->N) from 2D (ATI, model CATI) sonic at 2.7 m |
Example data records: CD-03_Pasture_CO2_Fluxes_Km77_Para_2001.csv
| Header records year,Julian_day,hh,wT,wT_status,wq,wq_status,wco2,wco2_status,ustr,ustr_status,nee,nee_status,S_dw,S_up,L_dw,L_up, PAR_dw,PAR_up,Ta_1,Ta_2,Ta_3,RH_1,RH_2,RH_3,q_1,q_2,q_3,press,Ts_1,Ts_2,Ts_3,Ts_4,Ts_5,G_1,G_2, Fsoil,precip,u2D_1,u3D,u2D_2,u2D_3,v2D_1,v3D,v3D_2,v3D_3 2001,1.15625,3.75,-3.300E-03,1,-2.9800E-06,1,-9.999E+03,2,-9999,2,-9.999E+03,2,0,0.2,0,0.2, 0.1,0.5,22,22.6,22.1,100,100,100,16.7,17.4,17.1,1000.17,26.2,27.2,27.2,27.6,27.7,-3.9,-0.4, 0.314,0,-9999,-9999,-9999,-9999,-9999,-9999,-9999,-9999 2001,1.17708,4.25,-3.700E-03,1,-3.3800E-06,1,-9.999E+03,2,-9999,2,-9.999E+03,2,0,0.5,0,0.5, 0,0.5,22,22.7,22.2,100,100,100,16.7,17.2,17.1,999.706,26.1,27.1,27.2,27.6,27.7,-4,-0.4, 0.314,0,-0.37,-0.2,-0.42,-0.12,-0.89,-0.13,-0.67,-0.77 2001,1.19792,4.75,-5.200E-03,1,-4.6700E-06,1,-9.999E+03,2,-9999,2,-9.999E+03,2,0,0.5,0,0.5, -0.1,0.4,22.1,23,22.2,100,97.7,100,16.7,17.1,17.1,999.479,26,27.1,27.2,27.6,27.7,-4.1,-0.4, 0.313,0,0.19,-0.36,0.04,-0.12,-1.21,-0.48,-0.97,-0.74 ... 2001,365.94792,22.75,-2.780E-02,3,-5.3300E-06,3,4.300E-06,0,0.0823,0,-1.430E-05,3,0,0,0,0, -0.6,0.7,31,29.7,29,46.6,56.2,58.2,13,14.7,14.6,994.952,28.4,30.2,28.8,27.6,28.2,-1.4,0.3, 0.2,0,-9999,-9999,-9999,-9999,-9999,-9999,-9999,-9999 2001,365.96875,23.25,-2.250E-02,1,-4.3000E-06,1,-7.550E-05,0,-9999,2,-3.040E-05,0,0,0,0,0, -0.7,0.9,29.7,28.8,28,52.2,59.5,62.2,13.6,14.8,14.7,995.457,28.4,30.1,28.8,27.6,28.2,-2.2,0.3, 0.2,0,-9999,-9999,-9999,-9999,-9999,-9999,-9999,-9999 2001,365.98958,23.75,-1.900E-02,1,-3.6400E-06,1,-9.999E+03,2,-9999,2,-9.999E+03,2,0,0,0,0, -0.7,0.9,28.9,27.8,27.5,55.7,65.8,66.4,13.8,15.3,15.2,995.889,28.3,30,28.8,27.5,28.2,-2.7,0.2, 0.2,0,-9999,-9999,-9999,-9999,-9999,-9999,-9999,-9999 |
Site boundaries: (All latitude and longitude given in decimal degrees)
| Site (Region) | Westernmost Longitude | Easternmost Longitude | Northernmost Latitude | Southernmost Latitude | Geodetic Datum |
|---|---|---|---|---|---|
| Santarem - Santarem Pasture Tower Site (Santarem, PA) | -54.89425 | -54.89425 | -3.0202 | -3.0202 | World Geodetic System, 1984 (WGS-84) |
Time period:
- The data set covers the period 2000/09/01 to 2006/01/01.
- Temporal Resolution: 30-minute
Platform/Sensor/Parameters measured include:
- TOWER / SONIC ANEMOMETER / AIR TEMPERATURE
- TOWER / SONIC ANEMOMETER / SURFACE WINDS
- TOWER / IRGA (INFRARED GAS ANALYZER) / CARBON DIOXIDE
- TOWER / IRGA (INFRARED GAS ANALYZER) / WATER VAPOR
- METEOROLOGICAL STATION / PYRANOMETER / SOLAR RADIATION
- METEOROLOGICAL STATION / BAROMETER / ATMOSPHERIC PRESSURE
- METEOROLOGICAL STATION / RAIN GAUGE / PRECIPITATION AMOUNT
- METEOROLOGICAL STATION / THERMISTOR / SOIL TEMPERATURE
- FIELD INVESTIGATION / TDR (TIME DOMAIN REFLECTOMETRY PROBE) / SOIL MOISTURE/WATER CONTENT
- METEOROLOGICAL STATION / PYRGEOMETER / OUTGOING LONGWAVE RADIATION
- METEOROLOGICAL STATION / QUANTUM SENSOR / PHOTOSYNTHETICALLY ACTIVE RADIATION
3. Data Application and Derivation:
Eddy Covariance technique correlates wind, temperature, and other scalar fluctuations to estimate turbulent flux, based on Reynolds averaging. Sonic wind speed and sonic temperature are based on Doppler effect of the speed of sound. Carbon and water vapor fluxes are based on turbulent fluxes and measurement of gas concentrations by absorption of infrared radiation. Turbulent fluxes were calculated from deviations found using 30-minute centered running means. To account for any sonic misalignment or topographically-induced flow, a 3D wind rotation was applied to the wind component (McMillen, 1988). In the daytime, tubing attenuation due to gas diffusion (Leuning and Moncrieff, 1990) at high frequencies had been observed in the spectra for the variables (CO2 and q) measured by the IRGA. This effect also leads to an underestimate of the turbulent fluxes of CO2 and water vapor. A cospectral correction procedure was used to correct the vertical fluxes (Sakai, 2000). It uses the assumption that scalar cospectra have similar shapes at high frequencies (Wyngaard, 1972; Laubach and McNaughton, 1998; Aubinet et al., 2000; Sakai, 2000). Basically, the normalized cospectrum of the vertical heat flux was used to determine the shape of, and cospectra at, the affected frequencies. At night during stable periods that nonetheless exhibit turbulence, many reported EC measurements do detect the small scale (high frequency) eddies. However, turbulent mixing is often so strongly suppressed at night, especially in open areas surrounded by higher canopy, that the 'stable-continuous' mixing regime is not observed. Low values of the friction velocity were normal at this site.
The boundary layer budget method (NBLb), or accumulation method, provides an alternative during these periods. Comparing the tower data with profiles obtained using a tethered balloon during two separate field campaigns validates this method at this site (Acevedo et al., 2004).
The gap-filling strategy for daytime fluxes was to use carbon assimilation light curves, following Anthoni et al. (1999). The procedure is divided in two steps. First, we determine an empirical relationship between the carbon flux and the PAR, using the Michaelis-Menten model (e.g., Hollinger et al, 1994). Second, we use the residual value of the fitted curve to perform a linear fit using the vapor pressure deficit as the dependent variable as described in Sakai et al. (2004).
4. Quality Assessment:
An automatic CO2 calibration cycle was performed twice daily for
the infrared gas analyzer. Missing values or data that were flagged as
unreliable either by an objective algorithm or subjective inspection have been
given a value of -9999.
5. Data Acquisition Materials and Methods:
Carbon dioxide concentration and standard micrometeorological variables were measured on an instrumented 20 m tower installed in a pasture site that was later converted to rice and soybean cultivation.
CO2
concentrations:
An eddy
correlation system composed of a 3D sonic anemometer (SATI/3K Applied
Technologies) and on an infrared gas analyzer (IRGA, Licor 6262) was
installed at 8.75 m height at 5 Hz. Air samples from 11.8, 5.3, 2.7,
and 0.5m heights were pumped to a second IRGA at 5 Hz and used to estimate canopy storage.
Micrometeorological
variables:
Wind
components were measured with 2D sonic anemometers (Applied
Technologies CATI/2) at three heights 12.2, 5.7 and 3.1m and recorded
at 1 Hz. Anemometers were pointed due east since winds from the east
predominate. Air temperature and humidity sensors (Vaisala Humitter
CS500, or HMP45C) were located in aspirated radiation shields at 6.1,
4.1, and 2.2 m. Near the tower top (17.8 m) data on incident and
reflected global solar radiation (Kipp and Zonen, pyranometer CM11/14
or net radiometer CNR1), photosynthetically active radiation (quantum
sensors; Licor LI-190) as well as downwelling and upwelling global
long-wave pyrgeometer CG2 or net radiometer CNR1) radiative fluxes were
collected at 0.2Hz.
Soil
environment:
Soil
temperatures (Campbell Inc 108) were measured at 0.10, 0.244, 0.50,
1.5, and 2.0 m depth. Soil heat flux and soil moisture were both
measured at 0.3 m depth (Campbell Inc HFT3 and CS615, respectively)
Cropping and land use
practices:
The table below shows the cropping and land use practice intervals
at the km77 site over the study period.
| Crop | Initial date (Julian days) | Initial year | End date (Julian days) | End year |
|---|---|---|---|---|
| pasture | 244 | 2000 | 318 | 2001 |
| bare | 319 | 2001 | 54 | 2002 |
| rice | 55 | 2002 | 164 | 2002 |
| fallow | 165 | 2002 | 354 | 2002 |
| bare | 355 | 2002 | 1 | 2003 |
| rice | 2 | 2003 | 125 | 2003 |
| bare | 126 | 2003 | 134 | 2003 |
| soybean | 135 | 2003 | 254 | 2003 |
| fallow | 255 | 2003 | 1 | 2004 |
| bare | 2 | 2004 | 13 | 2004 |
| rice | 14 | 2004 | 94 | 2004 |
| bare | 95 | 2004 | 121 | 2004 |
| soybean | 122 | 2004 | 244 | 2004 |
| fallow | 245 | 2004 | 82 | 2005 |
| bare | 83 | 2005 | 90 | 2005 |
| soybean | 91 | 2005 | 240 | 2005 |
| fallow | 241 | 2005 | 365 | 2005 |
6. Data Access:
This data is available through the Oak Ridge National Laboratory (ORNL) Distributed Active Archive Center (DAAC).
Data Archive Center:
Contact for Data Center Access Information:
E-mail: uso@daac.ornl.gov
Telephone: +1 (865) 241-3952
7. References:
Acevedo O.C., O.L.L. Moraes, R. Da Silva, et
al. 2004.Inferring nocturnal surface fluxes from vertical profiles of
scalars in an Amazon pasture, Global Change Biology 10: 886-894. doi:10.1111/j.1529-8817.2003.00755.x
Anthoni, PM, Law, BE Unsworth, MH (1999) Carbon and water vapor exchange of an open-canopied ponderosa pine ecosystem: . Agricultural and Forest Meteorology, 95, 151-168. doi:10.1016/S0168-1923(99)00029-5
Aubinet, M.A., A. Ibrom, U. Rannik et al. 2000. Estimates of the annual net carbon and water exchange of forests: the EURO-FLUX methodology. Advances in Ecological Research 30: 13-175.
Hollinger, D.Y., F.M. Kelliher, J.N. Byers
et al. 1994. Carbon dioxide exchange between an undisturbed old-growth
temperate forest and teh atmosphere. Ecology 75: 134-150. doi:10.2307/1939390
Laubach, J.and K.G. McNaughton. 1998. A
spectrum-independent procedure for correcting eddy fluxes with
separated sensors. Boundary Layer Meterology 89: 445-467. doi:10.1023/A:1001759903058
Leuning, R. and J. Moncrieff. 1990.Eddy
covariance of CO2 measurements using open and closed path CO2
analyzers: correction for analyzer water vapour sensitivity and damping
of fluctuations in air sampling tubes. Boundary Layer Meteorology 53:
63-76. doi:10.1007/BF00122463
McMillen,R. 1988. An eddy correlation
technique with extended applicability to non-simple terrain. Boundary
Layer Meteorology 43: 231-245. doi:10.1007/BF00128405
Sakai, R.K. 2000. Observational study of turbulent exchange between the surface and canopy layer over several forest types. Ph.D. thesis. Department of Earth and Atmospheric Sciences, University at Albany SUNY.
Sakai, R.K., D.R. Fitzjarrald, O.L.L. Moraes, R.M. Staebler, O.C. Acevedo, M.J. Czikowsky, R. Da Silva, E. Brait, and V. Miranda. 2004. Land-use change effects on local energy, water, and carbon balances in an Amazonian agricultural field. Global Change Biology 10(5):895-907. doi:10.1111/j.1529-8817.2003.00773.x
Wyngaard, J.C. 1972. Scalar fluxes in the
planetary boundary layer- theory, modeling and measurement. Boundary
Layer Meteorology 50: 49-75. doi:10.1007/BF00120518
Related Publications
- Sakai, R.K., D.R. Fitzjarrald, O.L.L. Moraes, R.M. Staebler, O.C. Acevedo, M.J. Czikowsky, R. Da Silva, E. Brait, and V. Miranda. 2004. Land-use change effects on local energy, water, and carbon balances in an Amazonian agricultural field. Global Change Biology 10(5):895-907. doi:10.1111/j.1529-8817.2003.00773.x
- Acevedo, O.C., O.L.L. Moraes, R. Da Silva, D.R. Fitzjarrald, R.K. Sakai, R.M. Staebler, and M.J. Czikowsky. 2004. Inferring nocturnal surface fluxes from vertical profiles of scalars in an Amazon pasture. Global Change Biology 10(5):886-894. doi:10.1111/j.1529-8817.2003.00755.x