Get Data
Summary:
A mesoscale network has been set up in the
Santarem region of Para, Brazil. This network consists of eight
meteorological
stations named Belterra, Km 117 (Fazenda Sr.
Davi), Mojui, Jamaraqua, Guarana, Embrapa (Cacoal Grande), Vila Franca
and Sudam
(Curua Una).
Belterra and Km 117
stations have been almost continuously collecting
data since August, 1998, respectively. Mojui, Jamaraqua, and Guarana
have been
collecting data since July, 2000. Embrapa, Vila Franca and Sudam
stations have been
collecting data since 2002.
Data are presented in 52 individual comma-separated ASCII files. Each file contains data from one calendar year for one site; both site and year are identified clearly in the data file name and all files follow the same header information and organizational structure. Measurements include air temperature and pressure, wind speed and direction, relative humidity, downward solar radiation, and at some stations soil temperature and moisture.
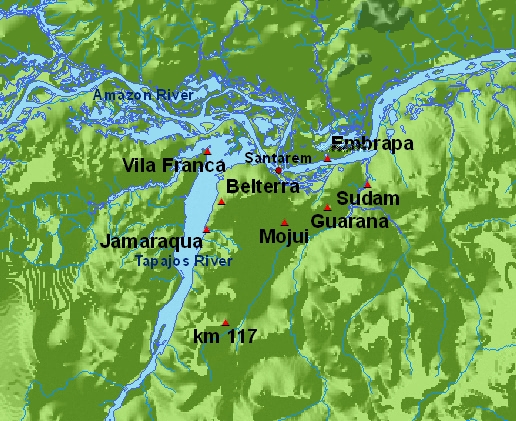
Locations of eight meteorological stations in the Santarem region of Para, Brazil.
Data Citation:
Cite this data set as follows:
Fitzjarrald, D.R., R.K. Sakai and O.L.L. de Moraes. 2009. LBA-ECO CD-03 Mesoscale Meteorological Data, Santarem Region, Para, Brazil: 1998-2006. Data set. Available on-line [http://daac.ornl.gov] from Oak Ridge National Laboratory Distributed Active Archive Center, Oak Ridge, Tennessee, U.S.A. doi:10.3334/ORNLDAAC/944
Implementation of the LBA Data and Publication Policy by Data Users:
The LBA Data and Publication Policy [http://daac.ornl.gov/LBA/lba_data_policy.html] is in effect for a period of five (5) years from the date of archiving and should be followed by data users who have obtained LBA data sets from the ORNL DAAC. Users who download LBA data in the five years after data have been archived must contact the investigators who collected the data, per provisions 6 and 7 in the Policy.
This data set was archived in September of 2009. Users who download the data between September 2009 and August 2014 must comply with the LBA Data and Publication Policy.
Data users should use the Investigator contact information in this document to communicate with the data provider. Alternatively, the LBA Web Site [http://lba.inpa.gov.br/lba/] in Brazil will have current contact information.
Data users should use the Data Set Citation and other applicable references provided in this document to acknowledge use of the data.
Table of Contents:
- 1 Data Set Overview
- 2 Data Characteristics
- 3 Applications and Derivation
- 4 Quality Assessment
- 5 Acquisition Materials and Methods
- 6 Data Access
- 7 References
1. Data Set Overview:
Project: LBA (Large-Scale Biosphere-Atmosphere Experiment in the Amazon)
Activity: LBA-ECO
LBA Science Component: Physical Climate
Team ID: CD-03 (Fitzjarrald / Moraes)
The investigators were Fitzjarrald, David R.; Moraes, Osvaldo Luiz Leal de; Acevedo, Otavio C; Czikowsky, Matthew J.; Sakai, Ricardo and Tsoyreff, Alexander . You may contact Fitzjarrald, Dr. David R. (fitz@asrc.cestm.albany.edu) and Sakai, Dr. Ricardo K. (sakai@asrc.cestm.albany.edu)
LBA Data Set Inventory ID:CD03_Mesoscale_Meteorology
A
mesoscale network has been set up in the
Santarem region, Para. This network consists of eight meteorological stations.
The Belterra and Km 117
stations have been almost continuously
collecting data since August, 1998. Mojui, Jamaraqua, and Guarana have
been collecting data since July, 2000. EMBRAPA, Vila Franca and SUDAM
stations started collecting data in 2002. The sampling interval is 1
measurement for every 2 seconds and data are presented as 1 hour
averages with associated standard deviations as well as minimum and
maximum values for the sampling interval (1 hour). Measurements
include air temperature and pressure, wind speed and direction, relative humidity,
downward solar radiation, and at some stations soil temperature and moisture.
Related Data Sets:
- LBA-ECO CD-03 Eddy Flux and Micrometeorological Data, Pasture Site, Para: 2000-2005 (CO2 flux and micrometeorological data from the km 77 site, Santarem over the same time period)
2. Data Characteristics:
This data set consists of meteorological
data from eight stations located in the region of Santarem, Para.
Belterra and Km 117
stations have been almost
continuously collecting data since August, 1998. Mojui, Jamaraqua, and
Guarana have
been collecting data since July, 2000. EMBRAPA, Vila Franca and SUDAM
stations started
collecting data in 2002.
Data are presented in 52 individual comma-separated ASCII files. Each file contains data from one calendar year for one site; both site and year are identified clearly in the data file name. All files follow the same header information and organizational structure (shown below).
Time series of wind speed, wind direction,
air temperature,
solar radiation, and precipitation from Belterra and Km 117
stations are
available since
late August, 1998. Soil temperature and moisture, and air pressure
sensors were
installed on July, 2000. The met stations consist of a 10 m tower with
a Campbell
Scientific dataloggers, powered by a solar panel. Wind speed and
direction system,
solar radiation sensor, air temperature and RH sensors, and air
pressure sensor were
installed at 10, 9.5, 2, and 1m respectively. Soil temperatures
measurements were
taken at two levels, 0.1, and 1 m, and the soil water content sensor at
0.2 m below
the organic layer. The sampling interval is 1
measurement for every 2 seconds and data are presented as 1 hour
averages with associated standard deviations as well as minimum and
maximum values for the sampling interval (1 hour).
Measurements and Sampling Periods:
| Site / Measurement | 1998 | 1999 | 2000 | 2001 | 2002 | 2003 | 2004 | 2005 | 2006 |
|---|---|---|---|---|---|---|---|---|---|
| Belterra | |||||||||
| Met Station*** | X | X | X | X | X | X | X | X | X |
| Soil Temp 0.05m | X | X | X | X | X | X | X | X | X |
| Soil Temp 1 m | X | X | X | X | X | X | X | X | X |
| Soil moisture 0.2 m | X | X | X | X | X | X | X | X | X |
| Km 117 | |||||||||
| Met Station | X | X | X | X | X | X | X | X | X |
| Soil Temp .05m | X | X | X | X | X | X | X | X | X |
| Soil Temp 1 m | X | X | X | X | X | X | X | ||
| Soil moisture .2 m | X | X | X | X | X | X | X | X | X |
| Guarana | |||||||||
| Met Station | X | X | X | X | X | X | |||
| Soil Temp .05m | X | X | X | X | X | X | |||
| Soil Temp 1 m | X | X | X | X | X | X | |||
| Soil moisture .2 m | X | X | X | X | X | X | |||
| Mojui | |||||||||
| Met Station | X | X | X | X | X | X | X | ||
| Soil Temp 0.05m | X | X | X | X | X | X | X | ||
| Soil Temp 1 m | X | X | X | X | X | X | X | ||
| Soil moisture 0.2 m | X | X | X | X | X | X | X | ||
| Jamaraqua | |||||||||
| Met Station | X | X | X | X | X | X | X | ||
| Soil Temp 0.05m | X | X | X | X | X | X | X | ||
| Soil Temp 1 m | X | X | X | X | X | X | X | ||
| Soil moisture 0.2 m | X | X | X | X | X | X | X | ||
| Embrapa | |||||||||
| Met Station | X | X | X | X | X | ||||
| Soil Temp 0.05m | X | X | X | X | X | ||||
| Soil Temp 1 m | |||||||||
| Soil moisture 0.2 m | X | X | X | X | X | ||||
| Sudam | |||||||||
| Met Station | X | X | X | X | |||||
| Soil Temp 0.05m | X | X | X | X | |||||
| Soil Temp 1 m | |||||||||
| Soil moisture 0.2 m | X | X | X | X | |||||
| V. Franca | |||||||||
| Met Station | X | X | X | X | X | ||||
| Soil Temp 0.05m | X | X | X | X | X | ||||
| Soil Temp 1 m | |||||||||
| Soil moisture 0.2 m | X | X | X | X | X |
***Meteorological Station
measurements reported include: Temperature
air, Relative humidity, Solar
radiation, Air pressure, Wind speed, Wind direction, and Precipitation.
Data Description:
| Heading | Units or Format | Description |
|---|---|---|
| Year | (YYYY) | Year |
| Julian_day | fractional day | Julian day or fractional day (e.g., 1.22917) corresponding to the middle of the averaging period (1 hour) based on GMT. Local time is GMT-4. |
| Hour | fractional hour | Fractional hour corresponding to the middle of the averaging period (1 hour). Using a 24 hour clock based on GMT. |
| T_air | degrees C | Air Temperature |
| RH_air | % | Relative humidity |
| S_dw | W/m2 | Downward solar radiation: 280-2800 nm wavelengths |
| pressure | millibars | Atmospheric pressure with a 1000 mbar offset: ie a reading of 998 mbars is reported as -2 |
| sd_T_air | degrees C | Standard deviation of the air temperature |
| sd_RH_air | % | Standard deviation of relative humidity |
| sd_S_dw | W/m2 | Standard deviation of downward solar radiation |
| sd_press | millibars | Standard deviation of atmospheric pressure |
| sd_WS | m/s | Standard deviation of the mean wind speed |
| wind_speed | m/s | Mean horizontal scalar wind speed |
| vector_WS | m/s | Mean horizontal resultant vector wind speed |
| WD | degrees | Mean horizontal resultant vector wind direction |
| sd_WD | degrees | Standard deviation of the wind direction |
| max_T_air | degrees C | Maximum recorded air temperature |
| max_RH_air | % | Maximum recorded relative humidity |
| max_S_dw | W/m2 | Maximum recorded downward solar radiation |
| max_press | millibars | Maximum recorded air pressure |
| max_WS | m/s | Maximum recorded wind speed |
| min_T_air | degrees C | Minimum recorded air temperature |
| min_RH_air | % | Minimum recorded relative humidity |
| min_S_dw | W/m2 | Minimum recorded downward solar radiation |
| min_press | millibars | Minimum recorded air pressure |
| min_WS | m/s | Minimum recorded wind speed |
| precip | mm | Total precipitation for the one hour sampling interval |
| Tsoil_1 | degrees C | Soil temperature 0.05 m depth in degrees C |
| Tsoil_2 | degrees C | Soil temperature 1 m depth in degrees C |
| soil_moisture | % | Soil moisture at 0.2 m depth: reported as percent on a volume basis |
| sd_Tsoil_1 | degrees C | Standard deviation of soil temperature 0.05 m depth |
| sd_Tsoil_2 | degrees C | Standard deviation of soil temperature 1 m depth |
| sd_soil_moisture | % | Standard deviation of soil moisture at 0.2 m depth |
| batt | V | Battery charge |
Example Data Records:
Missing data is represented by -9999.
Placeholder missing values are
included
in a data file even when a parameter was not measured at that site to
maintain consistent file format across files from all sites / years.
Data records from file cd03_belterra_1998_hourly_met_data.csv
|
Year,Julian_day,Hour,T_air,RH_air,S_dw,pressure,sd_T_air,sd_RH_air,sd_S_dw,sd_press,sd_WS,wind_speed, vector_WS,WD,sd_WD,max_T_air,max_RH_air,max_S_dw,max_press,max_WS,min_T_air,min_RH_air, min_S_dw,min_press,min_WS,precip,Tsoil_1,Tsoil_2,soil_moisture,sd_Tsoil_1,sd_Tsoil_2,sd_soil_moisture,batt 1998,233.8125,19.5,32.75,52.81,461.31,-9999,0.32,1.57,162.7,-9999,0.94,2.79, 2.52,99.3,25.01,33.42,56.91,684.68,-9999,6.4,32.04,49.18, 94.03,-9999,0.8,0,-9999,-9999,-9999,-9999,-9999,-9999,-9999 1998,233.85417,20.5,31.85,58.46,249.93,-9999,0.39,2.04,73.5,-9999,0.85,2.29, 2.1,98.8,23.39,32.5,62.65,384.49,-9999,5.6,31.06,54.05, 129.05,-9999,0,0,-9999,-9999,-9999,-9999,-9999,-9999,-9999 ... 1998,365.9375,22.5,26.7,79.2,0,-9999,0.43,2.21,0.04,-9999,0.47,1.29, 1.24,125.1,15.48,27.56,82.2,0.65,-9999,2.4,26.22,74.3, -0.65,-9999,0,0,-9999,-9999,-9999,-9999,-9999,-9999,-9999 1998,365.97917,23.5,25.97,82.9,0,-9999,0.17,1.4,0.02,-9999,0.47,1.52, 1.48,130.4,14.12,26.31,85.6,0,-9999,3.2,25.71,80.2, -0.65,-9999,0,0,-9999,-9999,-9999,-9999,-9999,-9999,-9999 |
Site boundaries: (All latitude and longitude given in degrees and fractions)
| Site (Region) | Westernmost Longitude | Easternmost Longitude | Northernmost Latitude | Southernmost Latitude | Geodetic Datum |
|---|---|---|---|---|---|
| Para Western (Santarem) - Fazenda Sr. David (km 117) (Para Western (Santarem)) | -54.924 | -54.924 | -3.3502 | -3.35 | World Geodetic System, 1984 (WGS-84) |
| Para Western (Santarem) - Jamaraqua - Santarem River Site (Para Western (Santarem)) | -55.03639 | -55.03639 | -2.80639 | -2.80639 | World Geodetic System, 1984 (WGS-84) |
| Para Western (Santarem) - Mojui (Para Western (Santarem)) | -54.57917 | -54.57917 | -2.76667 | -2.76667 | World Geodetic System, 1984 (WGS-84) |
| Para Western (Santarem) - Belterra (Para Western (Santarem)) | -54.94361 | -54.94361 | -2.6431 | -2.6431 | World Geodetic System, 1984 (WGS-84) |
| Para Western (Santarem) - Guarana (Para Western (Santarem)) | -54.32472 | -54.32472 | -2.67694 | -2.67694 | World Geodetic System, 1984 (WGS-84) |
| Para Western (Santarem) - Cacoal Grande (Para Western (Santarem)) | -54.32861 | -54.32861 | -2.38944 | -2.38944 | World Geodetic System, 1984 (WGS-84) |
| Para Western (Santarem) - Vila Franca (Para Western (Santarem)) | -55.02889 | -55.02889 | -2.34861 | -2.34861 | World Geodetic System, 1984 (WGS-84) |
| Para Western (Santarem) - Curua Una (Para Western (Santarem)) | -54.09083 | -54.09083 | -2.54417 | -2.54417 | World Geodetic System, 1984 (WGS-84) |
Time period:
- The data set covers the period 1998/08/20 to 2006/12/31.
- Temporal Resolution:Hourly
Platform/Sensor/Parameters measured include:
- METEOROLOGICAL STATION / AIR THERMOMETER (VAISALA, HMP45C) / AIR TEMPERATURE
- METEOROLOGICAL STATION / HUMIDITY SENSOR (VAISALA, HMP45C) / HUMIDITY
- METEOROLOGICAL STATION / CUP ANEMOMETER (MET ONE 014A, 034A-L) / WIND SPEED
- METEOROLOGICAL STATION / WIND VANE (MET ONE 024, 034A-L) / WIND DIRECTION
- METEOROLOGICAL STATION / PYRANOMETER (LICOR, LI-200SZ) / SOLAR RADIATION
- METEOROLOGICAL STATION / BAROMETER (VAISALA, PTB 101) / ATMOSPHERIC PRESSURE
- METEOROLOGICAL STATION / RAIN GAGE (CAMPBELL, TE525MM) / PRECIPITATION AMOUNT
- METEOROLOGICAL STATION / THERMISTOR (CAMPBELL, 107) / SOIL TEMPERATURE
- METEOROLOGICAL STATION / TIME DOMAIN REFLECTOMETER (CAMPBELL, CS615) / SOIL MOISTURE/WATER CONTENT
3. Data Application and Derivation:
This CD-03 effort aims to assess how the
special mesoclimatic characteristics of the LBA Santarem
study area might introduce a bias in standard climatic variables and,
potentially, in ecosystem productivity estimates. In the Santarem study
areas, for example, the tall flux towers are located in a thin area of
forest sandwiched between cleared lands and near to large rivers that
are known to influence cloudiness and alter winds in their proximity.
The mesoclimate of the region must be understood before results
regarding net forest carbon uptake can be generalized.
The need to document radiation, rainfall and temperature anomalies led
to the development of a network of eight surface weather stations.
Results for the first six years of data indicate that that temperature
and precipitation are higher and wind speed is lower during the LBA-ECO
years compared to the recent past. The daily averaged wind speed at
Santarem correlates well with the observed Belem-Santarem surface
pressure difference. From composite data we deduced the river breeze
pressure gradient forcing, and identified double diurnal peaks in
precipitation and specific humidity. The precipitation peak in the
early morning hours is consistent with previous studies of propagating
squall line circulations from the Atlantic coast. However, for inland
areas away from the rivers, the nocturnal period precipitation
contributes less than half of total precipitation. Nocturnal flows
following local topographic gradients are seen, including the terral
along the Tapajos River south of Jamaraqua identified by Bates (1864).
The most striking mesoclimatic difference is in incident solar
radiation and its variation. Owing to over-river clearing provoked by
the daytime river breeze, there is 20-30% more incident radiation along
the river than inland. The corresponding diminution in the standard
deviation of the solar radiation verifies the diminished cloudiness. A
large-scale rainfall increase just to the west of Santarem manifests
itself locally as a 'tongue' of enhanced rain from along the wide area
of open water at the Tapajos-Amazon confluence. The Amazon River breeze
circulation affects rainfall more than does the Tapajos breeze, which
moves contrary to the predominant wind. East of the riverbank the
Tapajos breeze influence on precipitation extends only a few kilometers
inland. Rainfall increases to the north of the Amazon, possibly the
result uplift over elevated terrain. Dry season rainfall increases by
up to 30% going away from the Amazon River, as would be expected given
breeze subsidence over the river. This reinforces the idea that
stations close to the rivers are biased. These results indicate the
data from the standard climatic stations, all located near the river,
be used in producing model parameterizations only after allowing for
these mesoclimatic biases.
4. Quality Assessment:
There are no known problems with these data.
5. Data Acquisition Materials and Methods:
The met stations consist of a 10 m tower with a Campbell Scientific dataloggers, powered by a solar panel. Data are sampled at 0.5 Hz and a mean, standard deviation and both minimum and maximum values are recorded at hourly intervals for most variables. Precipitation is the cumulative amount for the entire sampling period. The sensors used and installation arrangements at each site are listed below.
Sensor positions (Belterra, Km 117
, Mojui,
Guarana, Jamaraqua):
- Air temperature and relative humidity, (Vaisala, model HMP45C): 2.5 m
- Downward solar radiation, (Licor, model LI200Sz): 8.5 m
- Windspeed and direction, (Met One, model 034A): 10 m
- Pressure,(Vaisala, model PTB101B): 1.9 m(Km 117), 1.7m (Belterra,Mojui, Guarana, Jamaraqua)
- Precipitation, (Texas inst., model TE525): 0.5 m
- Soil temperature 1, (Campbell, model 107): 0.05 m
- Soil temperature 2, (Campbell, model 107): 1 m
- Soil moisture, (Campbell, model CS615): 0.2 m
Sensor positions (Embrapa, V. Franca, Sudam):
- Air temperature and relative humidity: 3 m
- Downward solar radiation: 3 m
- Windspeed and direction: 3 m
- Pressure(Vaisala, model PTB101B): 1.7 m
- Precipitation (Texas inst., model TE525): 0.5 m
- Soil temperature 1(Campbell, model 107): 0.05 m
- Soil temperature 2(Campbell, model 107): NA
- Soil moisture (Campbell, model 615): 0.2 m
Collection periods for meteorological and soil measurements varied by site and are listed in the accompanying documentation.
Sensors used include:
- AIR THERMOMETER (VAISALA, HMP45C)
- HUMIDITY SENSOR (VAISALA, HMP45C)
- CUP ANEMOMETER (MET ONE 014A, 034A-L)
- WIND VANE (MET ONE 024, 034A-L)
- PYRANOMETER (LICOR, LI-200SZ)
- BAROMETER (VAISALA, PTB 101)
- RAIN GAGE (CAMPBELL, TE525MM)
- THERMISTOR (CAMPBELL, 107)
- TIME DOMAIN REFLECTOMETER (CAMPBELL, CS615)
6. Data Access:
This data is available through the Oak Ridge National Laboratory (ORNL) Distributed Active Archive Center (DAAC).
Data Archive Center:
Contact for Data Center Access Information:
E-mail: uso@daac.ornl.gov
Telephone: +1 (865) 241-3952
7. References:
Bates, H.W., 1864. A Naturalist on the River Amazons, second edition, reprinted by U. Cal. Press, 1962, 465 pp.
Related Publications
- Fitzjarrald D.R., Sakai, R.K., Moraes, O.M.M., Cosme, R.O., Acevedo, O.C., and Czikowsky, M.J. 2008. Spatial and temporal rainfall variability near the Amazon-Tapajos confluence. Submitted to Journal of Geophysical Research Biogeosciences.