Documentation Revision Date: 2016-08-08
Data Set Version: V1
Summary
During this intensive campaign, multiple investigators from several institutions fielded similar/related instruments that yielded comparable and complementary results. Please read the data file descriptions carefully and refer to Martin et al. (2010a) for clarifying instrument, sampling, and analysis details.
There are 36 data files in comma-separated (.csv) format with this data set.
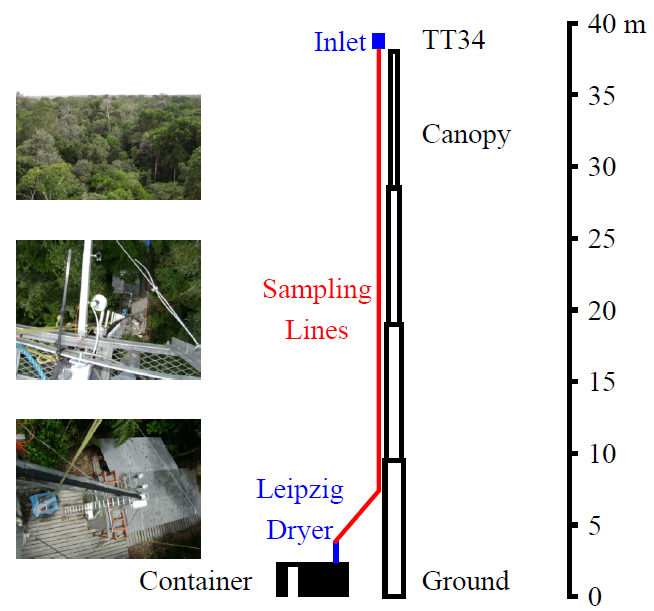
Figure 1. View from Tower TT34 and diagram of sampling line and tower heights.
Citation
Martin, S.T., P.E. Artaxo, Q. Chen, A.B. Guenther, S.S. Gunthe, J.L. Jimenez, A. Manzi, K.L. Prenni, U. Poschl, J. Schneider, and E. Swietlicki. 2016. AMAZE-08 Aerosol Characterization and Meteorological Data, Central Amazon Basin: 2008. ORNL DAAC, Oak Ridge, Tennessee, USA. http://dx.doi.org/10.3334/ORNLDAAC/1308
Table of Contents
- Data Set Overview
- Data Characteristics
- Application and Derivation
- Quality Assessment
- Data Acquisition, Materials, and Methods
- Data Access
- References
Data Set Overview
Project: The Large-Scale Biosphere-Atmosphere Experiment in Amazonia (LBA)
The Amazon Basin provides an excellent environment for studying the sources, transformations, and properties of natural aerosol particles and the resulting links between biological processes and climate. With this framework in mind, AMAZE-08, carried out from 7 February – 14 March 2008 during the wet season in the central Amazon Basin, sought to understand the formation, transformations, and cloud-forming properties of fine- and coarse-mode biogenic aerosol particles, especially as related to their effects on cloud activation and regional climate. Special foci included: The production mechanisms of secondary organic components at a pristine continental site, including the factors regulating their temporal variability. And, predicting and understanding the cloud-forming properties of biogenic particles at such a site.
For additional research results, please refer to the Atmospheric Chemistry and Physics special issue (http://www.atmos-chem-phys.net/special_issue141.html) which brings together a collection of publications on measurements of the Amazonian Aerosol Characterization Experiment 2008 (AMAZE-08). In particular, see the overview article for AMAZE-08 (Martin et al., 2010a).
Acknowledgements: Support was received from the US National Science Foundation, the Brazil LBA Millennium Institute, the Max Planck Society, the Brazilian Large-Scale Biosphere-Atmosphere Experiment, the European Integrated project on Aerosol Cloud Climate and Air Quality Interactions (EUCAARI), and the US National Aeronautics and Space Administration.
Implementation of the LBA Data and Publication Policy by Data Users:
The LBA Data and Publication Policy [http://daac.ornl.gov/LBA/lba_data_policy.html] is in effect for a period of five (5) years from the date of archiving and should be followed by data users who have obtained LBA data sets from the ORNL DAAC. Users who download LBA data in the five years after data have been archived must contact the investigators who collected the data, per provisions 6 and 7 in the Policy.
This data set was archived in May of 2016. Users who download the data between May 2016 and April 2020 must comply with the LBA Data and Publication Policy.
Data users should use the Investigator contact information in this document to communicate with the data provider. Alternatively, the LBA Web Site [http://lbaeco-archive.ornl.gov/] in Brazil will have current contact information.
Data users should use the Data Set Citation and other applicable references provided in this document to acknowledge use of the data.
LBA was an intensive scientific investigation of the tropical rainforest of Brazil and portions of adjacent countries. This project used intensive remote-sensing techniques and ground-based experiments to investigate the atmosphere-biosphere-hydrosphere dynamics of this large tropical region. The LBA Project encompasses several scientific disciplines, or components. The LBA-ECO component focuses on the question: "How do tropical forest conversion, regrowth, and selective logging influence carbon storage, nutrient dynamics, trace gas fluxes, and the prospect for sustainable land use in Amazonia?"
Data Characteristics
Spatial Coverage: Central Amazon Basin northwest of Manaus, Brazil
Spatial Resolution: Point. Tower-based measurements
Temporal Coverage: 20080204 to 20080421
Temporal Resolution: Varies by instrument
Site boundaries: (All latitude and longitude given in degrees and fractions)
|
Site (Region) |
Westernmost Longitude |
Easternmost Longitude |
Northernmost Latitude |
Southernmost Latitude |
|
Central Amazon Basin |
-60.36782 |
-60.02723 |
-2.42820 |
-2.75745 |
Data Descriptions
There are 36 comma-separated data files (.csv) with this data set. The data files are named according to the sampling/measuring instrument, affiliation, or variable abbreviation, as appropriate, and also the individual data provider.
All measurements were made at the tower TT34, with the exception of the pyranometer and PAR measurements which were made at tower K34.
This table lists the 36 data files in the order they are described below.
|
|
File Names |
|
1 |
AMAZE08_Aethelometer_ARTAXO.csv |
|
2 |
AMAZE08_Filter_Dichotomous_ICandOCanalysis_FineCoarse_ARTAXO.csv |
|
3 |
AMAZE08_Filter_ICanalysis_SFU_FineCoarse_ARTAXO.csv |
|
4 |
AMAZE08_Filter_ICanalysis_Total_ARTAXO.csv |
|
5 |
AMAZE08_Filter_PIXEanalysis_SFU_fine_coarse_ARTAXO.csv |
|
6 |
AMAZE08_Filter_PIXEanalysis_Total_ARTAXO.csv |
|
7 |
AMAZE08_MAAP_ARTAXO.csv |
|
8 |
AMAZE08_Nephelometer_ARTAXO.csv |
|
9-13 |
AMAZE08_CCN_KappaValue_ActivationDiam_0_10_SS_ POESCHL.csv AMAZE08_CCN_KappaValue_ActivationDiam_0_19_SS_POESCHL.csv AMAZE08_CCN_KappaValue_ActivationDiam_0_28_SS_POESCHL.csv AMAZE08_CCN_KappaValue_ActivationDiam_0_46_SS_POESCHL.csv AMAZE08_CCN_KappaValue_ActivationDiam_0_82_SS_POESCHL.csv |
|
14 |
AMAZE08_UVAPS_POESCHL.csv |
|
15 |
AMAZE08_Environmental_tower_ground_Martin.csv |
|
16 |
AMAZE08_Harvard_Enviro_SamplingLine_Martin.csv |
|
17 |
AMAZE08_SunTimes_Martin.csv |
|
18 |
AMAZE08_Rainfall_MARTIN.csv |
|
19 |
AMAZE08_AMS_Harvard_ElementalRatios_Martin.csv |
|
20 |
AMAZE08_AMS_Harvard_MassConcentrations_Martin.csv |
|
21 |
AMAZE08_AMS_Harvard_PMFfactorLoadings.csv |
|
22 |
AMAZE08_AMS_Harvard_SonicAnemometer_Jimenez.csv |
|
23 |
AMAZE08_OPC_WELAS_TopTower_Schneider.csv |
|
24 |
AMAZE08_OPC_WELAS_ResearchTrailer_Schneider.csv |
|
25 |
AMAZE08_OPC_GRIMM_Schneider.csv |
|
26 |
AMAZE08_CPC_SCHNEIDER.csv |
|
27 |
AMAZE08_AMS_MPI_MassConcentrations_Schneider.csv |
|
28 |
AMAZE08_SMPS_Diameters_SWIETLICKI.csv |
|
29 |
AMAZE08_SMPS_Concentrations_SWIETLICKI.csv |
|
30 |
AMAZE08_SMPS_IntegratedQuantities_SWIETLICKI.csv |
|
31 |
AMAZE08_SonicAnemometer_GUENTHER.csv |
|
32 |
AMAZE08_TraceGases_GUENTHER.csv |
|
33 |
AMAZE08_MixingRatios_GUENTHER.csv |
|
34 |
AMAZE08_Pyranometer_MANZI.csv |
|
35 |
AMAZE08_PAR_MANZI.csv |
|
36 |
AMAZE08_CFDC_PRENNI.csv |
Data File Format
Each file has several header rows with general information about the data and the file contents that precedes the data rows. For example:
|
[Header Rows] Data file name: AMAZE08_AMS_Harvard_MassConcentrations_Martin.csv [Data Begins] TT34,2008-02-07,00:32:47,3411333167,0.21158,-0.00114272,0.00440575,0.000557228,-0.00113304 |
Data Descriptions
Data file name: AMAZE08_Aethelometer_ARTAXO.csv |
|
Instrument: Aethelometer (affiliation: Univ of Sao Paulo (USP)) |
|
Measurements reported: Black carbon concentration as derived from aerosol light absorption at listed wavelengths (nm) from an aethelometer for the period February 11, 2008 - March 14, 2008 at Tower TT34. |
|
Data reporting frequency: Hourly (60 min average) |
|
Column Name |
Units/format |
Description |
|
Site |
|
Tower TT34 or Tower K34 |
|
Date_utc |
yyyy-mm-dd |
Date of measurement |
|
Time_utc |
hh:mm:ss |
Time of measurement |
|
Seconds_since_1Jan1900 |
second |
Time of measurement in seconds since 1 Jan 1900 |
|
450_nm |
ng m^-3 |
black carbon concentration |
|
571_nm |
ng m^-3 |
black carbon concentration |
|
590_nm |
ng m^-3 |
black carbon concentration |
|
615_nm |
ng m^-3 |
black carbon concentration |
|
660_nm |
ng m^-3 |
black carbon concentration |
|
880_nm |
ng m^-3 |
black carbon concentration |
|
950_nm |
ng m^-3 |
black carbon concentration |
Data file name: AMAZE08_Filter_Dichotomous_ICandOCanalysis_FineCoarse_ARTAXO.csv |
|
Instrument: Rupprecht Virtual Dichotomous sampler in coarse mode (2 to 10 um) and fine mode (<2-um). |
|
Measurements reported: Analysis of filters collected at TT34 tower with a Rupprecht Virtual Dichotomous sampler, ground level sampling, in coarse mode (2 to 10-um), and fine mode (<2-um). |
|
Data reporting frequency: One time per day for each mode |
|
Column Name |
Units/format |
Description |
|
Site |
|
Tower TT34 or Tower K34 |
|
label |
|
Sample label (coarse or fine) |
|
Start_date_utc |
yyyy-mm-dd |
Start date of measurement |
|
Start_time_utc |
hh:mm:ss |
Start time of measurement |
|
Start_seconds_since_1Jan1900 |
Seconds |
Start time of measurement in seconds since 1 Jan 1900 |
|
Stop_date_utc |
yyyy-mm-dd |
Stop date of measurement |
|
Stop_time_utc |
hh:mm:ss |
Stop time of measurement |
|
Stop_seconds_since_1Jan1900 |
Seconds_since_1Jan1900 |
Stop time of measurement in seconds since 1Jan1900 |
|
mass |
ug m^-3 |
Aerosol sample mass |
|
OC |
ug m^-3 |
Organic carbon |
|
EC |
ug m^-3 |
Elemental carbon |
|
Cl |
ug m^-3 |
chloride |
|
NO3 |
ug m^-3 |
nitrate |
|
PO43 |
ug m^-3 |
phosphate |
|
SO42 |
ug m^-3 |
sulfate |
|
-OOCCOO- |
ug m^-3 |
oxalate |
|
Na |
ug m^-3 |
sodium |
|
NH4 |
ug m^-3 |
ammonium |
|
K |
ug m^-3 |
potassium |
|
Mg |
ug m^-3 |
magnesium |
|
Ca |
ug m^-3 |
calcium |
Data file name: AMAZE08_Filter_ICanalysis_SFU_FineCoarse_ARTAXO.csv |
|
Instrument: Stacked filter unit (SFU) in coarse mode (2 to 10 um) and fine mode (<2um). |
|
Measurements reported: Mass measurements of ions collected with the SFU), fine and coarse modes. Made at the TT34 tower at 10-m for 11 days during February 10, 2008 – March 21, 2008 (every 3-4 days). |
|
Data reporting frequency: One time per day for each mode |
|
Missing Values reported as "none" are represented as -9999 |
|
Column Name |
Units/format |
Description |
|
Site |
|
Either Tower TT34 or Tower K34 |
|
label |
|
Sample label |
|
Coarse_Fine |
|
Coarse or fine mode |
|
volume |
m^3 |
Sample volume |
|
Start_date_utc |
yyyy-mm-dd |
Start date of measurement |
|
Start_time_utc |
hh:mm:ss |
Start time of measurement |
|
Start_seconds_since_1Jan1900 |
seconds |
Start time of measurement in seconds since 1Jan1900 |
|
Stop_date_utc |
yyyy-mm-dd |
Stop date of measurement |
|
Stop_time_utc |
hh:mm:ss |
Stop time of measurement |
|
Stop_seconds_since_1Jan1900 |
seconds |
Stop time of measurement in seconds since 1Jan1900 |
|
NH4 |
ug m^-3 |
ammonium |
|
Na |
ug m^-3 |
sodium |
|
K |
ug m^-3 |
potassium |
|
Mg2 |
ug m^-3 |
magnesium |
|
Ca2 |
ug m^-3 |
calcium |
|
F |
ug m^-3 |
fluoride |
|
CH3COO |
ug m^-3 |
acetate |
|
HCOO |
ug m^-3 |
formate |
|
Cl |
ug m^-3 |
chloride |
|
Br |
ug m^-3 |
bromide |
|
NO3 |
ug m^-3 |
nitrate |
|
SO42 |
ug m^-3 |
sulfate |
|
PO43 |
ug m^-3 |
phosphate |
Data file name: AMAZE08_Filter_ICanalysis_Total_ARTAXO.csv |
|
Instrument: Harvard aerosol mass spectrometer (AMS) |
|
Measurements reported: Total filter mass of ions from samples collected from the turbulent inlet at the top of tower TT34, for 11 days during February 10, 2008 – March 21, 2008 (every 3-4 days). |
|
Data reporting frequency: One time per day for each mode |
|
Missing Values reported as "none" are represented as -9999 |
|
Column Name |
Units/format |
Description |
|
Site |
|
Either Tower TT34 or Tower K34 |
|
label |
|
Sample label |
|
volume |
m^3 |
Sample volume |
|
Start_date_utc |
yyyy-mm-dd |
Start date of measurement |
|
Start_time_utc |
hh:mm:ss |
Start time of measurement |
|
Start_seconds_since_1Jan1900 |
seconds |
Start time of measurement in seconds since 1Jan1900 |
|
Stop_date_utc |
yyyy-mm-dd |
Stop date of measurement |
|
Stop_time_utc |
hh:mm:ss |
Stop time of measurement |
|
Stop_seconds_since_1Jan1900 |
seconds |
Stop time of measurement in seconds since 1Jan1900 |
|
NH4 |
ug m^-3 |
ammonium |
|
Na |
ug m^-3 |
sodium |
|
K |
ug m^-3 |
potassium |
|
Mg2 |
ug m^-3 |
magnesium |
|
Ca2 |
ug m^-3 |
calcium |
|
F |
ug m^-3 |
fluoride |
|
CH3COO |
ug m^-3 |
acetate |
|
HCOO |
ug m^-3 |
formate |
|
Cl |
ug m^-3 |
chloride |
|
Br |
ug m^-3 |
bromide |
|
NO3 |
ug m^-3 |
nitrate |
|
SO42 |
ug m^-3 |
sulfate |
|
PO43 |
ug m^-3 |
phosphate |
Data file name: AMAZE08_Filter_PIXEanalysis_SFU_fine_coarse_ARTAXO.csv |
|
Instrument: Metals were analyzed by particle induced x-ray emission (PIXE). |
|
Measurements reported: Aerosol samples were collected at the TT34 tower at 10-m with a stacked filter unit (SFU) in coarse mode (2 to 10 um), and fine mode (<2um), for the period February 10, 2008 - March 21, 2008 |
|
Data reporting frequency: One time per day for each mode every 3-4 days |
|
Missing Values reported as "none" are represented as -9999 |
|
Column Name |
Units/format |
Description |
|
Site |
|
Either Tower TT34 or Tower K34 |
|
label |
|
Sample label |
|
Coarse_Fine |
|
Coarse or fine mode |
|
volume |
m^3 |
Sample volume |
|
Start_date_utc |
yyyy-mm-dd |
Start date of measurement |
|
Start_time_utc |
hh:mm:ss |
Start time of measurement |
|
Start_seconds_since_1Jan1900 |
seconds |
Start time of measurement in seconds since 1Jan1900 |
|
Stop_date_utc |
yyyy-mm-dd |
Stop date of measurement |
|
Stop_time_utc |
hh:mm:ss |
Stop time of measurement |
|
Stop_seconds_since_1Jan1900 |
seconds |
Stop time of measurement in seconds since 1Jan1900 |
|
mass |
ug m^-3 |
Aerosol sample mass |
|
Ce |
ug m^-3 |
cerium |
|
Al |
ug m^-3 |
aluminum |
|
Si |
ug m^-3 |
silicon |
|
P |
ug m^-3 |
phosphorus |
|
S |
ug m^-3 |
sulfur |
|
Cl |
ug m^-3 |
chlorine |
|
K |
ug m^-3 |
potassium |
|
Ca |
ug m^-3 |
calcium |
|
Ti |
ug m^-3 |
titanium |
|
V |
ug m^-3 |
vanadium |
|
Cr |
ug m^-3 |
chromium |
|
Mn |
ug m^-3 |
manganese |
|
Fe |
ug m^-3 |
iron |
|
Ni |
ug m^-3 |
nickel |
|
Cu |
ug m^-3 |
copper |
|
Zn |
ug m^-3 |
zinc |
|
Br |
ug m^-3 |
bromine |
Data file name: AMAZE08_Filter_PIXEanalysis_Total_ARTAXO.csv |
|
Instrument: Harvard aerosol mass spectrometer (AMS) and metals analysis by particle induced x-ray emission (PIXE). |
|
Measurements reported: Aerosol samples were collected by total filter from the turbulent inlet at the top of Tower TT34 for the period February 10, 2008 - March 21, 2008. Total mass of aerosols and metal constituents are reported. |
|
Data reporting frequency: One time per day for each mode every 3-4 days |
|
Missing Values reported as "none" are represented as -9999 |
|
Column Name |
Units/format |
Description |
|
Site |
|
Either Tower TT34 or Tower K34 |
|
label |
|
Sample label |
|
volume |
m^3 |
Sample volume |
|
Start_date_utc |
yyyy-mm-dd |
Start date of measurement |
|
Start_time_utc |
hh:mm:ss |
Start time of measurement |
|
Start_seconds_since_1Jan1900 |
seconds |
Start time of measurement in seconds since 1Jan1900 |
|
Stop_date_utc |
yyyy-mm-dd |
Stop date of measurement |
|
Stop_time_utc |
hh:mm:ss |
Stop time of measurement |
|
Stop_seconds_since_1Jan1900 |
seconds |
Stop time of measurement in seconds since 1Jan1900 |
|
mass |
ug m^-3 |
Aerosol sample mass |
|
Ce |
ug m^-3 |
cerium |
|
Al |
ug m^-3 |
aluminum |
|
Si |
ug m^-3 |
silicon |
|
P |
ug m^-3 |
phosphorus |
|
S |
ug m^-3 |
sulfur |
|
Cl |
ug m^-3 |
chlorine |
|
K |
ug m^-3 |
potassium |
|
Ca |
ug m^-3 |
calcium |
|
Ti |
ug m^-3 |
titanium |
|
V |
ug m^-3 |
vanadium |
|
Cr |
ug m^-3 |
chromium |
|
Mn |
ug m^-3 |
manganese |
|
Fe |
ug m^-3 |
iron |
|
Ni |
ug m^-3 |
nickel |
|
Cu |
ug m^-3 |
copper |
|
Zn |
ug m^-3 |
zinc |
|
Br |
ug m^-3 |
bromine |
Data File name: AMAZE08_MAAP_ARTAXO.csv |
|
Instrument used: Multi-angle absorption photometer (MAAP) |
|
Measurements reported: Black carbon equivalent concentrations from light absorption of deposited particles at 673 nm for the period February 8, 2008 - March 14, 2008 at Tower TT34. |
|
Data reporting frequency: 60 min |
|
Column Name |
Units/format |
Description |
|
Site |
|
Either Tower TT34 or Tower K34 |
|
Date_utc |
yyyy-mm-dd |
Date of measurement |
|
Time_utc |
hh:mm:ss |
Time of measurement |
|
Seconds_since_1Jan1900 |
seconds |
Time of measurement in seconds since 1Jan1900 |
|
BC_Equiv_Conc |
ug m^-3 |
black carbon equivalent concentrations |
Data file name: AMAZE08_Nephelometer_ARTAXO.csv |
|
Instrument: Nephelometer (affiliation: Univ of Sao Paulo (USP) |
|
Measurements reported: aerosol light scattering-backscattering at multiple wavelengths or the period February 17, 2008 - March 12, 2008 at Tower TT34. |
|
Reporting frequency: 5 min |
|
Column Name |
Units/format |
Description |
|
Site |
|
Either Tower TT34 or Tower K34 |
|
Date_utc |
yyyy-mm-dd |
Date of measurement |
|
Time_utc |
hh:mm:ss |
Time of measurement |
|
Seconds_since_1Jan1990 |
seconds |
Time of measurement in seconds since 1Jan1900 |
|
Scat_Blue_450nm |
1/m |
scattering-backscattering at specified wavelengths |
|
Scat_Green_550nm |
1/m |
scattering-backscattering at specified wavelengths |
|
Scat_Red_700nm |
1/m |
scattering-backscattering at specified wavelengths |
|
Backscatter_Blue |
1/m |
scattering-backscattering at specified wavelengths |
|
Backscatter_Green |
1/m |
scattering-backscattering at specified wavelengths |
|
Backscatter_Red |
1/m |
scattering-backscattering at specified wavelengths |
|
Pressure |
mbar |
Sampling conditions, atmospheric pressure |
|
Sample_Temp |
degrees C |
Sampling conditions, temperature |
|
Inlet_Temp |
degrees C |
Sampling conditions, inlet temperature |
|
RH |
% |
Sampling conditions, relative humidity |
|
Ang_Coef_RG |
unitless |
|
|
Ang_Coef_RB |
unitless |
|
|
Ang_Coef_GB |
unitless |
|
|
Ang_Coef_Avg |
unitless |
|
There are five (5) data files for Cloud Condensation Nuclei (CCN) with supersaturation (SS) as given in file name.
|
Data files names: AMAZE08_CCN_KappaValue_ActivationDiam_0_10_SS_ POESCHL.csvAMAZE08_CCN_KappaValue_ActivationDiam_0_19_SS_POESCHL.csvAMAZE08_CCN_KappaValue_ActivationDiam_0_28_SS_POESCHL.csvAMAZE08_CCN_KappaValue_ActivationDiam_0_46_SS_POESCHL.csvAMAZE08_CCN_KappaValue_ActivationDiam_0_82_SS_POESCHL.csv |
|
Instrument: Differential mobility analyzer with Max Planck Institute (MPI) CCNC & CPC. |
|
Measurements reported: Cloud condensation nuclei (CCN) data approximately every 3 hours (hourly on some dates) for the period February 14, 2008 – March 12, 2008 at Tower TT34. Supersaturation (SS) = 0.10%, 0.19%, 0.28%, 0.46%, and 0.82% Kappa value: MPI CCNC (SS as specified) -- Kappa value corresponding to SS value and observed dry diameter (taken as equal to RH30% diameter) of 50% activation. Diameter D50: MPI CCNC (SS as specified) -- diameter of 50% activation. |
|
Data reporting frequency: approximately every 3 hours (hourly on some dates) |
Format of five CCN data files:
|
Column Name |
Units/format |
Description |
|
Site |
|
Either Tower TT34 or Tower K34 |
|
Date_utc |
yyyy-mm-dd |
Date of measurement |
|
Time_utc |
hh:mm:ss |
Time of measurement |
|
Seconds_since_1Jan1900 |
Seconds |
Time of measurement in seconds since 1Jan1900 |
|
Kappa_value |
|
Kappa value corresponding to SS value and observed dry diameter (taken as equal to RH30% diameter) of 50% activation |
|
Diameter_D50 |
nm |
Diameter D50: MPI CCNC (SS as specified) -- diameter of 50% activation |
Data file name: AMAZE08_UVAPS_POESCHL.csv |
|
Instrument: ultraviolet aerodynamic particle sizer (UV-APS) (affiliation - Max Planck Institute for Chemistry) |
|
Measurements reported: The number-size distribution of coarse-mode fluorescent biological aerosol particles (size range ( 0.5–10 um)) for the period February 7, 2008 – February 22, 2008 at Tower TT34. Refer to Huffman et al., 2012 for additional details. |
|
Data reporting frequency: 5 minutes |
|
Column Name |
Units/format |
Description |
|
Site |
|
Either Tower TT34 or Tower K34 |
|
Date_utc |
yyyy-mm-dd |
Date of measurement |
|
Time_utc |
hh:mm:ss |
Time of measurement |
|
Seconds_since_1Jan1900 |
Seconds |
Time of measurement in seconds since 1Jan1900 |
|
Total_Conc |
# cm^-3 |
Number concentration of total aerosol particles |
|
Bio_Conc |
# cm^-3 |
Number concentration of biological aerosol particles |
Data file name: AMAZE08_Environmental_tower_ground_Martin.csv |
|
Instrument: No details provided |
|
Measurements reported: Temperature (Temp) and relative humidity (RH) measurements from the tower and ground for the period February 11 – March 14, 2008 at Tower TT34. |
|
Data reporting frequency: 5 min average on 10 sec data |
|
Column Name |
Units/format |
Description |
|
Site |
|
Either Tower TT34 or Tower K34 |
|
Date_utc |
yyyy-mm-dd |
Date of measurement |
|
Time_utc |
hh:mm:ss |
Time of measurement |
|
Seconds_since_1Jan1900 |
Seconds |
Time of measurement in seconds since 1Jan1900 |
|
RH_Ground |
percent |
Relative humidity measured at ground level |
|
Temp_Ground |
C |
Temperature, in degrees C, measured at ground level |
|
RH_ Tower |
percent |
Relative humidity measured from instrument on the tower |
|
Temp_Tower |
C |
Temperature, degrees C, measured from instrument on the tower |
Data file name: AMAZE08_Harvard_Enviro_SamplingLine_Martin.csv |
|
Instrument: None provided |
|
Measurements reported: Pressure, temperature (Temp) and relative humidity (RH) measurements made at the TT34 tower. The measurements are 5 minute averages for the period February 7, 2008 - March 13, 2008. |
|
Data reporting frequency: 5 min |
|
Column Name |
Units/format |
Description |
|
Site |
|
Either Tower TT34 or Tower K34 |
|
Date_utc |
yyyy-mm-dd |
Date of measurement |
|
Time_utc |
hh:mm:ss |
Time of measurement |
|
Seconds_since_1Jan1900 |
Seconds |
Time of measurement in seconds since 1Jan1900 |
|
Pressure |
torr |
|
|
Temp |
degrees C |
Temperature, in degrees C, measured at ground level |
|
RH |
% |
|
Data file name: AMAZE08_SunTimes_Martin.csv |
|
Instrument: Clock |
|
Measurements reported: times for sunrise; sun noon; and sunset in UTC or the period February 5, 2008 - March 15, 2008. |
|
Data reporting frequency: Daily |
|
Column Name |
Units/format |
Description |
|
Sunrise_date |
yyyy-mm-dd |
Sunrise date, UTC |
|
Sunrise_time |
hh:mm:ss |
Sunrise time, UTC |
|
Sunrise_seconds |
seconds |
Time in seconds since 1Jan1900 |
|
Sun_noon_date |
yyyy-mm-dd |
Sun noon date, UTC |
|
Sun_noon_time |
hh:mm:ss |
Sun noon time, UTC |
|
Sun_noon_seconds |
seconds |
Time in seconds since 1Jan1900 |
|
Sunset_date |
yyyy-mm-dd |
Sunset date, UTC |
|
Sunset_time |
hh:mm:ss |
Sunset time, UTC |
|
Sunset_seconds |
seconds |
Time in seconds since 1Jan1900 |
File name: AMAZE08_Rainfall_MARTIN.csv |
|
Instrument: None provided |
|
Measurements reported: Lodging rain data as counts for the period February 7, 2008 – March 13, 2008. 100 tips corresponds to 12.14 mm of rain. |
|
Data reporting frequency: 5 minutes |
|
Column Name |
Units/format |
Description |
|
Site |
|
Either Tower TT34 or Tower K34 |
|
Date_utc |
yyyy-mm-dd |
Date of measurement |
|
Time_utc |
hh:mm:ss |
Time of measurement |
|
Seconds_since1Jan1900 |
Seconds |
Time of measurement in seconds since 1Jan1900 |
|
Counts |
Counts |
Tipping bucket rain gauge counts. 100 tips corresponds to 12.14 mm of rain. |
|
Accumulated_Counts |
Counts |
Accumulated_Counts. 100 tips corresponds to 12.14 mm of rain. |
Data file name: AMAZE08_AMS_Harvard_ElementalRatios_Martin.csv |
|
Instrument: aerosol mass spectrometer (AMS) (affiliation-Harvard) |
|
Measurements reported: oxygen to carbon (O:C); hydrogen to carbon (H:C); and nitrogen to carbon (N:C) ratios of the organic particle-phase material for the period February 7, 2008 - March 13, 2008 at Tower TT34. |
|
Data reporting frequency: 5 minute |
|
Column Name |
Units/format |
Description |
|
Site |
|
Either Tower TT34 or Tower K34 |
|
Date_utc |
yyyy-mm-dd |
Date of measurement |
|
Time_utc |
hh:mm:ss |
Time of measurement |
|
Seconds_since_1Jan1900 |
Seconds |
Time of measurement in seconds since 1Jan1900 |
|
O_C_ratio_organic_mass |
|
Oxygen to carbon (O:C) ratio of the organic particle-phase material |
|
H_C_ratio_organic_mass |
|
Hydrogen to carbon (H:C) ratio of the organic particle-phase material |
|
N_C_ratio_organic_mass |
|
nitrogen to carbon (N:C) ratio of the organic particle-phase material |
Data file name: AMAZE08_AMS_Harvard_MassConcentrations_Martin.csv |
|
Instrument: Harvard aerosol mass spectrometer (AMS) |
|
Measurement reported: organic; nitrates; ammonium; sulfate; and chloride mass concentrations - finalized to STP (273.15 K and 10^5 Pa) for the period February 7, 2008 - March 13, 2008 at Tower TT34. |
|
Data reporting frequency: 5 minutes |
|
Column Name |
Units/format |
Description |
|
Site |
|
Either Tower TT34 or Tower K34 |
|
Date_utc |
yyyy-mm-dd |
Date of measurement |
|
Time_utc |
hh:mm:ss |
Time of measurement |
|
Seconds_since_1Jan1900 |
Seconds |
Time of measurement in seconds since 1Jan1900 |
|
Organic |
ug m^-3 |
Organic mass concentration |
|
Nitrate |
ug m^-3 |
Nitrate mass concentration |
|
Sulfate |
ug m^-3 |
Ammonium mass concentration |
|
Ammonium |
ug m^-3 |
Sulfate mass concentration |
|
Chloride |
ug m^-3 |
Chloride mass concentration |
Data file name: AMAZE08_AMS_Harvard_PMFfactorLoadings.csv |
|
Instrument: None provided |
|
Measurement reported: Positive-matrix factorization of the time series of particle mass spectra of organic mass for the period February 7, 2008 - March 13, 2008. The column headings are the four statistical factors identified which accounted for 99% of the variance in the signal intensities of the organic constituents from PMF. The first factor was identified as associated with regional and local pollution and labeled “HOA” for its hydrocarbon-like characteristics. A second factor was associated with long range transport and labeled “OOA1” for its oxygenated characteristics. A third factor, labeled “OOA2,” was implicated as associated with the reactive uptake of isoprene oxidation products, especially of epoxydiols to acidic haze, fog, or cloud droplets. A fourth factor, labeled “OOA3,” was consistent with an association with the fresh production of secondary organic material (SOM) by the mechanism of gas-phase oxidation of biogenic volatile organic precursors followed by gas-to-particle conversion of the oxidation products. The suffixes 1, 2, and 3 on the OOA labels signify ordinal ranking with respect to the extent of oxidation represented by the factor (Chen et al., 2015). |
|
Data reporting frequency: 5-minute average |
|
Column Name |
Units/format |
Description |
|
Site |
|
Either Tower TT34 or Tower K34 |
|
Date_utc |
yyyy-mm-dd |
Date of measurement |
|
Time_utc |
hh:mm:ss |
Time of measurement |
|
Seconds_since_1Jan1900 |
Seconds |
Time of measurement in seconds since 1Jan1900 |
|
HOA |
ug m^-3 |
First factor, HOA |
|
OOA1 |
ug m^-3 |
Second factor, OOA1 |
|
OOA2 |
ug m^-3 |
Third factor, OOA3 |
|
OOA3 |
ug m^-3 |
Fourth factor, OOA3 |
Data file name: AMAZE08_AMS_Harvard_SonicAnemometer_Jimenez.csv |
|
Instrument: Harvard-CU sonic anemometer |
|
Measurements reported: wind speed; wind direction; and temperature at 40 meters on TT34 tower. Measurements are for the period February 6, 2008 - March 13, 2008. |
|
Data Reporting frequency: 5 min average |
|
Column Name |
Units/format |
Description |
|
Site |
|
Either Tower TT34 or Tower K34 |
|
Date_utc |
yyyy-mm-dd |
Date of measurement |
|
Time_utc |
hh:mm:ss |
Time of measurement |
|
Seconds_since_1Jan1900 |
seconds |
Time of measurement in seconds since 1Jan1900 |
|
Wind_direction |
deg with 0 N |
Wind direction |
|
Wind_speed |
m/s |
Wind speed |
|
Temp |
degrees C |
Temperature |
File name: AMAZE08_OPC_WELAS_TopTower_Schneider.csv |
|
Measuring instrument: WELAS white-light optical particle counter (affiliation- Max Planck Institute) |
|
Measurements reported: Number-size distribution of particles (mean and mode diameter) made from top of at Tower TT34 for the period February 26 – March 3, 2008 |
|
Data reporting frequency: 5 minutes |
|
Column Name |
Units/format |
Description |
|
Site |
|
Either Tower TT34 or Tower K34 |
|
Date_utc |
yyyy-mm-dd |
Date of measurement |
|
Time_utc |
hh:mm:ss |
Time of measurement |
|
Seconds_since_1Jan1900 |
Seconds |
Time of measurement in seconds since 1Jan1900 |
|
Num_Conc |
#cm^-3 |
Aerosol number concentrations provided in cm^-3 |
|
Mean_Diameter |
um |
Mean particle diameter |
|
Mode_Diameter |
um |
Mode particle diameter |
|
PM0_6 |
#cm^-3 |
Number concentration of particles, particle diameter smaller than 0.6μm (using n = 1.59 & rho = 1.0) |
|
PM1_0 |
#cm^-3 |
Number concentration of particles, particle diameter smaller than 1.0 μm (using n = 1.59 & rho = 1.0) |
|
PM2_5 |
#cm^-3 |
Number concentration of particles, particle diameter smaller than 2.5 μm (using n = 1.59 & rho = 1.0) |
|
PM10 |
#cm^-3 |
Number concentration of particles, particle diameter smaller than 10 μm (using n = 1.59 & rho = 1.0) |
File name: AMAZE08_OPC_WELAS_ResearchTrailer_Schneider.csv |
|
Measuring instrument: WELAS white-light optical particle counter (affiliation- Max Planck Institute) |
|
Measurements reported: Number-size distribution of particles (mean and mode diameter) made for the period February 7 – February 24, 2008 at Tower TT34. |
|
Data reporting frequency: 5 minutes |
|
Column Name |
Units/format |
Description |
|
Site |
|
Either Tower TT34 or Tower K34 |
|
Date_utc |
yyyy-mm-dd |
Date of measurement |
|
Time_utc |
hh:mm:ss |
Time of measurement |
|
Seconds_since_1Jan1900 |
Seconds |
Time of measurement in seconds since 1Jan1900 |
|
Num_Conc |
#cm^-3 |
Aerosol number concentrations provided in cm^-3 |
|
Mean_Diameter |
um |
Mean particle diameter |
|
Mode_Diameter |
um |
Mode particle diameter |
|
PM0_6 |
#cm^-3 |
Number concentration of particles, particle diameter smaller than 0.6μm (using n = 1.59 & rho = 1.0) |
|
PM1_0 |
#cm^-3 |
Number concentration of particles, particle diameter smaller than 1.0 μm (using n = 1.59 & rho = 1.0) |
|
PM2_5 |
#cm^-3 |
Number concentration of particles, particle diameter smaller than 2.5 μm (using n = 1.59 & rho = 1.0) |
|
PM10 |
#cm^-3 |
Number concentration of particles, particle diameter smaller than 10 μm (using n = 1.59 & rho = 1.0) |
File name: AMAZE08_OPC_GRIMM_Schneider.csv |
|
Instrument: GRIMM 1.108 laser source optical particle counter |
|
Measurements reported: Number-size distribution of particles (environmental mode) for the period February 7 – March 14, 2008 at Tower TT34. |
|
Data reporting frequency: 5 minutes |
|
Column Name |
Units/format |
Description |
|
Site |
|
Either Tower TT34 or Tower K34 |
|
Date_utc |
yyyy-mm-dd |
Date of measurement |
|
Time_utc |
hh:mm:ss |
Time of measurement |
|
Seconds_since_1Jan1900 |
Seconds |
Time of measurement in seconds since 1Jan1900 |
|
Num_Conc |
#cm^-3 |
Aerosol number concentrations provided in cm^-3 |
|
Mean_Diameter |
um |
Mean particle diameter |
|
Mode_Diameter |
um |
Mode particle diameter |
|
PM0_6 |
#cm^-3 |
Number concentration of particles, particle diameter smaller than 0.6μm (using n = 1.59 & rho = 1.0) |
|
PM1_0 |
#cm^-3 |
Number concentration of particles, particle diameter smaller than 1.0 μm (using n = 1.59 & rho = 1.0) |
|
PM2_5 |
#cm^-3 |
Number concentration of particles, particle diameter smaller than 2.5 μm (using n = 1.59 & rho = 1.0) |
|
PM10 |
#cm^-3 |
Number concentration of particles, particle diameter smaller than 10 μm (using n = 1.59 & rho = 1.0) |
Data file name: AMAZE08_CPC_SCHNEIDER.csv |
|
Instrument: Condensation particle counter (CPC) -TSI 3010 |
|
Measurements reported: Aerosol particle (>0.01 um) number concentrations for the period February 7, 2008 - March 14, 2008 at Tower TT34. |
|
Data reporting frequency: 60 sec |
|
Column Name |
Units/format |
Description |
|
Site |
|
Either Tower TT34 or Tower K34 |
|
Date_utc |
yyyy-mm-dd |
Date of measurement |
|
Time_utc |
hh:mm:ss |
Time of measurement |
|
Seconds_since_1Jan1900 |
seconds |
Time of measurement in seconds since 1Jan1900 |
|
Conc |
# cm^-3 |
Particle number concentrations |
Data file name: AMAZE08_AMS_MPI_MassConcentrations_Schneider.csv |
|
Instrument: Aerosol mass spectrometer (MPI) |
|
Measurements reported: organic; nitrate; ammonium; sulfate; and chloride mass concentrations for the period February 7 – March 14, 2008 at Tower TT34. |
|
Data reporting frequency: Approx every 2.5 minutes |
|
Column Name |
Units/format |
Description |
|
Site |
|
Either Tower TT34 or Tower K34 |
|
Date_utc |
yyyy-mm-dd |
Date of measurement |
|
Time_utc |
hh:mm:ss |
Time of measurement |
|
Seconds_since_1Jan1900 |
second |
Time of measurement in seconds since 1Jan1900 |
|
Organic |
ug m^-3 |
|
|
Nitrate |
ug m^-3 |
|
|
Sulfate |
ug m^-3 |
|
|
Ammonium |
ug m^-3 |
|
|
Chloride |
ug m^-3 |
|
Data file name: AMAZE08_SMPS_Diameters_SWIETLICKI.csv |
|
Instrument: Lund scanning mobility particle sizer (SMPS) |
|
Measurements reported: diameters for SMPS bins (29 columns) for the period February 21 - March 14 at Tower TT34. |
|
Data reporting frequency: 5 minute |
|
Note: These are SMPS diameters for respective Particle Size Concentrations reported in AMAZE08_SMPS_Concentrations_SWIETLICKI.csv. Note that diameters are constant across bins over time – all rows have the same diameter values. |
|
Column Name |
Units/format |
Description |
|
Site |
|
Either Tower TT34 or Tower K34 |
|
Date_utc |
yyyy-mm-dd |
Date of measurement |
|
Time_utc |
hh:mm:ss |
Time of measurement |
|
Seconds_since_1Jan1900 |
seconds |
Time of measurement in seconds since 1Jan1900 |
|
Diameters |
nm |
Diameters for SMPS bins (29 columns) |
Data file name: AMAZE08_SMPS_Concentrations_SWIETLICKI.csv |
|
Instrument: Lund scanning mobility particle sizer (SMPS) |
|
Measurements reported: particle size concentrations for each SMPS diameter bin (29 columns) for the period February 21 - March 14 at Tower TT34. |
|
Data reporting frequency: 5 minutes |
|
Note: These are the SMPS Particle Size Concentrations for the respective diameters reported in AMAZE08_SMPS_Diameters_SWIETLICKI.csv. |
|
Column Name |
Units/format |
Description |
|
Site |
|
Either Tower TT34 or Tower K34 |
|
Date_utc |
yyyy-mm-dd |
Date of measurement |
|
Time_utc |
hh:mm:ss |
Time of measurement |
|
Seconds_since_1Jan1900 |
seconds |
Time of measurement in seconds since 1Jan1900 |
|
Conc |
dN/dlogD |
Particle size concentrations for each SMPS diameter bin (29 columns) |
Data file name: AMAZE08_SMPS_IntegratedQuantities_SWIETLICKI.csv |
|
Instrument: Lund scanning mobility particle sizer (SMPS) |
|
Measurements reported: integrated particle number; surface; and volume concentrations for the period February 21 - March 14 at Tower TT34. |
|
Data reporting frequency: 5 minutes |
|
Column Name |
Units/format |
Description |
|
Site |
|
Either Tower TT34 or Tower K34 |
|
Date_utc |
yyyy-mm-dd |
Date of measurement |
|
Time_utc |
hh:mm:ss |
Time of measurement |
|
Seconds_since_1Jan1900 |
seconds |
Time of measurement in seconds since 1Jan1900 |
|
Integrated_Num_ Conc |
# cm^-3 |
Integrated particle number concentration |
|
Integrated_Surf_Conc |
um^2 cm^-3 |
Integrated particle surface concentration |
|
Integrated_Vol_Conc |
um^3 cm^-3 |
Integrated particle volume concentration |
Data file name: AMAZE08_SonicAnemometer_GUENTHER.csv |
|
Instrument: NCAR sonic anemometer |
|
Measurements reported: Scalar and vector wind speed and direction made at the TT34 tower. Measurements are for the period February 9, 2008 - February 27, 2008. |
|
Data reporting frequency: 5 min averages |
|
Column Name |
Units/format |
Description |
|
Site |
|
Either Tower TT34 or Tower K34 |
|
Date_utc |
yyyy-mm-dd |
Date of measurement |
|
Time_utc |
hh:mm:ss |
Time of measurement |
|
Seconds_since_1Jan1900 |
second |
Time of measurement in seconds since 1Jan1900 |
|
Scalar_wind_speed |
u in m/s |
Scalar wind speed |
|
sigma_u |
m/s |
Scalar wind speed, standard deviation |
|
Wind_direction |
deg with 0 N |
Wind direction |
|
Sigma_wind_direction |
deg |
Wind direction, standard deviation |
|
Vector_wind_speed |
m/s |
Vector wind speed |
|
u_star |
m/s |
u* |
|
H |
W m^-2 |
Sensible heat flux |
Data file name: AMAZE08_TraceGases_GUENTHER.csv |
|
Instrument: gas adsorption cartridges were analyzed by thermal desorption gas chromatography mass spectrometry (affiliation-NCAR) |
|
Measurements reported: ozone and nitrogen oxides at 40 meters made at tower TT34 at 40 meters for the period February 9, 2008 – February 27, 2008. |
|
Data reporting frequency: 5 min averages |
|
Missing Values reported as "none" are represented as -9999 |
|
Column Name |
Units/format |
Description |
|
Site |
|
Either Tower TT34 or Tower K34 |
|
Date_utc |
yyyy-mm-dd |
Date of measurement |
|
Time_utc |
hh:mm:ss |
Time of measurement |
|
Seconds_since_1Jan1900 |
Seconds |
Time of measurement in seconds since 1Jan1900 |
|
Ozone |
ppbv |
Ozone |
|
NO |
ppbv |
Nitric oxide |
|
NOx |
ppbv |
Oxides of nitrogen |
Data file name: AMAZE08_MixingRatios_GUENTHER.csv |
|
Instrument: proton-transfer mass spectrometer (affiliation- NCAR) |
|
Measurements reported: VOCs for the period February 9, 2008 - February 27, 2008 at Tower TT34. |
|
Data reporting frequency: 2 minutes |
|
Missing Values reported as "none" are represented as -9999 |
|
Column Name |
Units/format |
Description |
|
Site |
|
Either Tower TT34 or Tower K34 |
|
Date_utc |
yyyy-mm-dd |
Date of measurement |
|
Time_utc |
hh:mm:ss |
Time of measurement |
|
Seconds_since_1Jan1900 |
Seconds |
Time of measurement in seconds since 1Jan1900 |
|
Isoprene |
ppb |
Isoprene |
|
MVK_MACR |
ppb |
Methyl vinyl ketone and methacrolein |
|
Hydroxyacetone |
ppb |
Hydroxyacetone |
|
MT |
ppb |
MT |
|
SQT_best_est |
ppb |
Sesquiterpenes |
|
Methanol |
ppb |
Methanol |
|
Acetonitrile |
ppb |
Acetonitrile |
|
Acetaldehyde |
ppb |
Acetaldehyde |
|
Acetone |
ppb |
Acetone |
|
Acetic_acid |
ppb |
Acetic_acid |
|
Benzene |
ppb |
Benzene |
|
LT |
ppb |
LT |
|
SQT_lower_limit |
ppb |
SQT_lower_limit |
|
SQT_upper_limit |
ppb |
SQT_upper_limit |
Data file name: AMAZE08_Pyranometer_MANZI.csv |
|
Instrument: pyranometer (affiliation- INPA) |
|
Measurements reported: downward and upward radiation fluxes on Tower K34 for the period February 7, 2008 - 15 March, 2008 |
|
Data reporting frequency: 30 minutes |
|
Column Name |
Units/format |
Description |
|
Site |
|
Either Tower TT34 or Tower K34 |
|
Date_utc |
yyyy-mm-dd |
Date of measurement |
|
Time_utc |
hh:mm:ss |
Time of measurement |
|
Seconds_since_1Jan1900 |
seconds |
Time of measurement in seconds since 1Jan1900 |
|
Radiation_Flux_Down |
W m^-2 |
Radiation flux down |
|
Radiation_Flux_Up |
W m^-2 |
Radiation flux up |
Data file name: AMAZE08_PAR_MANZI.csv |
|
Instrument: None provided |
|
Measurement reported: photosynthetically active radiation (PAR) on tower K34 (affiliation- INPA) for the period February 7, 2008 - March 15, 2008. |
|
Data reporting frequency: 30 minutes |
|
Missing Values reported as "none" are represented as -9999 |
|
Column Name |
Units/format |
Description |
|
Site |
|
Either Tower TT34 or Tower K34 |
|
Date_utc |
yyyy-mm-dd |
Date of measurement |
|
Seconds_since_1Jan1900 |
second |
Time of measurement |
|
PAR |
W m^-2 |
Time of measurement in seconds since 1Jan1900 |
Data file name: AMAZE08_CFDC_PRENNI.csv |
|
Instrument: continuous flow diffusion chamber (CFDC) |
|
Measurements reported: Ice nuclei data for the period February 9, 2008 - March 9, 2008 at Tower TT34. |
|
Data reporting frequency: approximately every 10 minutes |
|
Column Name |
Units/format |
Description |
|
Site |
|
Either Tower TT34 or Tower K34 |
|
Date_utc |
yyyy-mm-dd |
Date of measurement |
|
Time_utc |
hh:mm:ss |
Time of measurement |
|
Seconds_since_1Jan1900 |
Seconds |
Time of measurement in seconds since 1Jan1900 |
|
Processing_Temp |
degrees C |
Processing temperature |
|
Ice_nuclei |
# cm^-3 |
Ice nuclei |
Data Center Processing Notes:
- The ORNL DAAC reformatted two data elements for consistency with archiving best practices: (1) the provided "Time & Date (UTC)" column, with values formatted as "Mon 11 Feb 2008 00:22:30", was transformed to two columns: "Date_utc" and "Time_utc", with values formatted as "yyyy-mm-dd" and "hh:mm:ss", respectively. "Seconds_since_1Jan1900" was retained as provided. (2) Missing Values for numeric variables that were provided as "None" were changed to -9999. No measurement data values were changed and the file version date and time were not changed.
- The ORNL DAAC also transformed the files from the space delimited to comma delimited, comma separate value (*.csv) format.
- The ORNL DAAC combined pairs of data files with identical row order and structure, including the Poeschl CCN activation diameter and Kappa value files, and the Artaxo fine and course mode filter analysis results files.
All original *.txt files are available by request from the ORNL DAAC.
Application and Derivation
The Amazon Basin provides an excellent environment for studying the sources, transformations, and properties of natural aerosol particles and the resulting links between biological processes and climate. With this framework in mind, AMAZE-08 carried out from 07 February – 14 March 2008 during the wet season in the central Amazon Basin sought to understand the formation, transformations, and cloud-forming properties of fine- and coarse-mode biogenic aerosol particles, especially as related to their effects on cloud activation and regional climate. Special foci included: The production mechanisms of secondary organic components at a pristine continental site, including the factors regulating their temporal variability. And, predicting and understanding the cloud-forming properties of biogenic particles at such a site.
For additional research results, please refer to the Atmospheric Chemistry and Physics special issue (http://www.atmos-chem-phys.net/special_issue141.html) which brings together a collection of publications on measurements of the Amazonian Aerosol Characterization Experiment 2008 (AMAZE-08). In particular, see the overview article for AMAZE-08 (Martin et al., 2010a).
Quality Assessment
The varied instrumentation was associated with several organizations. The accuracy of the measurements would depend on the instruments as well as the site conditions. Refer to Martin et al (2010a) for additional information.
Data Acquisition, Materials, and Methods
Site description:
The principal measurement site of AMAZE-08 was tower TT34 located in the central Amazon Basin, 60 km NNW of downtown Manaus and 40 km from the metropolis Marchgins (Martin et al., 2010a). The site, accessed by a 34-km unpaved road, was within a pristine terra firme rainforest in the Reserva Biologica do Cuieiras and managed by the Instituto Nacional de Pesquisas da Amazonia (INPA) and the Large-Scale Biosphere-Atmosphere Experiment in Amazonia (LBA). The base of tower TT34 was on a ridge, and the scale of hill-valley relief near the tower was ca. 50 m. The forest canopy height near the tower varied between 30 and 35 m. In addition to TT34, PAR measurements were made at Tower K34 1.6 km from the TT34 site. Tower K34 (54-m height) housed several instruments directly at its top level (Ahlm et al., 2009). Measurements were also taken at site K23 and Silvacultura site, however, there are no data included with this data set from those sites.
In this region of the Amazon Basin, the thickness of the convective planetary boundary layer (PBL) typically varies from 100-200-m at night to 1 to 2 km when fully developed in the mid afternoon. The development of the boundary-layer structure at night was driven by the formation of a nocturnal PBL that had a height comparable to the local topographical relief, which was 50 to 100-m around TT34. Local pollution (both at day and night) arrived at times from metropolitan Manaus, and affected some of the measurement periods at TT34, especially at night (Martin et al., 2010a and Martin et al., 2010b).
Sampling Methods:
At tower TT34, air was entrained into three inlets fixed at 38.75-m to the top of the tower. The air was brought by sampling lines to a ground-level container (2.2 × 5.9 × 2.5-m3). The inlet for gases consisted of a screen-covered inverted funnel.The inlet for turbulent-flow aerosol sampling was a screen-covered open tube that was placed very close to a sonic anemometer and positioned in the direction of predominant wind flow. An inlet with an aerodynamic cutoff nominally of PM10 but actually of PM7 for our flow conditions was used for laminar-flow aerosol sampling. The sampling lines running from these inlets to the container included a 6.4-mm (1/400 OD) Teflon line for gas sampling, a 12.7-mm (1/2 inch OD; 10.9-mm ID) stainless steel line for turbulent-flow aerosol sampling, and a 19-mm (3/4 inch OD; 17.3-mm ID) stainless steel line for laminar-flow aerosol sampling. From the sampling height to the container, the three lines were wrapped together and encased by sections of heating tape and insulation. Feedback control was used to maintain the temperature at 30±1 degrees C to avoid water condensation in the sampling lines (Martin et al., 2010b).
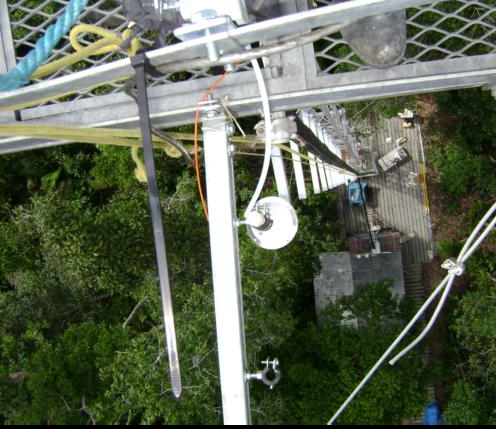
Figure 2. View from the top of tower TT34 looking down on sampling line.
Most of the particle instrumentation in the container sampled from the laminar line. For the dimensions and flow of the laminar sampling line, the Reynolds number varied from 1,200 to 2,000 during the period of measurements. The upper limit of the aerodynamic cutoff was therefore calculated to range from 5 to 7-μm for the range of flow rates employed during AMAZE-08. Therefore, the lower and upper limits of transmission of the inlet-sampling line assembly were calculated as 4 nm to 7-μm, respectively, for the condition of laminar flow.
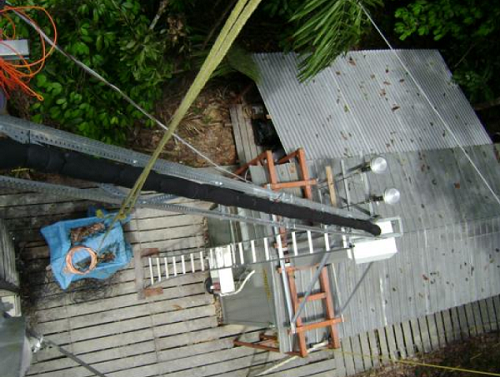
Figure 3. Close-up view of the lower part of tower looking at horizontal connector of sampling line.
A self-regenerating automatic dryer was placed on the top of the container and intercepted the laminar sampling line prior to entrance into the container. The dryer consisted of two diffusion dryers in parallel, one drying the aerosol flow while the other was bypassed and regenerated by dry air (Tuch et al., 2009). The flow was switched from one dryer to the other at a threshold of 40% RH. By this sequence, the RH was kept between 20 and 40% when measured by an in-line sensor. The cabinet housing the dryer on top of the container was consistently several degrees warmer than inside the container. The RH therefore increased by up to 20% in the distribution lines inside the container prior to sampling by instruments. The set point of the air-conditioning inside the container was 23 degrees C, although the temperature was warmer by three degrees C or more near some of the instruments (Martin et al., 2010b).
The turbulent sampling line was dried to 40 to 70% relative humidity by use of a Nafion RH-exchange tube that intercepted the sampling line on the roof of the container just prior to entrance. The partial pressure of water in the outer flow around the Nafion material (with the aerosol in the inner flow) was reduced by expansion through a critical orifice, with under pressure provided by a vacuum pump. The turbulent sampling line was operated at a Reynolds number of 5,000 to 10,000, and the corresponding diffusional, gravitational, and inertial deposition losses suggest 50% transmission cutoffs of 17 nm and 3.1 μm, with 100% transmission between these cutpoints. The line for gas sampling entered the container without interception (Martin et al., 2010a). For some gas measurements, additional sampling lines were temporarily placed at various heights along the tower (Karl et al., 2009).
Analyses:
Please refer to Martin et al. (2010b) for additional details regarding the analysis and instrumentation.
For additional articles regarding the AMAZE-08 research, refer to http://www.atmos-chem-phys.net/special_issue141.html
Data Access
These data are available through the Oak Ridge National Laboratory (ORNL) Distributed Active Archive Center (DAAC).
AMAZE-08 Aerosol Characterization and Meteorological Data, Central Amazon Basin: 2008
Contact for Data Center Access Information:
- E-mail: uso@daac.ornl.gov
- Telephone: +1 (865) 241-3952
References
Ahlm, L., Nilsson, E. D., Krejci, R., Martensson, E. M., Vogt, M., and Artaxo, P. Aerosol number fluxes over the Amazon rain forest during the wet season, Atmos. Chem. Phys., 9, 9381–9400, doi:10.5194/acp-9-9381-2009, 2009.
Chen, Q., D.K. Farmer, L. V. Rizzo, T. Pauliquevis, M. Kuwata, T.G. Karl, A. Guenther, J. D. Allan, H. Coe, M. O. Andreae, U. Pöschl, J. L. Jimenez, P. Artaxo, and S. T. Martin. Submicron particle mass concentrations and sources in the Amazonian wet season (AMAZE-08). Atmos. Chem. Phys., 15, 3687–3701, 2015 www.atmos-chem-phys.net/15/3687/2015/ doi:10.5194/acp-15-3687-2015.
Huffman, J. A., Sinha, B., Garland, R. M., Snee-Pollmann, A., Gunthe, S. S., Artaxo, P., Martin, S. T., Andreae, M. O., and Pöschl, U.: Size distributions and temporal variations of biological aerosol particles in the Amazon rainforest characterized by microscopy and real-time UV-APS fluorescence techniques during AMAZE-08, Atmos. Chem. Phys., 12, 11997-12019, doi:10.5194/acp-12-11997-2012, 2012.
Karl, T., Guenther, A., Turnipseed, A., Tyndall, G., Artaxo, P., and Martin, S.: Rapid formation of isoprene photo-oxidation products observed in Amazonia, Atmos. Chem. Phys., 9, 7753–7767, doi:10.5194/acp-9-7753-2009, 2009.
Martin, S. T., M. O. Andreae, D. Althausen, P. Artaxo, H. Baars, S. Borrmann, Q. Chen, D. K. Farmer, A. Guenther, S. S. Gunthe, J. L. Jimenez, T. Karl, K. Longo, A. Manzi, T. Müller, T. Pauliquevis, M. D. Petters, A. J. Prenni, U. Pöschl, L. V. Rizzo, J. Schneider, J. N. Smith, E. Swietlicki, J. Tota, J. Wang, A. Wiedensohler, and S. R. Zorn. An overview of the Amazonian Aerosol Characterization Experiment 2008 (AMAZE-08). Atmos. Chem. Phys., 10, 11415-11438, doi:10.5194/acp-10-11415-2010, 2010a.
Martin, S. T., Andreae, M. O., Artaxo, P., Baumgardner, D., Chen, Q., Goldstein, A. H., Guenther, A., Heald, C. L., Mayol-Bracero, O. L., McMurry, P. H., Pauliquevis, T., Poschl, U., Prather, K. A., Roberts, G. C., Saleska, S. R., Silva-Dias, M. A., Spracklen, D. V., Swietlicki, E., and Trebs, I.: Sources and properties of Amazonian aerosol particles, Rev. Geophys., 48, RG2002, doi:10.1029/2008RG000280, 2010b.
Tuch, T. M., Haudek, A., M¨uller, T., Nowak, A., Wex, H., and Wiedensohler, A. Design and performance of an automatic regenerating adsorption aerosol dryer for continuous operation at monitoring sites, Atmos. Meas. Tech., 2, 417–422, doi:10.5194/amt-2-417-2009, 2009.