Get Data
Summary
The MODIS fixed sites subsetting tool provides customized subsets and visualizations of several MODIS Collection 5 land products for more than 1,100+ selected field and flux tower sites around the world. Spatial subsets of the land products are available for predefined 7 x 7-km areas centered on the selected sites. The search tool enables users to select a site, a land product, define the temporal range of interest, and either download the data or select from several data visualization options.
These land data products are derived from the MODIS instruments onboard the Terra and Aqua satellites. Terra products are available for the years 2000 - present, and Aqua products are available from June 2002 - present. They are available as 8-day, 16-day, or annual composites at 250-m, 500-m, or 1000-m resolution depending on the product. Newly acquired and processed products are routinely added to the collection of available data. That is, the temporal extent of data products is continually growing for each site.
The field sites are the result of requests for inclusion by measurement networks, research programs, and individual researchers. Given a site’s latitude and longitude, a 7 x 7-km area centered on the site was subsetted from the larger MODIS tiles for each of the land products. These site-product files are indexed for rapid retrieval and processing. Users may search for field and flux tower sites by country, continents/land unit, measurement network affiliation, or land cover class.
The site-specific land product data can be downloaded in both comma separated value (*.csv) and GeoTIFF (.tif) format via the MODIS fixed sites subsetting tool. The data are in sinusoidal projection.
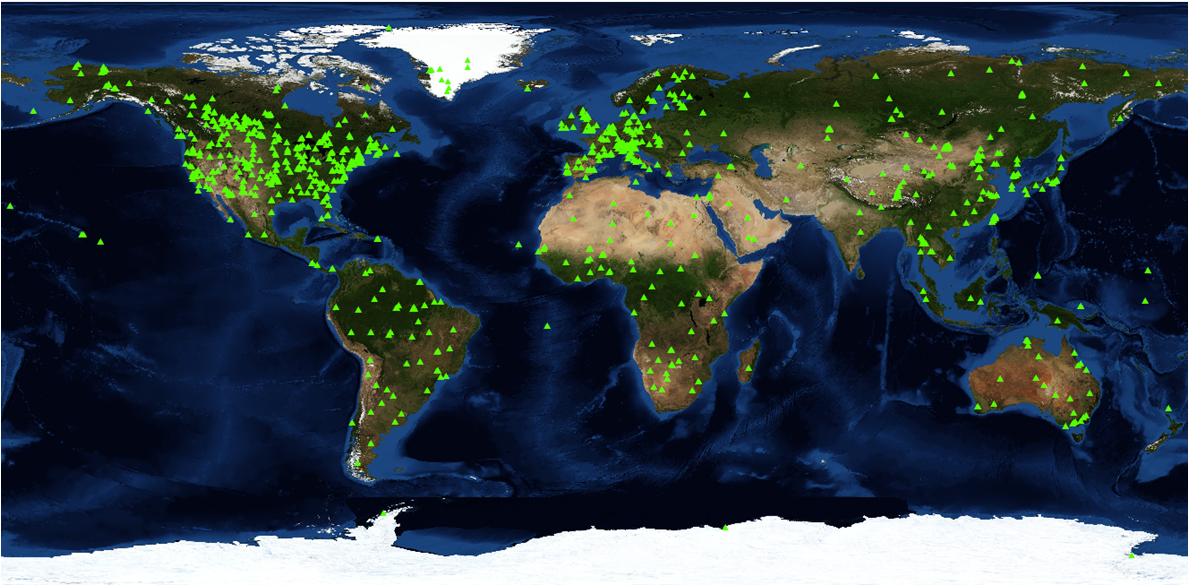
Figure 1. Locations of the 1,100+ field sites with available 7 x 7-km MODIS land product subsets.
Related MODIS tools:
Data Citation:
When using subsets of MODIS Land Products from the ORNL DAAC, please cite the data as follows:
Citation Format for a Single Site
ORNL DAAC. 2008. MODIS Collection 5 Fixed Sites Subsetting and Visualization Tool. ORNL DAAC, Oak Ridge, Tennessee, USA. Accessed Month dd, yyyy. Subset obtained for [Product name] product at [Lat],[Lon], time period: [Start date] to [End date], and subset size: 7 x 7 km. http://dx.doi.org/10.3334/ORNLDAAC/1251
Citation Format for Multiple Sites
ORNL DAAC. 2008. MODIS Collection 5 Fixed Sites Subsetting and Visualization Tool. ORNL DAAC, Oak Ridge, Tennessee, USA. Accessed Month dd, yyyy. Subsets obtained for [Product name] product over Spatial Range: N=DD.DD, S=DD.DD, E=DDD.DD, W=DDD.DD and Time period: [Start date] to [End date]. http://dx.doi.org/10.3334/ORNLDAAC/1251
- Note that users must include a different citation for each MODIS product used
- Specify Start and End dates in YYYYMMDD format
Citation Example--Single Site:
ORNL DAAC. 2008. MODIS Collection 5 Fixed Sites Subsetting and Visualization Tool. ORNL DAAC, Oak Ridge, Tennessee, USA. Accessed July 24, 2014. Subset obtained for MOD13Q1 product at 35.9587N,84.2874W, time period: 2000-02-18 to 2000-04-06, and subset size: 7 x 7 km. http://dx.doi.org/10.3334/ORNLDAAC/1251
Refer to Data Product Citation Guidelines for additional information.
Table of Contents:
- 1 Data Set Overview
- 2 Data Description
- 3 Applications and Derivation
- 4 Quality Assessment
- 5 Acquisition Materials and Methods
- 6 Data Access
- 7 References
1. Data Set Overview
The MODIS fixed sites subsetting tool provides customized subsets and visualizations of several MODIS Collection 5 land products for more than 1,100+ selected field and flux tower sites around the world. Spatial subsets of the land products are available for predefined 7 x 7-km areas centered on the selected sites. The search tool enables users to select a site, a land product, define the temporal range of interest, and either download the data or select from several data visualization options.
These land data products are derived from the MODIS instruments onboard the Terra and Aqua satellites. Terra products are available for the years 2000 - present, and Aqua products are available from June 2002 - present. They are available as 8-day, 16-day, or annual composites at 250-m, 500-m, or 1000-m resolution depending on the product. Newly acquired and processed products are routinely added to the collection of available data. That is, the temporal extent of data products is continually growing for each site.
2. Data Characteristics:
The 17 data land products data products offered in this data
set are derived from the MODIS instrument onboard the Terra and Aqua
satellites.
Table 1. MODIS subsets available from the ORNL DAAC.
Each site is 7 x 7 km. The number of pixels included in the data file depends on the product resolution.
Product names: The prefix MCD is reserved for files containing data composited from both Terra and Aqua platforms. MOD is reserved for files containing data collected from the Terra platform. MYD is reserved for files containing data collected from the Aqua platform.
| MODIS Product | Acronym | Name | Frequency (Days) | Resolution (Meter) | Number of Pixels |
|---|---|---|---|---|---|
| MCD12Q1 | LC | MODIS/Terra+Aqua Land Cover (LC) Type Yearly L3 Global 500m SIN Grid | annual | 500 | 196 |
| MCD12Q2 | LCD | MODIS/Terra+Aqua Land Cover Dynamics (LCD) Yearly L3 Global 500m SIN Grid | annual | 500 | 196 |
| MCD43A1 | BRDF | MODIS/Terra+Aqua BRDF/Albedo (BRDF/MCD43A1) 16-Day L3 Global 500m SIN Grid | 16 | 500 | 196 |
| MCD43A2 | BRDF/QA | MODIS/Terra+Aqua BRDF/Model Quality (BRDF/MCD43A2) 16-Day L3 Global 500m SIN Grid V005 | 16 | 500 | 196 |
| MCD43A4 | NBAR | MODIS/Terra+Aqua Nadir BRDF-Adjusted Reflectance (NBAR) 16-Day L3 Global 500m SIN Grid | 16 | 500 | 196 |
| MOD09A1 | SREF | MODIS/Terra Surface Reflectance (SREF) 8-Day L3 Global 500m SIN Grid | 8 | 500 | 196 |
| MOD11A2 | TEMP | MODIS/Terra Land Surface Temperature/Emissivity (LST) 8-Day L3 Global 1km SIN Grid | 8 | 1000 | 49 |
| MOD13Q1 | NDVI/EVI | MODIS/Terra Vegetation Indices (NDVI/EVI) 16-Day L3 Global 250m SIN Grid [Collection 5] | 16 | 250 | 784 |
| MOD15A2 | LAI/FPAR | Leaf Area Index (LAI) and Fraction of Photosynthetically Active Radiation (FPAR) 8-Day Composite [Collection 5] | 8 | 1000 | 49 |
| MOD16A2 | ET | MODIS/Terra Evapotranspiration (ET) 8-Day L4 Global Collection 5 | 8 | 1000 | 49 |
| MOD17A2 | GPP | MODIS/Terra Gross Primary Production (GPP) 8-Day L4 Global | 8 | 1000 | 49 |
| MOD17A3 | NPP | MODIS/Terra Net Primary Production (NPP) Yearly L4 Global 1km SIN Grid | annual | 1000 | 49 |
| MYD09A1 | SREF | MODIS/Aqua Surface Reflectance (SREF) 8-Day L3 Global 500m SIN Grid | 8 | 500 | 196 |
| MYD11A2 | TEMP | MODIS/Aqua Land Surface Temperature/Emissivity (LST)8-Day L3 Global 1km SIN Grid | 8 | 1000 | 49 |
| MYD13Q1 | NDVI/EVI | MODIS/Aqua Vegetation Indices (NDVI/EVI) 16-Day L3 Global 1km SIN Grid | 16 | 250 | 784 |
| MYD15A2 | LAI/FPAR | MODIS/Aqua Leaf Area Index (LAI) and Fraction of Photosynthetically Active Radiation (FPAR) 8 Day Composite | 8 | 1000 | 49 |
| MYD17A2 | GPP | MODIS/Aqua Gross Primary Production (GPP) 8 Day L4 Global | 8 | 1000 | 49 |
Data Access
Files are organized with directories for each MODIS product and then selected sites with each product directory.
Directory name syntax:
For example, in directory C5_MYD11A2/ :
- The first part of name, "C5_", indicates that the MODIS Product data are from the Collection 5 reprocessing task. The second name part is a "MODIS Product" as listed in Table 1.
- All selected-sites data files for the identified MODIS Product are included in the respective directory.
Data file name syntax:
For example, in the file MYD11A2.fn_uswawind.txt:
- The first part of name, "MYD11A2.", is the MODIS Product. The second part, "fn_uswawind", is the MODIS SITE ID.
- The MODIS products are listed in Table 1 and the Site IDs for all selected sites are provided in the Site_IDs companion file
- The data files are in comma-separated format.
Data file structure:
These .csv data files contain a header row followed by comma-delimited rows of parameter values (image bands) for each pixel in a 7-km x 7-km area containing the selected field site. Each row contains data from an 8-day, 16-day, or annual period depending on the temporal frequency of the data product represented. Quality information, represented as additional bands in MODIS imagery, are also included as rows in these data tables. Each row contains the respective band’s data values for each pixel -- 49, 196, or 784 columns depending upon the product’s resolution. Generic header for data files:
|
HDFname,Product,Date,Site,ProcessDate,Band,1,2,3,4,5,6,7,8,9,10,11,12,13,14,15,16,17,18,19,20,21,22,23,24,25, 26,27,28,29,30,31,32,33,34,35,36,37,38,39,40,41,42,43,44,45,46,47,48,49 Where • HDFname - string of fields separated by "periods" (e.g., " MOD15A2.A2000049.fn_uswipark.005.2006268184511.Fpar_1km ") o HDFname subfields: o MODIS product shortname (MOD15A2) o Composite interval start year and day of year (Ayyyyddd) o Selected site name (fn_uswipark) o Product version (005) o Processing date (yyyydddhhmmss) o Band (e.g., "Fpar_1km ") • Product - MODIS product shortname (MOD15A2) • Date - Composite interval start year and day of year (Ayyyyddd) Site - Selected site name (fn_uswipark) • ProcessDate - Processing date (yyyydddhhmmss) • Band - ("FparExtra_QC", " FparLai_QC", "FparStdDev_1km", " Fpar_1km", "LaiStdDev_1km", "Lai_1km") • 1-49 - values for 49 pixels (Number of pixels can be 49, 198, or 784 depending upon product resolution.) |
A note about bands: The number of bands -- number of rows associated with a specific compositing date are product specific. In the header description above and example file below, there are 6 data and QC bands/rows for this fPAR and LAI product. Please refer to the product documentation at the Land Processes DAAC for more information.
Referring to the above example, the first four rows of the file MOD15A2_fn_uswipark_01.txt are associated with a single image compositing date and consist of one row containing fPAR values, one row containing LAI values, and two rows containing Quality information.
The parameters/bands (number of rows) associated with each data product on a specific compositing date, are product specific. Please refer to the product documentation at the Land Processes DAAC for more information.
These files will expand as new image dates are acquired (rows will be added for each subsequent MODIS compositing date). Check the MODIS Land Subsets Web site periodically, for a complete time series of data. Time series analyses are also available at the MODIS Land Quality Assessment site .
Example data file records for product: MOD15A2 -- Leaf Area Index (LAI) and Fraction of Photosynthetically Active Radiation (fPAR) 8-Day Composite. The six data records will repeat every eight days.
|
HDFname,Product,Date,Site,ProcessDate,Band,1,2,3,4,5,6,7,8,9,10,11,12,13,14,15,16,17,18,19, 20,21,22,23,24,25,26,27,28,29,30,31,32,33,34,35,36,37,38,39,40,41,42,43,44,45,46,47,48,49 MOD15A2.A2000049.fn_uswipark.005.2006268184511.FparExtra_QC,MOD15A2,A2000049,fn_uswipark,2006268184511, FparExtra_QC,00100000,00100000,00100000,00100000, 00100000,00100000,00100000,00100000,00100000,00100000,00100000,00100000,00100000, 00100000,00100000,00100000,00100000,00100000,00100000,00100000,00100000,00100000,00100000, 00100000,00100000,00100000,00100000,00100000,00100000,00100000,00100000,00100000,00100000, 00100000,00100000,00100000,00100000,00100000,00100000,00100000,00100000,00100000,00100000, 00100000,00100000,00100000,00100000,00100000,00100000 MOD15A2.A2000049.fn_uswipark.005.2006268184511.FparLai_QC,MOD15A2,A2000049,fn_uswipark, 2006268184511,FparLai_QC,01101001,01101001,01101001,01101001,01101001,01101001,01101001,01101001, 01101001,01101001,01101001,01101001,01101001,01101001,01101001,01101001,01101001,01101001,01101001, 01101001,01101001,01101001,01101001,01101001,01101001,01101001,01101001,01101001,01101001, 01101001,01101001,01101001,01101001,01101001,01101001,01101001,01101001,01101001,01101001, 01101001,01101001,01101001,01101001,01101001,01101001,01101001,01101001,01101001,01101001 MOD15A2.A2000049.fn_uswipark.005.2006268184511.FparStdDev_1km,MOD15A2,A2000049,fn_uswipark, 2006268184511,FparStdDev_1km,248,248,248,248,248,248,248,248,248,248,248,248,248,248,248,248,248,248, 248,248,248,248,248,248,248,248,248,248,248,248,248,248,248,248,248,248,248,248,248,248,248,248,248,248, 248,248,248,248,248 MOD15A2.A2000049.fn_uswipark.005.2006268184511.Fpar_1km,MOD15A2,A2000049,fn_uswipark,2006268184511, Fpar_1km,1,2,2,2,1,1,2,2,1,1,1,2,2,2,1,1,1,1,1,1,1,1,1,1,2,1,1,2,1,1,1,2,1,2,1,1,1,1,1,1,2,1,1,1,1,1,1,1,1 MOD15A2.A2000049.fn_uswipark.005.2006268184511.LaiStdDev_1km,MOD15A2,A2000049,fn_uswipark,2006268184511, LaiStdDev_1km,248,248,248,248,248,248,248,248,248,248,248,248,248,248,248,248,248,248,248,248,248,248,248,248,248, 248,248,248,248,248,248,248,248,248,248,248,248,248,248,248,248,248,248,248,248,248,248,248,248 MOD15A2.A2000049.fn_uswipark.005.2006268184511.Lai_1km,MOD15A2,A2000049,fn_uswipark,2006268184511, Lai_1km,0,0,0,0,0,0,1,0,0,0,0,1,0,0,0,0,0,0,0,0,0,0,0,0,1,0,0,0,0,0,0,1,0,1,0,0,0,0,0,0,1,0,0,0,0,0,0,0,0 |
3. Data Application and Derivation:
Given a field site’s latitude and longitude, the data are first subsetted from one or more 1,200 x 1,200-km MODIS tiles to 25 x 25-km arrays by the MODIS Science Data Support Team (MODAPS). These products are further subsetted (7 x 7-km) and reformatted from their native HDF-EOS to csv using the MODIS Reprojection Tool (MRT) in combination with code developed at the ORNL DAAC.
4. Quality Assessment:
The MODIS Land Science Team maintains a MODIS Land Quality Assessment site, MODIS Land Quality Assessment, referred to as MODLAND, which provides on a routine basis, and formally stored as product metadata and as per-pixel information, the results of the continuous quality assurance. These results are also placed on the Product Quality Web pages associated with the site.
5. Data Acquisition Methods:
The steps to prepare subsets for selected sites, and how to use the Subsetting and Visualization Tool to access the products, are described below.
MODIS Land Product Subsets for Selected Sites
The ORNL DAAC uses the MODIS Reprojection Tool (MRT) to reformat the MODIS data from HDF-EOS to binary format. A tool developed at ORNL is then used to convert the binary format to csv format. Collection 5 data are in Sinusoidal projection.
The MRT is available from the Land Processes DAAC (LP DAAC). The ORNL DAAC creates subsets and packages the data. The MRT can also be used to reproject data from its native projection to other projections, but ORNL chose to forgo the resampling associated with reprojection to minimize data manipulation and distortion.
Site Selection, Visualization, and Data Product Subsetting
Steps to create data product subsets with the MODIS fixed-sites subsetting and visualization tool are provided below.
Step 1) Site selection: to select a site, first choose a broad variable category and depending on the category chosen, a picklist of respective sub-categories will be presented. Based on your selections, sites with available data are listed.
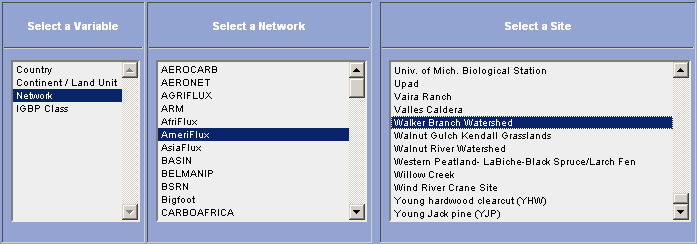
Figure 2. Site selection process. The image illustrates that from Network, the AmeriFlux network was chosen and the Walker Branch Watershed site was selected.
Step 2) Data visualization and data downloading options: after selecting a site, the data visualization options and data download options available are provided. Users may choose to visualize data from five different data visualization methods or download data.
The five data visualization methods include:
- Grid Visualization for individual composite period Basic Version (Default QC setting)
- Grid Visualization for individual composite period Advanced Version (User defined QC setting
- Time Series Basic Version (Default QC setting)
- Time Series Advanced Version (User defined QC setting)
- GeoTIFF format

Figure 3. Data visualization and download options. The image illustrates the data visualization and data download options available for the Walker Branch Watershed site.
Refer to File Formats for additional information.
Step 3) MODIS subsets product selection
After selecting a visualization method or file download format, the MODIS products are provided (see Table 1) and users may select subsets of data for visualization (Figure 4). Clicking Continue will provide the data as a Time Series graph (Figure 5), Stack Time Series (Figure 6), and the option for Composite Grid Visualization (Figure 7).
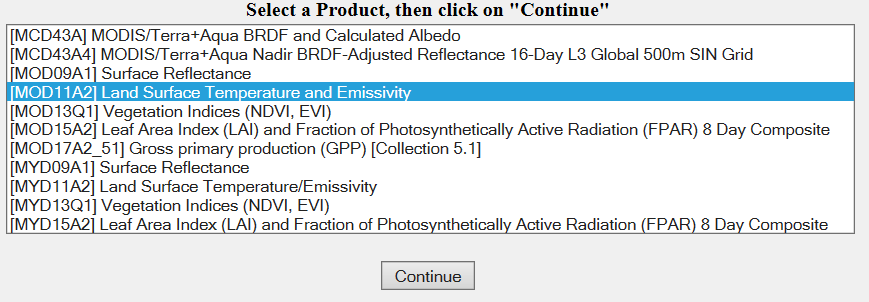
Figure 4. List of MODIS products.
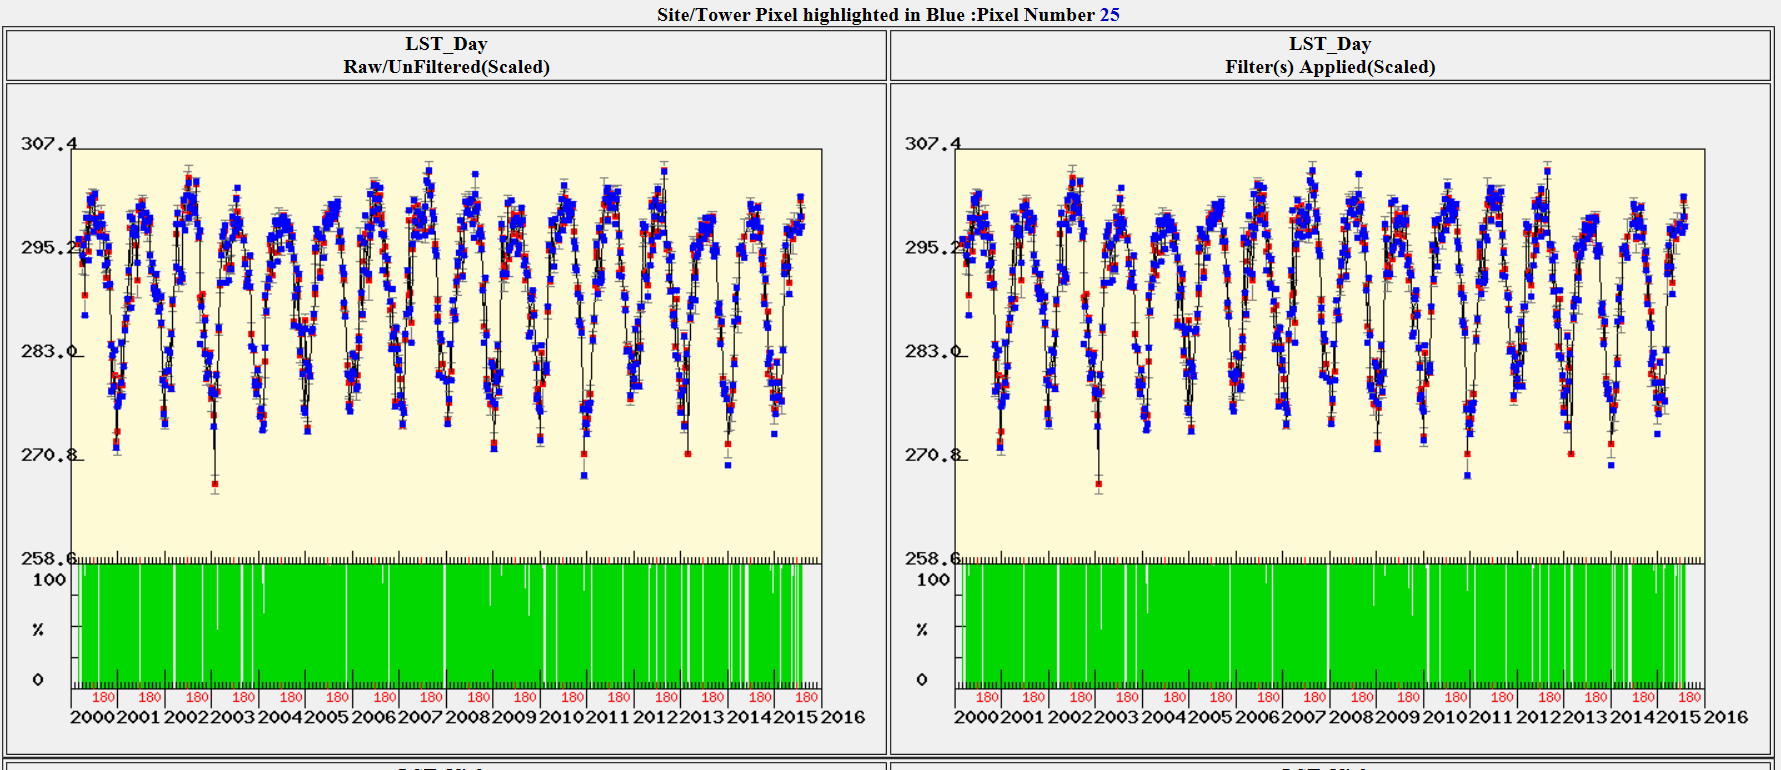
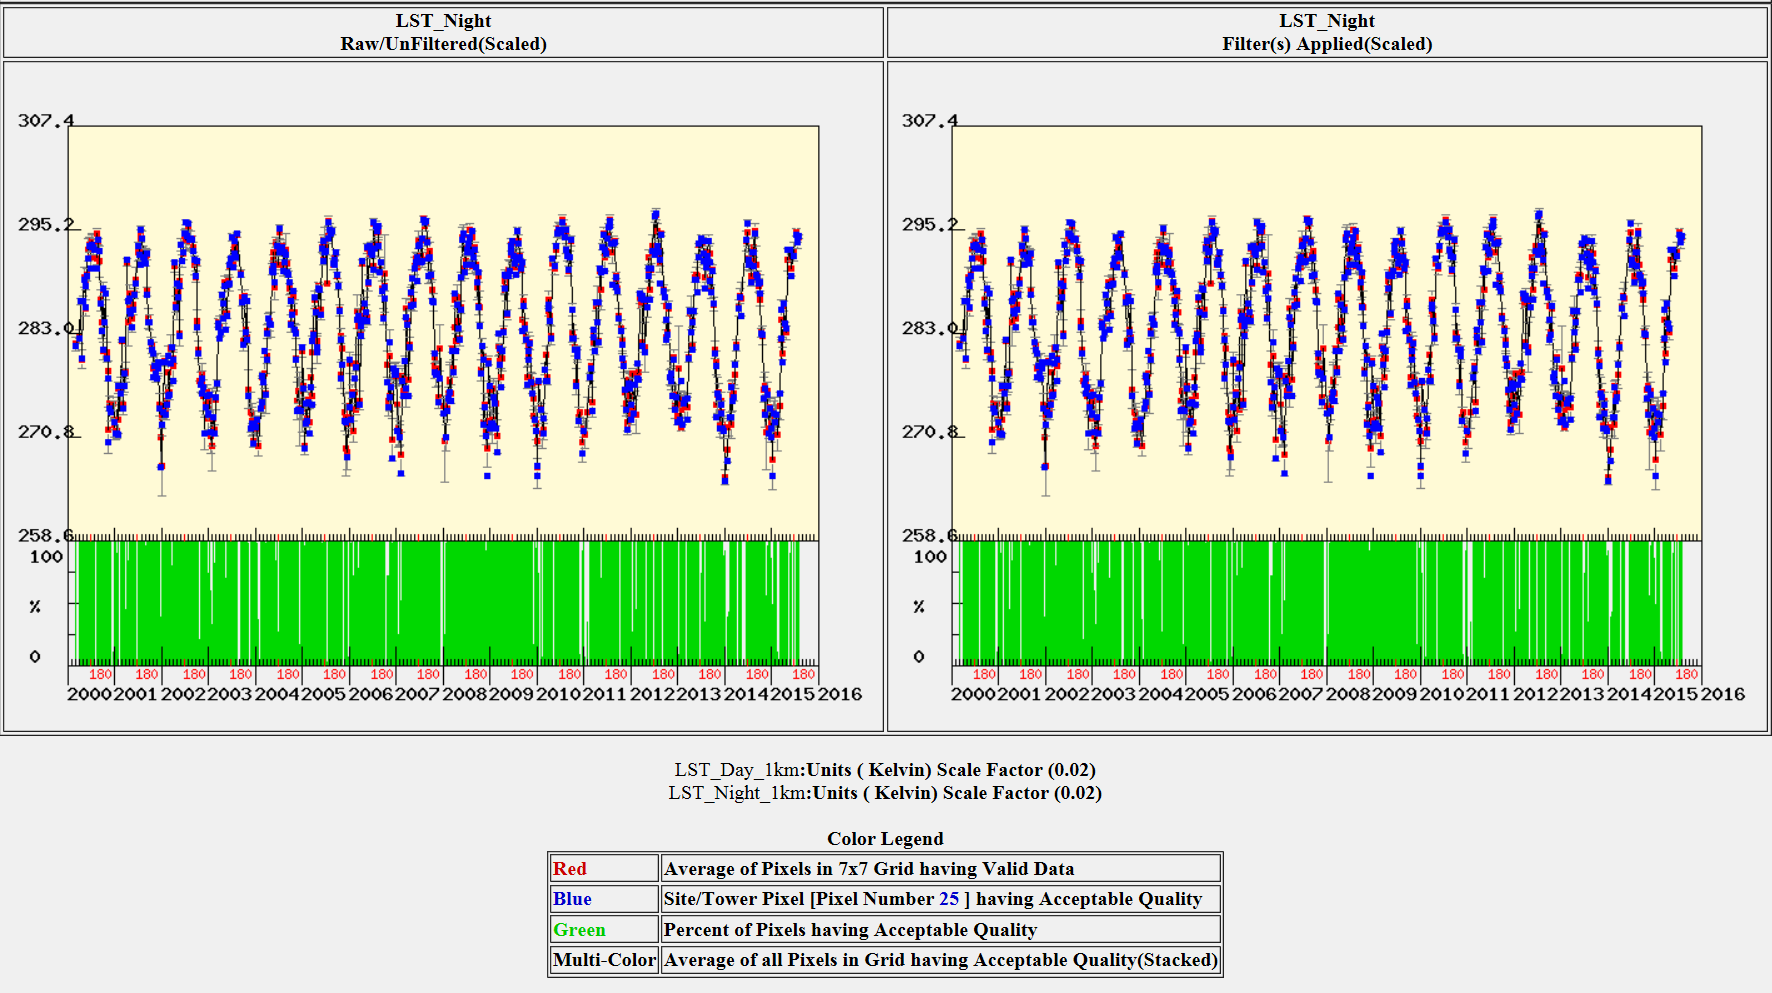
Figure 5. LST Time series data displayed after choosing the Time Series Basic Version visualization option (Step 2) .
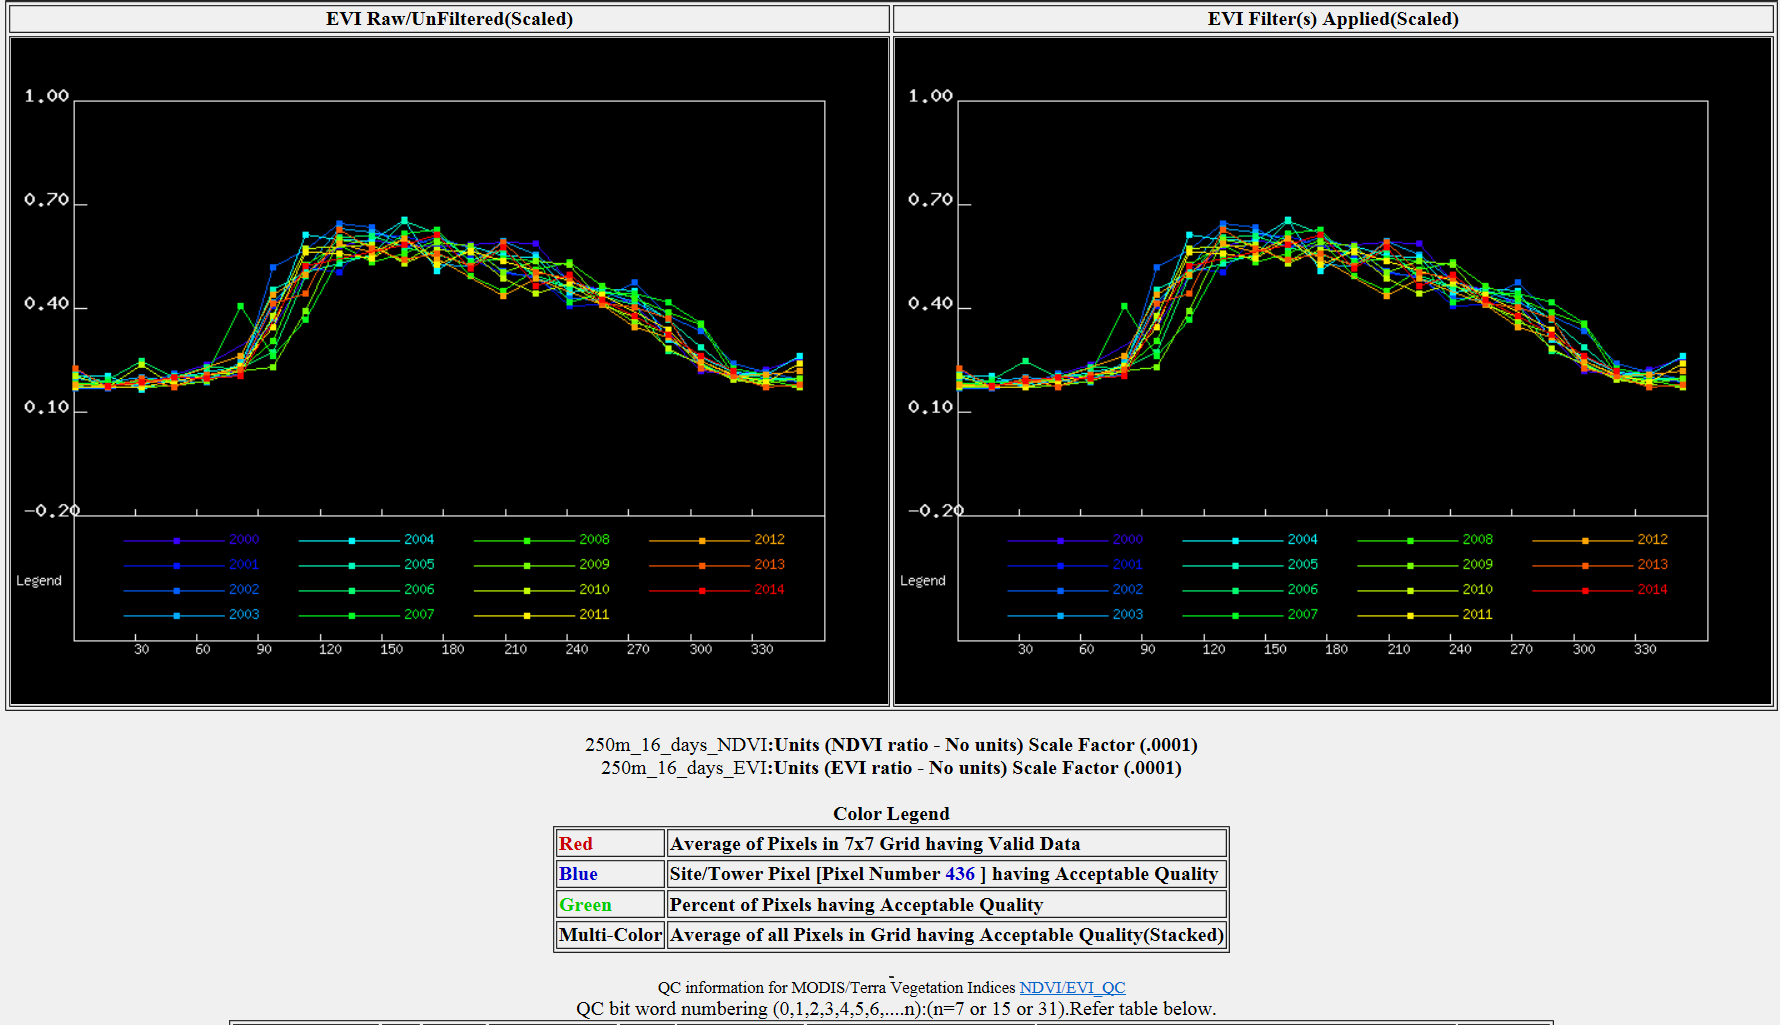
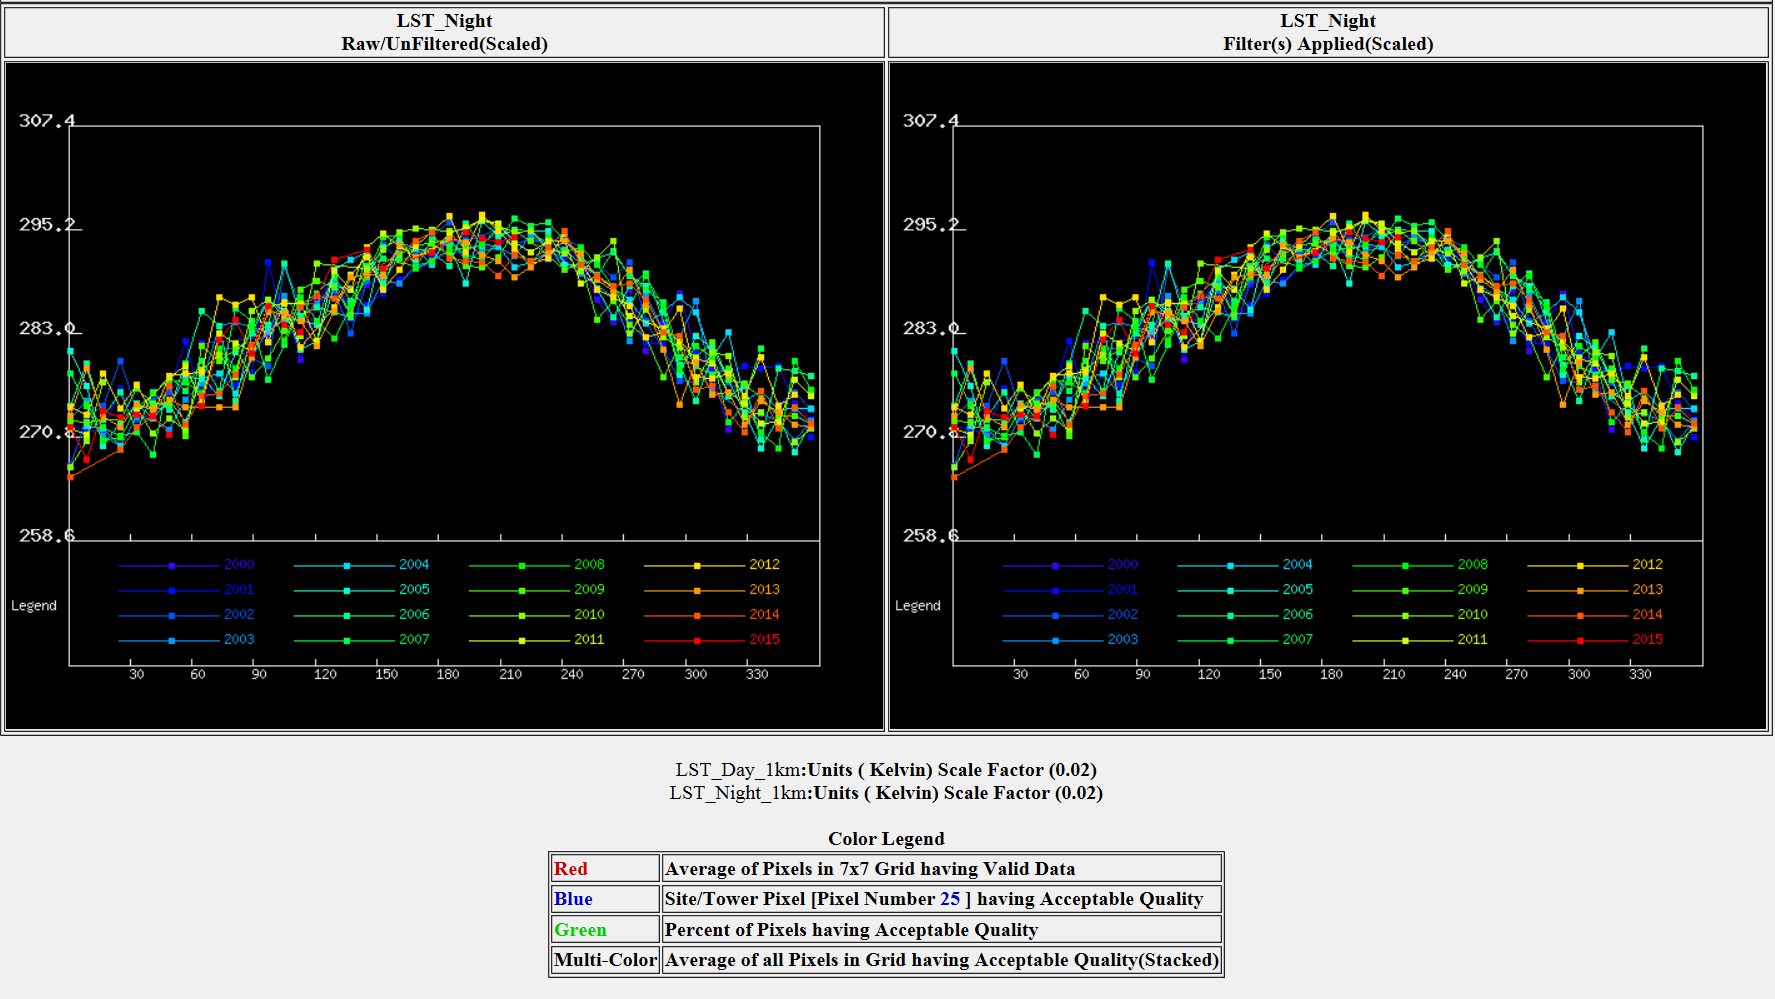
Figure 6. LST data for the Walker Branch Watershed site as a Stack Time series graph.
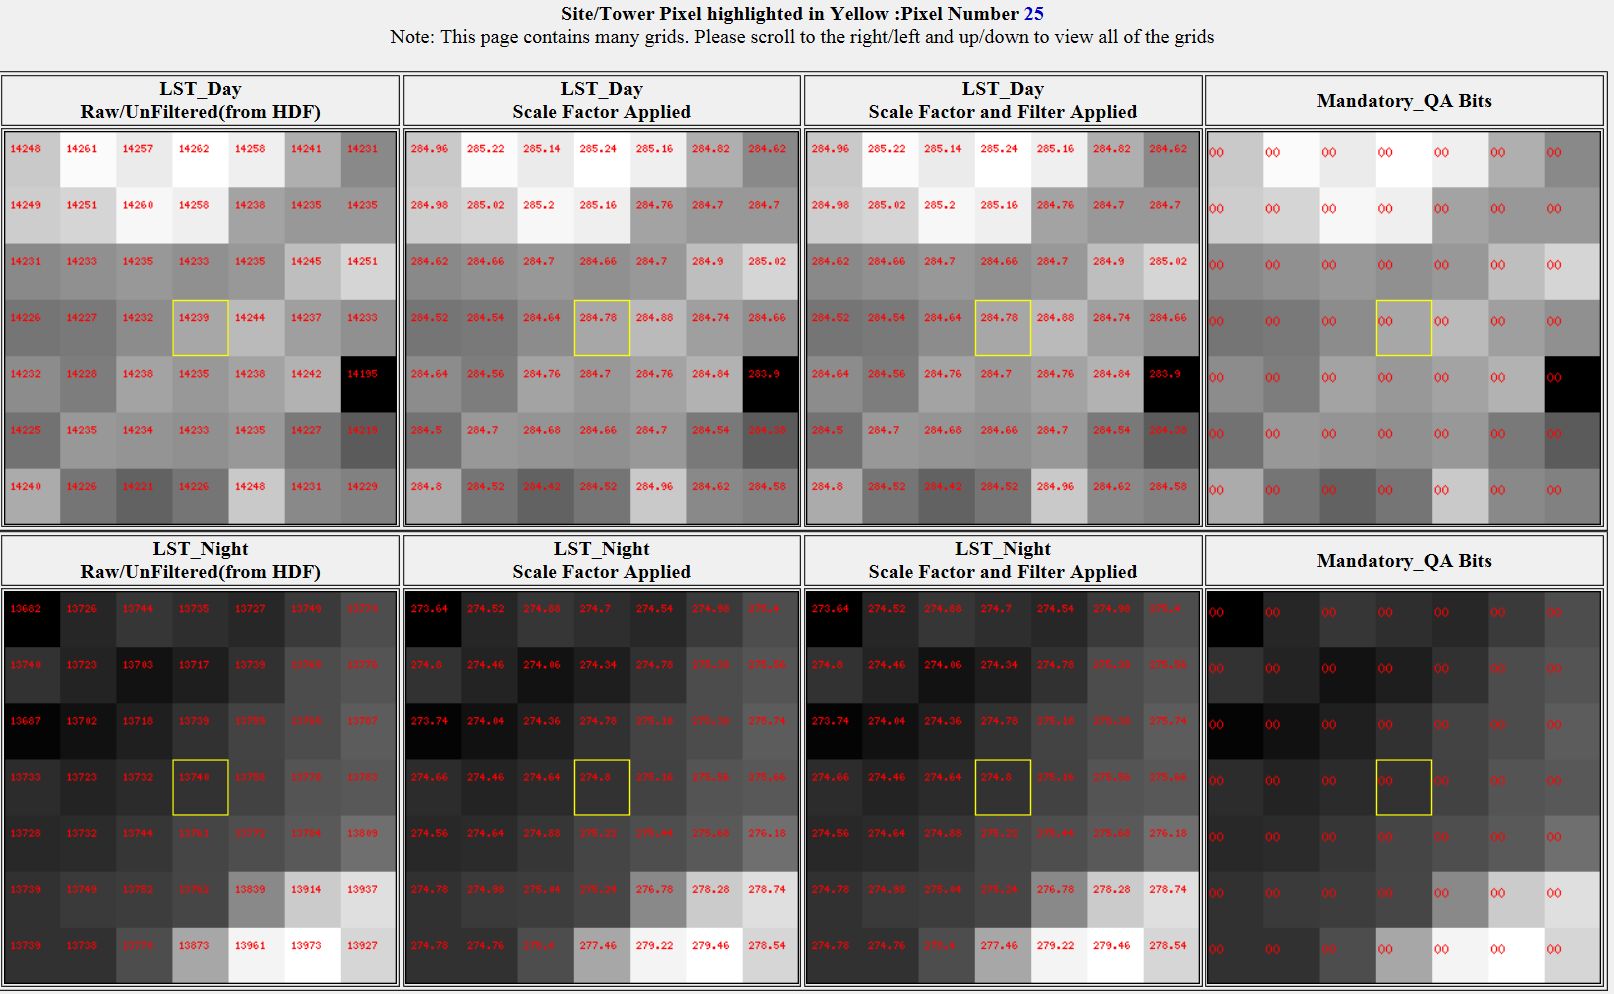
Figure 7. LST data displayed after clicking on Composite Grid Visualization. This example is for LST data on Nov 25, 2005.
Choosing the Time Series Advanced Version visualization provides data quality control options. The images below illustrate the visualization choices for Land Surface Temperature and Emissivity (LST) data visualization for the Walker Branch Watershed after the Time Series Advanced Version visualization option (Figure 8) was chosen.
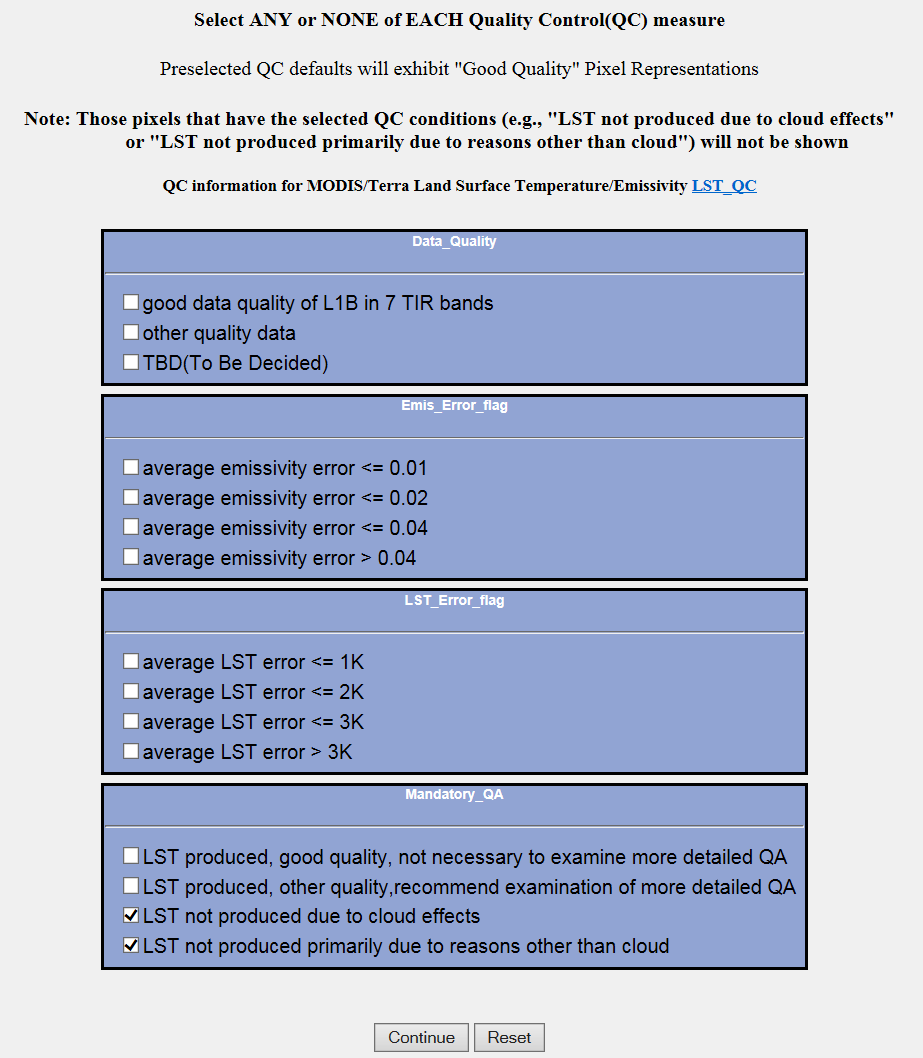
Figure 8. Data QC options.

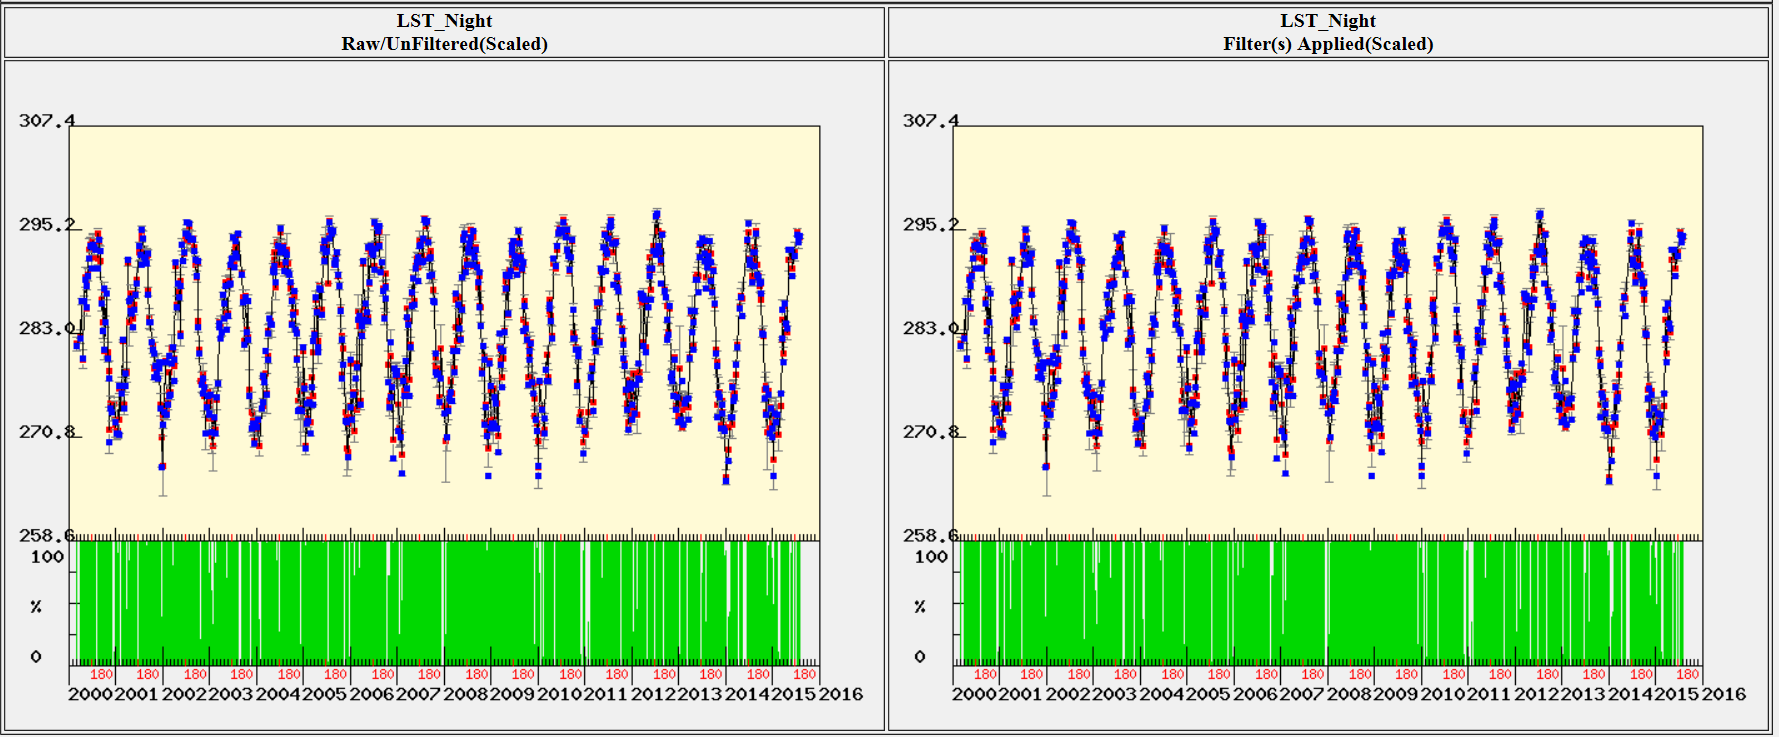
Figure 9. Data results after the QC options were applied.
Step 4) Download data by clicking on the Download ALL Data for this site/MODIS Product button to display the data.
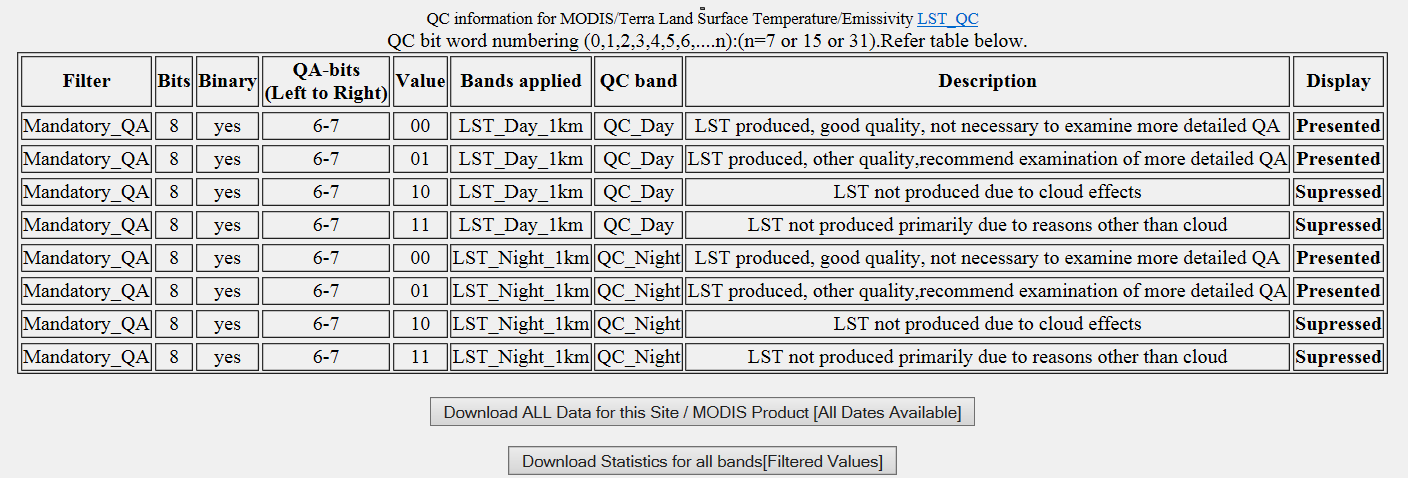
Figure 10. QC descriptions and data download options.
6. Data Access:
These data are available through the Oak Ridge National Laboratory (ORNL) Distributed Active Archive Center (DAAC).
MODIS Fixed Sites Subsetting Tool
Contact for Data Center Access Information:
E-mail: uso@daac.ornl.gov
Telephone: +1 (865) 241-3952
7. References:
S.K. Santhana Vannan, R.B. Cook, S.K. Holladay, L.M. Olsen, U. Dadi, B.E. Wilson. A Web-Based Subsetting Service for Regional Scale MODIS Land Products (2010). IEEE JSTARS, 2(4): 319–328