Documentation Revision Date: 2026-08-06
Dataset Version: 1
Summary
There are 6151 files in compressed Keyhole Markup Language (*.kmz) format.
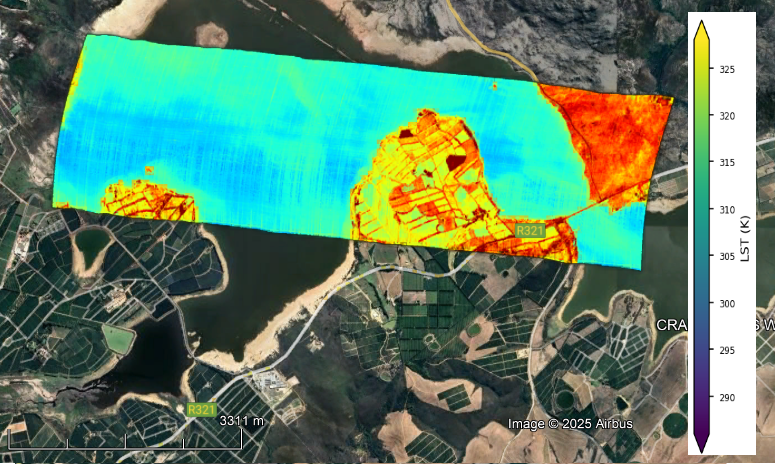
Figure 1. Overlay of L2 land surface temperature (LST) derived from NASA's Hyperspectral Thermal Emission Spectrometer (HyTES) imagery acquired on November 15 2023. This scene is located west of Theewaterskloof, Western Cape province, South Africa (approximately -34.02 latitude, 19.17 longitude). Background image from Google Earth and Airbus. Source: 20231115t124818_TheewatersBox19ZA_L1_B110_V03.kmz
Citation
Hulley, G.C., S.J. Hook, T.T. La, G. Rivera, W.R. Johnson, and B.T. Eng. 2025. HyTES Level 2 Emissivity and LST Overlay Images, Facility Instrument Collection. ORNL DAAC, Oak Ridge, Tennessee, USA. https://doi.org/10.3334/ORNLDAAC/2469
Table of Contents
- Dataset Overview
- Data Characteristics
- Application and Derivation
- Quality Assessment
- Data Acquisition, Materials, and Methods
- Data Access
- References
Dataset Overview
This dataset contains geocorrected image overlays of Level 2 (L2) emissivity and land surface temperature (LST) from imagery acquired by the Hyperspectral Thermal Emission Spectrometer (HyTES) instrument. The emissivity overlays are composite RGB images derived from bands 183 (10.8 µm), 100 (9.2 µm), and 58 (8.6 µm). This is the NASA Earth Observing System Data and Information System (EOSDIS) facility instrument archive of these data.
The NASA HyTES is an airborne imaging spectrometer with 256 spectral channels between 7.5 and 12 micrometers in the thermal infrared part of the electromagnetic spectrum and 512 pixels cross-track. HyTES has been deployed on NASA’s Twin Otter, Earth Resources ER-2, and GulfStream V aircraft and completed its first flights in July 2012. HyTES was designed to provide high spectral and spatial resolution thermal infrared (TIR) data as a precursor for NASA’s planned Hyperspectral Infrared Imager (HyspIRI) orbital mission. It is useful for a number of applications, including high-resolution surface temperature and emissivity measurements, point sources of air pollution, and volcano observations.
NASA facility instruments operate out of a NASA research center and support multiple science disciplines, field investigations, and NASA science objectives. Facility instruments are supported by managers in the Earth Science Division (ESD) Research and Analysis Program, and/or the Earth Observation System (EOS) Project Science Office.
Project: HyTES
The Hyperspectral Thermal Emissions Spectrometer (HyTES) is an airborne pushbroom imaging spectrometer developed by the Jet Propulsion Laboratory (JPL). It was designed to support the previous Hyperspectral Infrared Imager (HyspIRI) mission study and has been used in several research missions since July 2012. HyTES offers high spatial and spectral resolution measurements of brightness temperature (radiance), emissivity, and land surface temperature. It operates across 256 spectral channels between 7.5 and 12 µm wavelengths. HyTES instrument has 512 pixels across track with pixel sizes in the range of 5 to 50 m depending on the flight altitude. HyTES was funded through NASA’s Earth Science Technology Office (ESTO) Instrument Incubator Program (IIP).
Related Publications
Hook, S.J., W.R. Johnson,and M.J. Abrams. 2013. NASA’s Hyperspectral Thermal Emission Spectrometer (HyTES). In: C. Kuenzer and S. Dech (eds). Thermal Infrared Remote Sensing. Remote Sensing and Digital Image Processing, vol 17. Springer, Dordrecht. https://doi.org/10.1007/978-94-007-6639-6_5
Hulley, G.C., R.M. Duren, F.M. Hopkins, S.J. Hook, N. Vance, P. Guillevic, W.R. Johnson, B.T. Eng, J.M. Mihaly, V.M. Jovanovic, S.L. Chazanoff, Z.K. Staniszewski, L. Kuai, J. Worden, C. Frankenberg, G. Rivera, A.D. Aubrey, C.E. Miller, N.K. Malakar, J.M. Sánchez Tomás, and K.T. Holmes. 2016. High spatial resolution imaging of methane and other trace gases with the airborne Hyperspectral Thermal Emission Spectrometer (HyTES). Atmospheric Measurement Techniques 9:2393–2408. https://doi.org/10.5194/amt-9-2393-2016
Related Datasets
Hook, S.J., G.C. Hulley, T.T. La, G. Rivera, W.R. Johnson, and B.T. Eng. 2026. HyTES Level 1 Radiance, Facility Instrument Collection. ORNL DAAC, Oak Ridge, Tennessee, USA. https://doi.org/10.3334/ORNLDAAC/2462
Hulley, G.C., S. Hook, T.T. La, G. Rivera, W.R. Johnson, and B.T. Eng. 2026. HyTES L2 Emissivity and Land Surface Temperature, Facility Instrument Collection. ORNL DAAC, Oak Ridge, Tennessee, USA. https://doi.org/10.3334/ORNLDAAC/2460
Hook, S.J., G.C. Hulley, T.T. La, G. Rivera, W.R. Johnson, and B.T. Eng. 2026. HyTES Level 1 Radiance Overlays, Facility Instrument Collection. ORNL DAAC, Oak Ridge, Tennessee, USA. https://doi.org/10.3334/ORNLDAAC/2466
Acknowledgement
The HyTES instrument is maintained and operated by the Airborne Sensor Facility (ASF) at NASA Ames Research Center in Mountain View, California, under the oversight of the EOS Project Science Office at NASA Goddard. Data processing was conducted at NASA Ames Research Center and the Jet Propulsion Laboratory at the California Institute of Technology in Pasadena, California.
Data Characteristics
Spatial Coverage: Portions of North America, Europe, South Africa, and Hawaii
Temporal Coverage: 2014-07-03 to 2023-11-15
Temporal Resolution: One-time estimate
Study Area: Latitude and longitude are given in decimal degrees.
| Site | Northernmost Latitude | Southernmost Latitude | Easternmost Longitude | Westernmost Longitude |
| North America, Europe, South Africa, and Hawaii | 68.6566 | -34.8860 | 26.3672 | -159.6094 |
Data File Information
There are 6151 files in compressed Keyhole Markup Language (*.kmz) format. Overlays of land surface temperature (LST) are included for all flight scenes. Emissivity overlays are included for 2019 to 2023 only.
The file naming convention varies by year:
2013-2016: <flight prefix>.<loc>.Line<a>-Run<b>-Segment<c>.L2-LST.kmz, where
- <flight prefix> = flight line identifier with date and time of acquisition, YYYY-MM-DD.hhmmss, encoding the date and time by year (YYYY), month (MM), day (DD), hour (hh), minute (mm), and second (ss) of the flight (e.g., 2013-06-24.182842).
- <loc> = location name, e.g., “GarfieldCO”.
- <a>, <b>, and <c> indicate the line, run, and segment, respectively, numbers of the flight scene.
2017-2018: <flight prefix>_<loc>_L2-LST.kmz, where
- <flight prefix> = flight line identifier, YYYYMMDDthhmmss, encoding the date and time by year (YYYY), month (MM), day (DD), hour (hh), minute (mm), and second (ss) of the flight (e.g., 20180118t191911).
- <loc> = location name, e.g., “PlacerCA”.
2019-2023: <flight prefix>_<loc>_L2-<product>_<build>_<ver>.kmz, where
- <flight prefix> = flight line identifier, YYYYMMDDthhmmss, encoding the date and time by year (YYYY), month (MM), day (DD), hour (hh), minute (mm), and second (ss) of the flight (e.g., 20230426t205423).
- <loc> = location name, e.g., “Division2CA”.
- <product> = either “LST” for land surface temperature or “emis_183100058” for emissivity.
- <build> = software build ID: “B103”.
- <ver> = incremental version number, e.g., “V03”.
Example file names:
- 2014-07-03.172752.CanyonLands.Line1-Run1-Segment01.L2-LST.kmz
- 20180918t194109_MegaboxLine50CA_L2-LST.kmz
- 20190501t211110_YoloCA_L2-LST_B103_V01.kmz
- 20190501t211110_YoloCA_L2-emis_183100058_B103_V01.kmz
The KMZ files use geographic coordinates based on the WGS 84 datum (EPSG: 4326).
Application and Derivation
HyTES was designed to provide high spectral and spatial resolution thermal infrared (TIR) data. It is useful for a number of applications, including high-resolution surface temperature and emissivity measurements, detection of trace gases such as methane, and volcano observations.
These overlay images are viewable in Google Earth as well as other GIS software, and allow the user to visualize the footprint of HyTES image scenes with the general pattern of the data. For LST, clicking on the filename in the “Places” column of Google Earth will show the colorbar key. For emissivity, clicking on the filename provides the band information for the RGB composite.
Quality Assessment
None provided for the KMZ files. The campaign calibration files are available at https://doi.org/10.3334/ORNLDAAC/2468.
Data Acquisition, Materials, and Methods
The HyTES is an airborne imaging spectrometer with 256 spectral channels between 7.5 and 12 micrometers in the thermal infrared part of the electromagnetic spectrum and 512 pixels cross-track. HyTES incorporates several technologies including a Dyson spectrometer, long, straight slit, curved diffraction grating and Quantum Well Infrared Photodetector (QWIP). It has been deployed on NASA’s Twin Otter, ER-2, and GulfStream V aircraft.
HyTES was developed to support the Hyperspectral Infrared Imager (HyspIRI) mission and has been flown since 2012. (Johnson et al., 2011; Hook et al., 2013). It provides high spatial and high spectral resolution data on surface temperature and emissivity (Hulley et al., 2016b). Its capabilities include identification of air pollution point sources (Hulley et al., 2016a) and geological studies. Additional details about the HyTES instrument are available at https://hytes.jpl.nasa.gov.
The emissivity overlays are composite RGB overlays derived from radiance bands 150 (10.1 µm), 100 (9.2 µm), and 58 (8.5 µm). Both emissivity and LST were derived from L1 radiance data (Hook et al., 2026a) using Temperature Emissivity Separation (TES) algorithm (Gillespie et al., 1998) with an In-Scene Atmospheric Correction (ISAC) approach that is elevation-dependent based on a clustering approach for HyTES channels from 8.2-11.5 µm (only clear window channels and well-calibrated data).
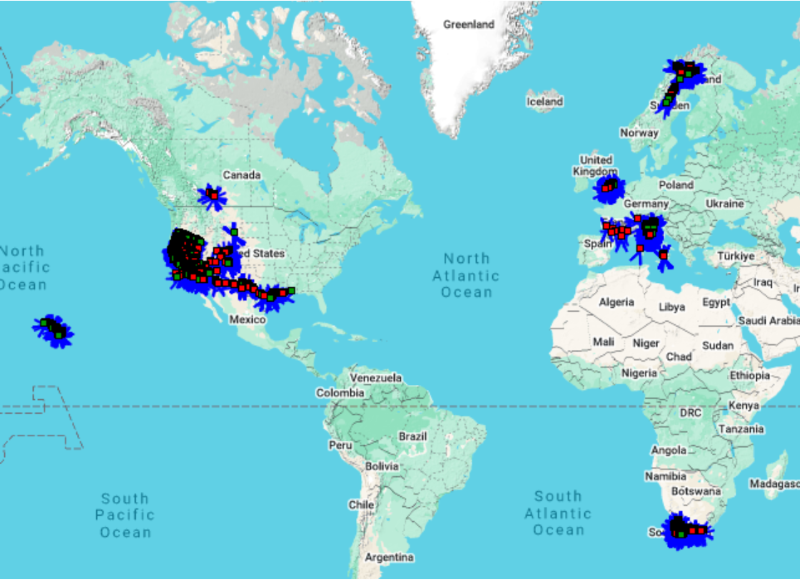
Figure 2. Global distribution of HyTES flights.
Data Access
These data are available through the Oak Ridge National Laboratory (ORNL) Distributed Active Archive Center (DAAC).
HyTES Level 2 Emissivity and LST Overlay Images, Facility Instrument Collection
Contact for Data Center Access Information:
- E-mail: uso@daac.ornl.gov
- Telephone: +1 (865) 241-3952
References
Gillespie, A., S. Rokugawa, T. Matsunaga, J.S. Cothern, S. Hook and A. B. Kahle. 1998. A temperature and emissivity separation algorithm for Advanced Spaceborne Thermal Emission and Reflection Radiometer (ASTER) images. IEEE Transactions on Geoscience and Remote Sensing 36:1113-1126. https://doi.org/10.1109/36.700995
Hook, S.J., G.C. Hulley, T.T. La, G. Rivera, W.R. Johnson, and B.T. Eng. 2025. HyTES Campaign Calibration Data, Facility Instrument Collection. ORNL DAAC, Oak Ridge, Tennessee, USA. https://doi.org/10.3334/ORNLDAAC/2468
Hook, S.J., G.C. Hulley, T.T. La, G. Rivera, W.R. Johnson, and B.T. Eng. 2026a. HyTES Level 1 Radiance, Facility Instrument Collection. ORNL DAAC, Oak Ridge, Tennessee, USA. https://doi.org/10.3334/ORNLDAAC/2462
Hook, S.J., G.C. Hulley, T.T. La, G. Rivera, W.R. Johnson, and B.T. Eng. 2026b. HyTES Level 1 Radiance Overlays, Facility Instrument Collection. ORNL DAAC, Oak Ridge, Tennessee, USA. https://doi.org/10.3334/ORNLDAAC/2466
Hook, S.J., W.R. Johnson, and M.J. Abrams. 2013. NASA’s Hyperspectral Thermal Emission Spectrometer (HyTES). In: C. Kuenzer and S. Dech (eds). Thermal Infrared Remote Sensing. Remote Sensing and Digital Image Processing, vol 17. Springer, Dordrecht. https://doi.org/10.1007/978-94-007-6639-6_5
Hulley, G.C., R.M. Duren, F.M. Hopkins, S.J. Hook, N. Vance, P. Guillevic, W.R. Johnson, B.T. Eng, J.M. Mihaly, V.M. Jovanovic, S.L. Chazanoff, Z.K. Staniszewski, L. Kuai, J. Worden, C. Frankenberg, G. Rivera, A.D. Aubrey, C.E. Miller, N.K. Malakar, J.M. Sánchez Tomás, and K.T. Holmes. 2016. High spatial resolution imaging of methane and other trace gases with the airborne Hyperspectral Thermal Emission Spectrometer (HyTES). Atmospheric Measurement Techniques 9:2393–2408. https://doi.org/10.5194/amt-9-2393-2016
Hulley, G.C., S. Hook, T.T. La, G. Rivera, W.R. Johnson, and B.T. Eng. 2026. HyTES L2 Emissivity and Land Surface Temperature, Facility Instrument Collection. ORNL DAAC, Oak Ridge, Tennessee, USA. https://doi.org/10.3334/ORNLDAAC/2460
Johnson, W.R., S. J. Hook, P. Mouroulis, D.W. Wilson, S.D. Gunapala, v. Realmuto, A. Lamborn, C. Paine, J.M. Mumolo, and B.T. Eng. 2011. HyTES: Thermal imaging spectrometer development. IEEE Explore: Conferences, 2011 Aerospace Conference, Big Sky, Montana, USA. https://doi.org/10.1109/AERO.2011.5747394