Documentation Revision Date: 2026-05-14
Dataset Version: 1
Summary
The NASA HyTES is an airborne imaging spectrometer with 256 spectral channels between 7.4 and 12 micrometers in the thermal infrared part of the electromagnetic spectrum and 512 pixels cross-track. HyTES has been deployed on DHC-6 Twin Otter, NASA’s ER-2, and GulfStream-V aircraft and completed its first flights in July 2012.
NASA facility instruments operate out of a NASA research center and support multiple science disciplines, field investigations, and NASA science objectives. Facility instruments are supported by managers in the Earth Science Division (ESD) Research and Analysis Program, and/or the Earth Observation System (EOS) Project Science Office.
This dataset includes the L2 products from the HyTES flights starting from 2014-07-03. Data are provided in in HDF-5 format. The ATBD document (Hulley et al., 2016b) is included as a companion file.
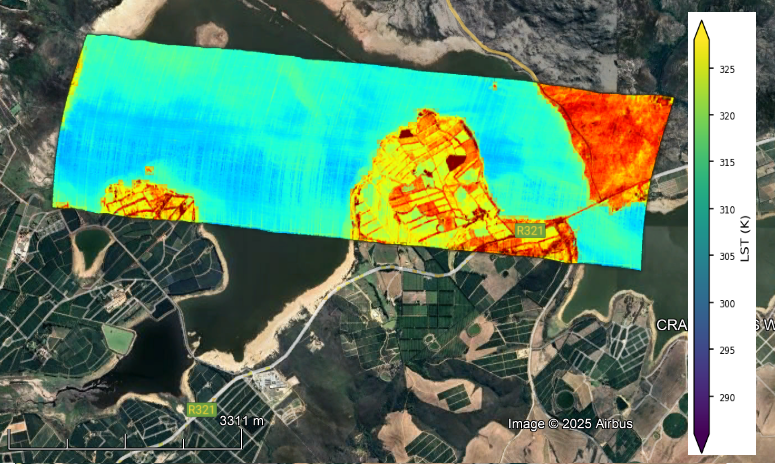
Figure 1. Land surface temperature (LST) derived from NASA's Hyperspectral Thermal Emission Spectrometer (HyTES) imagery acquired on November 15, 2023. This scene is located west of Theewaterskloof, Western Cape province, South Africa (approximately -34.02 latitude, 19.17 longitude). Background image from Google Earth and Airbus.
Citation
Hulley, G.C., S.J. Hook, T.T. La, G. Rivera, W.R. Johnson, and B.T. Eng. 2026. HyTES: Level 2 Emissivity and Land Surface Temperature. ORNL DAAC, Oak Ridge, Tennessee, USA. https://doi.org/10.3334/ORNLDAAC/2460
Table of Contents
- Dataset Overview
- Data Characteristics
- Application and Derivation
- Quality Assessment
- Data Acquisition, Materials, and Methods
- Data Access
- References
Dataset Overview
Project: HyTES
The Hyperspectral Thermal Emissions Spectrometer (HyTES) is an airborne pushbroom imaging spectrometer developed by the Jet Propulsion Laboratory (JPL). It was designed to support the previous Hyperspectral Infrared Imager (HyspIRI) mission study and has been used in several research missions since July 2012. HyTES offers high spatial and spectral resolution measurements of brightness temperature (radiance), emissivity, and land surface temperature. It operates across 256 spectral channels between 7.5 and 12 µm wavelengths. HyTES instrument has 512 pixels across track with pixel sizes in the range of 5 to 50 m depending on the flight altitude. HyTES was funded through NASA's Earth Science Technology Office (ESTO) Instrument Incubator Program (IIP).
This dataset contains Level 2 (L2) land surface temperature (LST) and emissivity from the Hyperspectral Thermal Emission Spectrometer (HyTES) instrument. This is the NASA Earth Observing System Data and Information System (EOSDIS) facility instrument archive of these data. This collection includes the standard emissivity product for HyTES channels from 8-11.5 µm, PC regression (PCemis) modeled emissivity from 7.4-12 µm with the same dimensions as the Level 1A radiance data, the LST derived from atmospherically corrected radiance, and in-scene atmospheric corrections (ISAC). The data are provided in HDF-5 format.
The NASA HyTES is an airborne imaging spectrometer deployed on DHC-6 Twin Otter, NASA’s ER-2, and GulfStream-V aircraft and completed its first flights in July 2012.
NASA facility instruments operate out of a NASA research center and support multiple science disciplines, field investigations, and NASA science objectives. Facility instruments are supported by managers in the Earth Science Division (ESD) Research and Analysis Program, and/or the Earth Observation System (EOS) Project Science Office.
This set of HyTES Facility Instrument datasets will include the L2 files from the HyTES flights starting from 2014-07-03.
Related Publications
Hulley, G.C., S. Hook, W. Johnson, P. Guillevic, and N. Malakar. 2016b. Hyperspectral Thermal Emission Spectrometer (HyTES) Level-2 Land Surface Temperature and Emissivity Algorithm Theoretical Basis Document. NASA Jet Propulsion Laboratory, California Institute of Technology; Pasadena, California. https://hytes.jpl.nasa.gov/downloads/atbds/HyTES_L2_ATBD.pdf
Hulley, G.C., R.M. Duren, F.M. Hopkins, S.J. Hook, N. Vance, P. Guillevic, W.R. Johnson, B.T. Eng, J.M. Mihaly, V.M. Jovanovic, S.L. Chazanoff, Z.K. Staniszewski, L. Kuai, J. Worden, C. Frankenberg, G. Rivera, A.D. Aubrey, C.E. Miller, N.K. Malakar, J.M. Sánchez Tomás, and K.T. Holmes. 2016. High spatial resolution imaging of methane and other trace gases with the airborne Hyperspectral Thermal Emission Spectrometer (HyTES). Atmospheric Measurement Techniques 9:2393–2408. https://doi.org/10.5194/amt-9-2393-2016
Kuai, L., J. R. Worden, K.-F. Li, G. C. Hulley, F. M. Hopkins, C. E. Miller, S. J. Hook, R. M. Duren, and A. D. Aubrey. 2016. Characterization of anthropogenic methane plumes with the Hyperspectral Thermal Emission Spectrometer (HyTES): a retrieval method and error analysis. Atmospheric Measurement Techniques 9:3165–3173. https://doi.org/10.5194/amt-9-3165-2016
Kuai, L., O. V. Kalashnikova, F. M. Hopkins, G. C. Hulley, H. Lee, M. J. Garay, R. M. Duren, J. R. Worden, and S. J. Hook. 2019. Quantification of Ammonia Emissions With High Spatial Resolution Thermal Infrared Observations From the Hyperspectral Thermal Emission Spectrometer (HyTES) Airborne Instrument. IEEE Journal of Selected Topics in Applied Earth Observations and Remote Sensing 12:4798–4812. https://doi.org/10.1109/JSTARS.2019.2918093
Related Datasets
Hook, S.J., G.C. Hulley, T.T. La, G. Rivera, W.R. Johnson, and B.T. Eng. 2026. HyTES Level 1 Radiance, Facility Instrument Collection, 2013-2016. ORNL DAAC, Oak Ridge, Tennessee, USA. https://doi.org/10.3334/ORNLDAAC/2476
Hook, S.J., G.C. Hulley, T.T. La, G. Rivera, W.R. Johnson, and B.T. Eng. 2026. HyTES Level 1 Radiance, Facility Instrument Collection. ORNL DAAC, Oak Ridge, Tennessee, USA. https://doi.org/10.3334/ORNLDAAC/2462
- The Level 2 products were derived from these Level 1 radiance data.
Hook, S.J., G.C. Hulley, T.T. La, G. Rivera, W.R. Johnson, and B.T. Eng. 2026. HyTES L1 Geolocation, Facility Instrument Collection, 2013-2016. ORNL DAAC, Oak Ridge, Tennessee, USA. https://doi.org/10.3334/ORNLDAAC/2467
Hook, S.J., G.C. Hulley, T.T. La, G. Rivera, W.R. Johnson, and B.T. Eng. 2026. HyTES L1 Geolocation, Facility Instrument Collection. ORNL DAAC, Oak Ridge, Tennessee, USA. https://doi.org/10.3334/ORNLDAAC/2459
- These geolocation datasets provide coordinates for each pixel in the L2 products.
Acknowledgments
The HyTES instrument is maintained and operated by the Airborne Sensor Facility (ASF) at NASA Ames Research Center in Mountain View, California, under the oversight of the EOS Project Science Office at NASA Goddard. Data processing was conducted at NASA Ames Research Center and the Jet Propulsion Laboratory at the California Institute of Technology in Pasadena, California.
Data Characteristics
Spatial Resolution: 5-50 m; variable (altitude dependent)
Temporal Coverage: 2014-07-03 to present
Temporal Resolution: One-time estimate
Data File Information
This collection consists of files in HDF-5 format. Each file holds the standard emissivity product, PC regression (PCemis) emissivity, land surface temperature, and in-scene atmospheric corrections (ISAC) (Tables 1-2).
The file naming convention for files from 2014-2016 is <flight prefix>.<time>.<loc>.<line>-<run>-<segment>.L2.hdf5, where
- <date> = image acquisition date in YYYY-MM-DD, UTC
- <time> = image acquisition time in HHMMSS, UTC.
- <loc> = location name (e.g., “NorthDeathValley”).
- <line>-<run>-<segment> = line, run, and segment information for the flight scene.
Example file name: 2014-07-03.222122.NorthDeathValley.Line1-Run1-Segment01.L2.hdf5
The file naming convention for files from 2017 onwards is <flight prefix>_<loc>_L2_<build>_<ver>.hdf5, where
- <flight prefix> = flight line identifier, YYYMMDDthhmmss, encoding the date and time by year (YYYY), month (MM), day (DD), hour (hh), minute (mm), and second (ss) of the flight (e.g., 20231115t105320).
- <loc> = location name, e.g., “GarfieldCO”.
- <build> = software build ID: “B200”. The files before 2019 do not have <build> in their names.
- <ver> = incremental version number, e.g., “V06”. The files before 2019 do not have <ver> in their names.
Example file names: 20231115t105320_RooibergBox12ZA_L2_B200_V06.hdf5, 20170608t230921_GarfieldCO_L2.hdf5
HDF File Details
- 512 samples for data from 2014 and later.
- A variable number of lines
- Data type: Float32
The HDF-5 files are structured in instrument pixel coordinates (lines x samples). The “lines” dimension is the pixel identifier in the along-track (flight path) direction, indicating the row location of a pixel from the sensor image. The “samples” dimension is the pixel identifier in the across-track direction, indicating the column location of a pixel from the sensor image.
User Note: Per-pixel geolocation information is available from the L1 Geolocation datasets (https://doi.org/10.3334/ORNLDAAC/2459, https://doi.org/10.3334/ORNLDAAC/2467). Those geolocation files share the same file naming pattern as the L2 files in this dataset.
Companion File: HyTES_L2_ATBD.pdf is the ATBD document for HyTES L2 land surface temperature and emissivity (Hulley et al., 2016b) is included.
Table 1. Variables in the HDF-5 files (2014-2016).
| Variable | Description | Dimensions |
|---|---|---|
| isac_sky_down_scaled | In-scene atmospheric correction parameters | 256 bands |
| isac_sky_up_scaled | ||
| isac_trans_scaled | ||
| l2_PCemis | L2 PCemis emissivity product generated from a principal component (PC) eigenvector regression approach to produce emissivity for all HyTES channels (7.4-12 µm) with same dimensions as the Level 1A data | lines x 512 samples x 256 bands |
| l2_PCemis_wavelengths | Wavelengths for l2_PCemis product in µm | 256 bands |
| l2_emissivity | Standard emissivity product covering 202 bands over the Temperature Emissivity Separation (TES) algorithm window (8-11.5 µm) | lines x 512 samples x 202 bands |
| l2_emissivity_smooth | Standard emissivity product with smoothing applied | lines x 512 samples x 202 bands |
| l2_emissivity_wavelengths | Wavelengths for the l2_emissivity product in µm | 202 bands |
| l2_land_surface_temperature | Land surface temperature in degrees Kelvin | lines x 512 samples |
Table 2. Variables in the HDF-5 files (2017-present).
| Variable | Description | Dimensions |
|---|---|---|
| ISAC_Path_Rad | In-scene atmospheric correction parameters | 256 bands |
| ISAC_Skydown_Rad | ||
| L2_Emissivity_PC | L2_Emissivity_PC emissivity product generated from a principal component (PC) eigenvector regression approach to produce emissivity for all HyTES channels (7.4-12 µm) with same dimensions as the Level 1A data | lines x 480 samples x 256 bands |
| L2_Emissivity_PC_Wavelengths | Wavelengths for L2_Emissivity_PC product in µm | 256 bands |
| L2_Emissivity | Standard emissivity product covering 164 bands over the Temperature Emissivity Separation (TES) algorithm window (8-11 µm). Note that we limited the window to 11µm to avoid calibration issues between 11-12 µm. | lines x 480 samples x 164 bands |
| L2_Emissivity_Wavelengths | Wavelengths for the L2_Emissivity product in µm | 164 bands |
| L2_LST | Land surface temperature in degrees Kelvin | lines x 480 samples |
| Transmission | Atmospheric transmittance | 256 bands |
Application and Derivation
HyTES was developed by NASA/JPL through the Earth Science Technology Office Instrument Incubator Program as an airborne testbed to support the HyspIRI Decadal Survey mission, providing high spectral and spatial resolution TIR data to determine optimal band positions for the HyspIRI TIR instrument, and has since expanded its programmatic role to support NASA's Surface Biology and Geology (SBG) mission and a joint ESA–NASA airborne campaign informing ESA's proposed Land Surface Temperature Monitoring (LSTM) Copernicus mission.
HyTES data have been used across a remarkably broad range of scientific applications: detection and quantification of greenhouse gas and trace gas plumes - including methane from oil fields and dairy operations, ammonia from feedlots and wildfires, and co-located species such as H2S, SO2, and NO2 - at meter-scale spatial resolution enabling direct source attribution; derivation of land surface temperature and emissivity for evapotranspiration estimation using surface energy balance models validated against eddy covariance measurements; characterization of plant species canopy emissivity and temperature at the Huntington Botanical Gardens with LiDAR-correlated canopy structure analysis, directly informing ECOSTRESS science objectives; surface mineral mapping at sites such as Cuprite and Death Valley to support compositional Earth science; and volcano thermal anomaly monitoring.
HyTES has flown on the Twin Otter at low altitudes and has been reconfigured for the high-altitude ER-2 aircraft for wider-swath coverage, and contributed data to major field campaigns including COMEX, the HyspIRI Megabox campaign, and the SHIFT campaign over Santa Barbara County, cementing its role as the primary NASA airborne thermal infrared science and technology bridge between legacy instruments and next-generation spaceborne TIR missions.
Quality Assessment
Signal response function information for the underlying radiance data are available in the HyTES L1 Radiance Facility Instrument dataset (https://doi.org/10.3334/ORNLDAAC/2462).
Data Acquisition, Materials, and Methods
The Hyperspectral Thermal Emission Spectrometer (HyTES) is an airborne imaging spectrometer with 256 spectral channels between 7.5 and 12 micrometers in the thermal infrared part of the electromagnetic spectrum and 512 pixels cross-track. HyTES incorporates several technologies including a Dyson spectrometer, long, straight slit, curved diffraction grating. The first version of HyTES used a Quantum Well Infrared Photodetector (QWIP). In 2021, the QWIP was replaced by a Barrier InfraRed Detector Focal Plane Array (BIRD FPA) to improve detector uniformity. HyTES has been deployed on NASA’s Twin Otter, ER-2, and GulfStream V aircraft and completed its first flights in July 2012.
HyTES was developed to support the Hyperspectral Infrared Imager (HyspIRI) mission and has been flown since 2012. (Johnson et al., 2011; Hook et al., 2013). It provides high spatial and high spectral resolution data on surface temperature and emissivity (Hulley et al., 2016b). Its capabilities include identification of air pollution point sources (Hulley et al., 2016a) and geological studies. Additional details about the HyTES instrument are available at https://hytes.jpl.nasa.gov.
To generate these Level 2 products, raw imagery data were processed to Level-1 brightness temperature (radiance) at sensor (https://doi.org/10.3334/ORNLDAAC/2462). L2 emissivity and land surface temperature (LST) were derived from the L1 data (Hulley et al., 2016b).
Emissivity Data (l2_emissivity, L2_Emissivity)
This array contains HyTES emissivity spectral data from 8-11.5 µm with the same dimensions as the L1 data, except only 202 (2014-2016) or 164 (2017-onwards) 'window bands' were retrieved instead of 256. This is the standard emissivity product derived using the Temperature Emissivity Separation (TES) algorithm (Gillespie et al., 1998) with an In-Scene Atmospheric Correction (ISAC) approach for HyTES channels from 8-11.5 µm using only clear window channels and well-calibrated data. Spectral emissivity from 7.4-8 µm and 9.2-10 µm cannot be accurately derived due to strong water vapor and ozone absorption features respectively in this spectral domain. TES was not applied to channels above 11/11.5 µ due to calibration inconsistencies in this region.
PC Regression Emissivity Data (l2_PCemis, L2_Emissivity_PC)
This array contains HyTES emissivity data from 7.4-12 µm with the same dimensions as the Level 1A data. In order to produce emissivity for all HyTES bands, a separate product was generated. This product was derived using a Principal Component (PC) eigenvector regression approach to produce emissivity for all 256 HyTES channels. The eigenvectors were calculated using a set of ~150 lab spectra similar to the approach used to generate the MODBF product (Seemann et al., 2008). This technique produces a smoother spectrum that will fit all the original l2_PCemis data and extend emissivity estimates below 8 µm and above 11.5 µm.
Caution should be used when using this l2_PCemis or L2_Emissivity_PC product to identify geologic features because some features may be smoothed out or absent, or artificial.
Land Surface Temperature Data
LST Products were derived from atmospherically corrected L1 radiance data using the TES algorithm. These LST data are in units of Kelvin with the same dimensions as the L1 data except there is only one band.
Table 3. HyTES Instrument specifications.
| Instrument Characteristic | Specification |
|---|---|
| Mass (Scanhead) | 12 kg |
| Power | 400 W |
| Volume | 1 m x 0.5 m (cylinder) |
| Number of pixels x track | 512 |
| Number of bands | 256 |
| Spectral Range | 7.5 - 12 μm |
| Spectral Sampling Interval | 4.5 μm/256, (i.e. 17 nm) |
| Frame speed | 35 or 22 fps |
| Integration time (1 scanline) | 28 or 45 ms |
| Total Field of View | 50 degrees |
| Calibration (preflight) | Full Aperture Blackbody |
| Detector Temperature | 40 K |
| Spectrometer Temperature | 100 K |
| Slit Length and Width | 20 mm x 39 μm |
| IFOV | 1.7066 degrees |
| Pixel Size/Swath at 2,000 m flight altitude | 3.41 m/1868.33 m |
| Pixel Size/Swath at 20,000 m flight altitude | 34.13 m/18683.31 m |
| Saturation Temperatures | see Figure 2 |
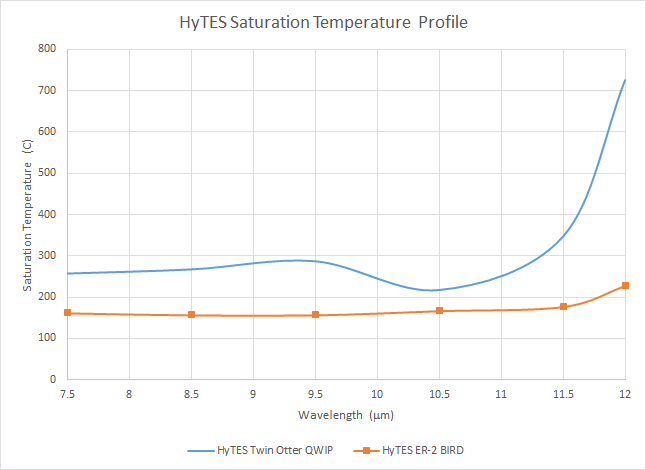
Figure 2. HyTES saturation temperature profiles for the Quantum Well Infrared Photodetector (QWIP) and Barrier InfraRed Detector Focal Plane Array (BIRD FPA).
Data Access
These data are available through the Oak Ridge National Laboratory (ORNL) Distributed Active Archive Center (DAAC).
HyTES: Level 2 Emissivity and Land Surface Temperature
Contact for Data Center Access Information:
- E-mail: uso@daac.ornl.gov
- Telephone: +1 (865) 241-3952
References
Gillespie, A., S. Rokugawa, T. Matsunaga, J.S. Cothern, S. Hook and A. B. Kahle. 1998. A temperature and emissivity separation algorithm for Advanced Spaceborne Thermal Emission and Reflection Radiometer (ASTER) images. IEEE Transactions on Geoscience and Remote Sensing 36:1113-1126. https://doi.org/10.1109/36.700995
Hook, S.J., G.C. Hulley, T.T. La, G. Rivera, W.R. Johnson, and B.T. Eng. 2026. HyTES Level 1 Radiance, Facility Instrument Collection, 2013-2016. ORNL DAAC, Oak Ridge, Tennessee, USA. https://doi.org/10.3334/ORNLDAAC/2476
Hook, S.J., G.C. Hulley, T.T. La, G. Rivera, W.R. Johnson, and B.T. Eng. 2026. HyTES Level 1 Radiance, Facility Instrument Collection. ORNL DAAC, Oak Ridge, Tennessee, USA. https://doi.org/10.3334/ORNLDAAC/2462
Hook, S.J., G.C. Hulley, T.T. La, G. Rivera, W.R. Johnson, and B.T. Eng. 2026. HyTES L1 Geolocation, Facility Instrument Collection, 2013-2016. ORNL DAAC, Oak Ridge, Tennessee, USA. https://doi.org/10.3334/ORNLDAAC/2467
Hook, S.J., G.C. Hulley, T.T. La, G. Rivera, W.R. Johnson, and B.T. Eng. 2026. HyTES L1 Geolocation, Facility Instrument Collection. ORNL DAAC, Oak Ridge, Tennessee, USA. https://doi.org/10.3334/ORNLDAAC/2459
Hook, S.J., W.R. Johnson, and M.J. Abrams. 2013. NASA’s Hyperspectral Thermal Emission Spectrometer (HyTES). In: C. Kuenzer and S. Dech (eds). Thermal Infrared Remote Sensing. Remote Sensing and Digital Image Processing, vol 17. Springer, Dordrecht. https://doi.org/10.1007/978-94-007-6639-6_5
Hulley, G.C., R.M. Duren, F.M. Hopkins, S.J. Hook, N. Vance, P. Guillevic, W. R. Johnson, B.T. Eng, J.M. Mihaly, V.M. Jovanovic, S.L. Chazanoff, Z.K.Staniszewski, L. Kuai, J. Worden, C. Frankenberg, G. Rivera, A.D. Aubrey, C.E. Miller, N.K. Malakar, J.M. Sánchez Tomás, and K.T. Holmes. 2016a. High spatial resolution imaging of methane and other trace gases with the airborne Hyperspectral Thermal Emission Spectrometer (HyTES). Atmospheric Measurement Techniques 9:2393–2408. https://doi.org/10.5194/amt-9-2393-2016
Hulley, G.C., S. Hook, W. Johnson, P. Guillevic, and N. Malakar. 2016b. Hyperspectral Thermal Emission Spectrometer (HyTES) Level-2 Land Surface Temperature and Emissivity Algorithm Theoretical Basis Document. NASA Jet Propulsion Laboratory, California Institute of Technology; Pasadena, California. https://hytes.jpl.nasa.gov/downloads/atbds/HyTES_L2_ATBD.pdf (and included as a companion file with this dataset)
Johnson, W.R., S. J. Hook, P. Mouroulis, D.W. Wilson, S.D. Gunapala, V. Realmuto, A. Lamborn, C. Paine, J.M. Mumolo, and B.T. Eng. 2011. HyTES: Thermal imaging spectrometer development. IEEE Explore: Conferences, 2011 Aerospace Conference, Big Sky, Montana, USA. https://doi.org/10.1109/AERO.2011.5747394
Kuai, L., J.R. Worden, K.-F. Li, G.C. Hulley, F. M. Hopkins, C E. Miller, S.J. Hook, R.M. Duren, and A.D. Aubrey. 2016. Characterization of anthropogenic methane plumes with the Hyperspectral Thermal Emission Spectrometer (HyTES): a retrieval method and error analysis. Atmospheric Measurement Techniques 9:3165–3173. https://doi.org/10.5194/amt-9-3165-2016
Kuai, L., O.V. Kalashnikova, F.M. Hopkins, G.C. Hulley, H. Lee, M.J. Garay, R.M. Duren, J.R. Worden, and S.J. Hook. 2019. Quantification of ammonia emissions with high spatial resolution thermal infrared observations from the Hyperspectral Thermal Emission Spectrometer (HyTES) airborne instrument. IEEE Journal of Selected Topics in Applied Earth Observations and Remote Sensing 12:4798–4812. https://doi.org/10.1109/JSTARS.2019.2918093
Seemann, S.W., E.E. Borbas, R.O. Knuteson, G.R. Stephenson, and H. Huang, 2008. Development of a global infrared land surface emissivity database for application to clear sky sounding retrievals from multispectral satellite radiance measurements. Journal of Applied Meteorology and Climatology 47:108–123. https://doi.org/10.1175/2007JAMC1590.1