Documentation Revision Date: 2026-05-14
Dataset Version: 1
Summary
This datasheet includes 214 files in Portable Document Format (*.pdf).
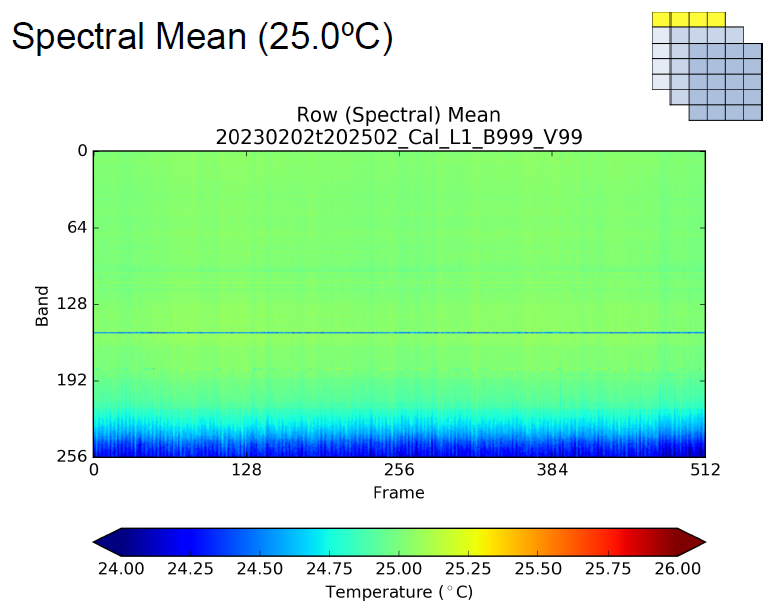
Figure 1. Mean spectral response by band to a black body target at 25 degrees C from calibration activities on February 2, 2023. Source: Calibration_Slides_20230202t202502_25.0C.pdf.
Citation
Hook, S.J., G.C. Hulley, T.T. La, G. Rivera, W.R. Johnson, and B.T. Eng. 2025. HyTES Campaign Calibration Data, Facility Instrument Collection. ORNL DAAC, Oak Ridge, Tennessee, USA. https://doi.org/10.3334/ORNLDAAC/2468
Table of Contents
- Dataset Overview
- Data Characteristics
- Application and Derivation
- Quality Assessment
- Data Acquisition, Materials, and Methods
- Data Access
- References
Dataset Overview
Project: HyTES
The Hyperspectral Thermal Emissions Spectrometer (HyTES) is an airborne pushbroom imaging spectrometer developed by the Jet Propulsion Laboratory (JPL). It was designed to support the previous Hyperspectral Infrared Imager (HyspIRI) mission study and has been used in several research missions since July 2012. HyTES offers high spatial and spectral resolution measurements of brightness temperature (radiance), emissivity, and land surface temperature. It operates across 256 spectral channels between 7.5 and 12 µm wavelengths. HyTES instrument has 512 pixels across track with pixel sizes in the range of 5 to 50 m depending on the flight altitude. HyTES was funded through NASA’s Earth Science Technology Office (ESTO) Instrument Incubator Program (IIP).
This dataset contains calibration data for the Hyperspectral Thermal Emission Spectrometer (HyTES) instrument. Calibration information is provided as a series of graphics saved in Portable Document Format (PDF). These graphics depict instrument responses to hot and cold black body targets by pixel and band as well as spectral response statistics. The NASA HyTES is an airborne imaging spectrometer deployed on DHC-6 Twin Otter, NASA’s Earth Resources ER-2, and GulfStream V aircraft, and completed its first flights in July 2012.
HyTES was designed to provide high spectral and spatial resolution thermal infrared (TIR) data as a precursor for NASA’s planned Hyperspectral Infrared Imager (HyspIRI) orbital mission. It is useful for a number of applications, including high-resolution surface temperature and emissivity measurements, point sources of air pollution, and volcano observations. NASA facility instruments operate out of a NASA research center and support multiple science disciplines, field investigations, and NASA science objectives. Facility instruments are supported by managers in the Earth Science Division (ESD) Research and Analysis Program, and/or the Earth Observation System (EOS) Project Science Office.
Related Publications
Hook, S.J., W.R. Johnson,and M.J. Abrams. 2013. NASA’s Hyperspectral Thermal Emission Spectrometer (HyTES). In: C. Kuenzer and S. Dech (eds). Thermal Infrared Remote Sensing. Remote Sensing and Digital Image Processing, vol 17. Springer, Dordrecht. https://doi.org/10.1007/978-94-007-6639-6_5
Hulley, G.C., R.M. Duren, F.M. Hopkins, S.J. Hook, N. Vance, P. Guillevic, W.R. Johnson, B.T. Eng, J.M. Mihaly, V.M. Jovanovic, S.L. Chazanoff, Z.K. Staniszewski, L. Kuai, J. Worden, C. Frankenberg, G. Rivera, A.D. Aubrey, C.E. Miller, N.K. Malakar, J.M. Sánchez Tomás, and K.T. Holmes. 2016. High spatial resolution imaging of methane and other trace gases with the airborne Hyperspectral Thermal Emission Spectrometer (HyTES). Atmospheric Measurement Techniques 9:2393–2408. https://doi.org/10.5194/amt-9-2393-2016
Related Datasets
Hook, S.J., G.C. Hulley, T.T. La, G. Rivera, W.R. Johnson, and B.T. Eng. 2026. HyTES Level 1 Radiance, Facility Instrument Collection. ORNL DAAC, Oak Ridge, Tennessee, USA. https://doi.org/10.3334/ORNLDAAC/2462
Hulley, G.C., S. Hook, T.T. La, G. Rivera, W.R. Johnson, and B.T. Eng. 2026. HyTES L2 Emissivity and Land Surface Temperature, Facility Instrument Collection. ORNL DAAC, Oak Ridge, Tennessee, USA. https://doi.org/10.3334/ORNLDAAC/2460
- These datasets hold Level 1 and Level 2 products relevant to the included calibration files.
Acknowledgement
The HyTES instrument is maintained and operated by the Airborne Sensor Facility (ASF) at NASA Ames Research Center in Mountain View, California, under the oversight of the EOS Project Science Office at NASA Goddard. Data processing was conducted at NASA Ames Research Center and the Jet Propulsion Laboratory at the California Institute of Technology in Pasadena, California.
Data Characteristics
Spatial Coverage: These calibration files are pertinent to HyTES deployments in Hawaii, conterminous U.S., Canada, United Kingdom, western and southern Europe, Scandinavia, and South Africa.
Spatial Resolution: NA for these laboratory measurements
Temporal Coverage: 2019-06-10 to 2023-11-15
Temporal Resolution: One-time measurments
Site Boundaries: Latitude and longitude are given in decimal degrees.
| Site | Westernmost Longitude | Easternmost Longitude | Northernmost Latitude | Southernmost Latitude |
|---|---|---|---|---|
| Hawaii, North America, Europe, South Africa | -159.61 | 26.37 | 68.86 | -34.89 |
Data File Information
There are 214 files in Portable Document Format (*.pdf). These files hold graphics depicting results for calibration activities conducted on the date encoded in the file name.
The file naming convention is Calibration_Slides_<date_time>_<temp>.pdf, where
- <date_time> = date and time of calibration in the form of YYYYMMDDthhmmss, encoding the date and time by year (YYYY), month (MM), day (DD), hour (hh), minute (mm), and second (ss) (e.g., 20200909t171542).
- <temp> = black body temperature as “25.0degC” or “25.0C”
Example file names: Calibration_Slides_20200911t141003_25.0degC.pdf, Calibration_Slides_20210720t071629_25.0C.pdf
Table 1. HyTES campaigns with calibration files.
| Campaign | Month(s), Year |
|---|---|
| UK_EURO | June, 2019 |
| Texas | October, 2019 |
| Western Diversity Time Series (WDTS) | September, 2020 |
| Grand Junction | May, 2021 |
| UK_EURO | July, 2021 |
| Grand Junction | March, 2022 |
| SoCal (southern California) | March, 2022 |
| Western Diversity Time Series (WDTS) | September, 2022 |
| G5 | November, 2022 |
| Calgary | April, 2023 |
| EURO | May-June-July, 2023 |
| PreBioSCape | September-October, 2023 |
| BioSCape | October-November, 2023 |
Application and Derivation
HyTES was designed to provide high spectral and spatial resolution thermal infrared (TIR) data. It is useful for a number of applications, including high-resolution surface temperature and emissivity measurements, detection of trace gases such as methane, and volcano observations.
These files document the calibration results for the HyTES instrument between 2019 - 2023 (e.g., Figure 2).
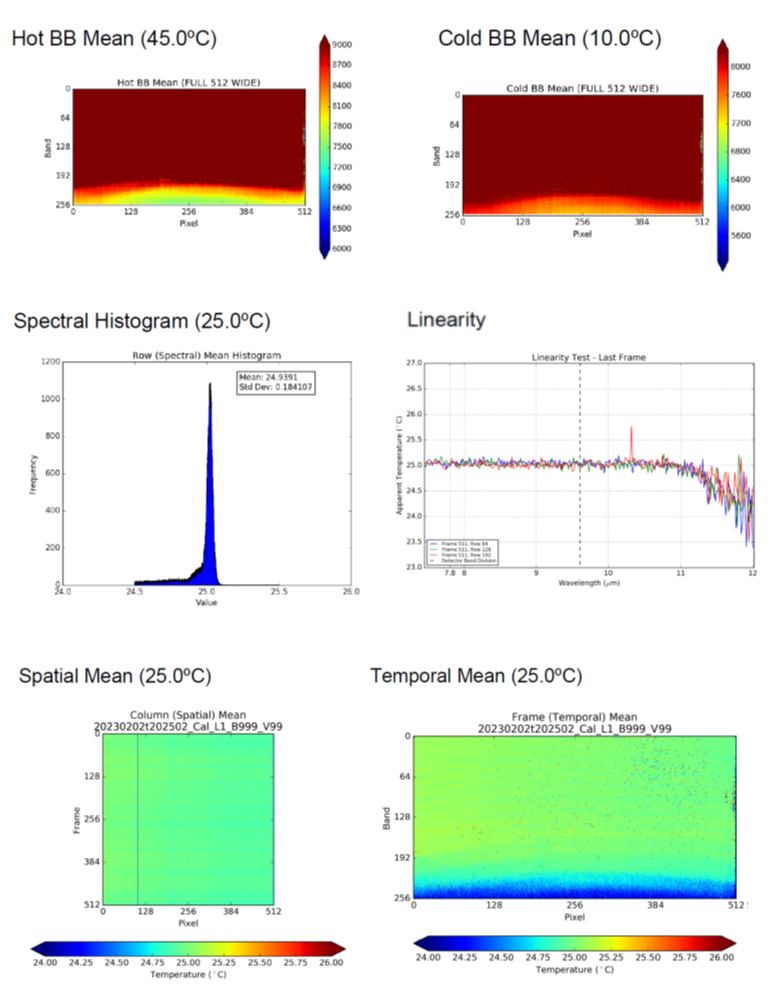
Figure 2. Representative graphics from Calibration_Slides_20230202t202502_25.0C.pdf.
Quality Assessment
None provided for these PDF files.
Data Acquisition, Materials, and Methods
The HyTES is an airborne imaging spectrometer with 256 spectral channels between 7.5 and 12 micrometers in the thermal infrared part of the electromagnetic spectrum and 512 pixels cross-track. HyTES incorporates several technologies including a Dyson spectrometer, long, straight slit, curved diffraction grating. The first version of HyTES used a Quantum Well Infrared Photodetector (QWIP). In 2021, the QWIP was replaced by a Barrier InfraRed Detector Focal Plane Array (BIRD FPA) to improve detector uniformity. HyTES has been deployed on NASA’s Twin Otter, ER-2, and GulfStream V aircraft and completed its first flights in July 2012.
HyTES was developed to support the Hyperspectral Infrared Imager (HyspIRI) mission and has been flown since 2012 (Johnson et al., 2011; Hook et al., 2013). It provides high spatial and high spectral resolution data on surface temperature and emissivity (Hulley et al., 2016b). Its capabilities include identification of air pollution point sources (Hulley et al., 2016a), measuring ecosystem functions (e.g., Pascolini-Campbell et al., 2024), and geological studies. Additional details about the HyTES instrument are available at https://hytes.jpl.nasa.gov.
Table 2. HyTES iInstrument specifications.
| Instrument Characteristic | Specification |
|---|---|
| Mass (Scanhead) | 12 kg |
| Power | 400 W |
| Volume | 1 m x 0.5 m (cylinder) |
| Number of pixels x track | 512 |
| Number of bands | 256 |
| Spectral Range | 7.5 - 12 µm |
| Spectral Sampling Interval | 4.5 µm / 256 (i.e. 17 nm) |
| Frame speed | 35 or 22 fps |
| Integration time (1 scanline) | 28 or 45 ms |
| Total Field of View | 50 degrees |
| Calibration (preflight) | Full Aperture Blackbody |
| Detector Temperature | 40 K |
| Spectrometer Temperature | 100 K |
| Slit Length and Width | 20 mm x 39 µm |
| IFOV | 1.7065999999999999 |
| Pixel Size/Swath at 2,000 m flight altitude | 3.41 m / 1868.33 m |
| Pixel Size/Swath at 20,000 m flight altitude | 34.13 m / 18683.31 m |
| Saturation Temperatures | see Figure 3 |
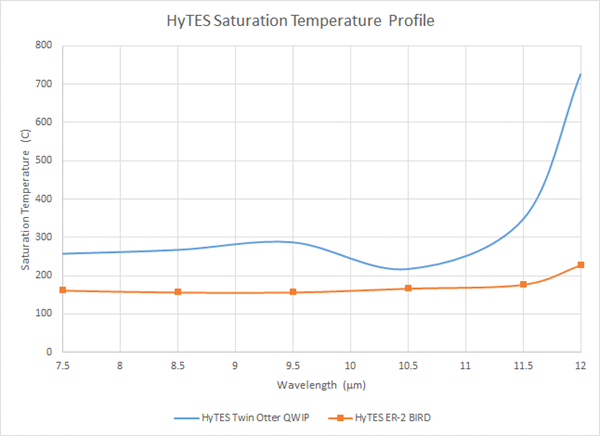
Figure 3. HyTES saturation temperature profiles for the for QWIP and BIRD FPA photodetectors.
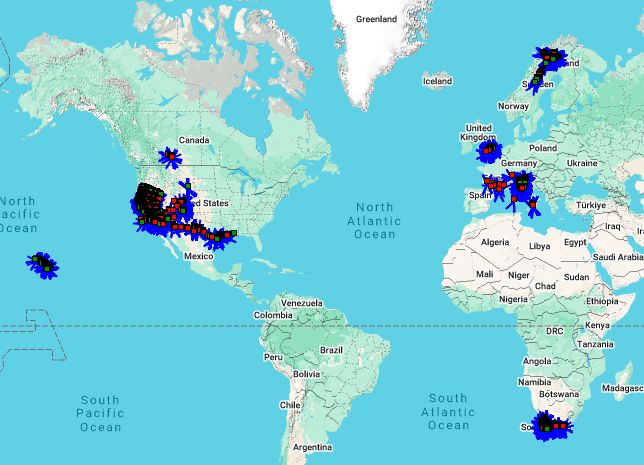
Figure 4. Global distribution of HyTES flights.
Data Access
These data are available through the Oak Ridge National Laboratory (ORNL) Distributed Active Archive Center (DAAC).
HyTES Campaign Calibration Data, Facility Instrument Collection
Contact for Data Center Access Information:
- E-mail: uso@daac.ornl.gov
- Telephone: +1 (865) 241-3952
References
Hook, S.J., G.C. Hulley, T.T. La, G. Rivera, W.R. Johnson, and B.T. Eng. 2026. HyTES Level 1 Radiance, Facility Instrument Collection. ORNL DAAC, Oak Ridge, Tennessee, USA. https://doi.org/10.3334/ORNLDAAC/2462
Hook, S.J., W.R. Johnson, and M.J. Abrams. 2013. NASA’s Hyperspectral Thermal Emission Spectrometer (HyTES). In: C. Kuenzer and S. Dech (eds). Thermal Infrared Remote Sensing. Remote Sensing and Digital Image Processing, vol 17. Springer, Dordrecht. https://doi.org/10.1007/978-94-007-6639-6_5
Hulley, G.C., R.M. Duren, F.M. Hopkins, S.J. Hook, N. Vance, P. Guillevic, W.R. Johnson, B.T. Eng, J.M. Mihaly, V.M. Jovanovic, S.L. Chazanoff, Z.K. Staniszewski, L. Kuai, J. Worden, C. Frankenberg, G. Rivera, A.D. Aubrey, C.E. Miller, N.K. Malakar, J.M. Sánchez Tomás, and K.T. Holmes. 2016. High spatial resolution imaging of methane and other trace gases with the airborne Hyperspectral Thermal Emission Spectrometer (HyTES). Atmospheric Measurement Techniques 9:2393–2408. https://doi.org/10.5194/amt-9-2393-2016
Hulley, G.C., S. Hook, T.T. La, G. Rivera, W.R. Johnson, and B.T. Eng. 2025. HyTES L2 Emissivity and Land Surface Temperature, Facility Instrument Collection. ORNL DAAC, Oak Ridge, Tennessee, USA. https://doi.org/10.3334/ORNLDAAC/2460
Johnson, W.R., S. J. Hook, P. Mouroulis, D.W. Wilson, S.D. Gunapala, v. Realmuto, A. Lamborn, C. Paine, J.M. Mumolo, and B.T. Eng. 2011. HyTES: Thermal imaging spectrometer development. IEEE Explore: Conferences, 2011 Aerospace Conference, Big Sky, Montana, USA. https://doi.org/10.1109/AERO.2011.5747394
Pascolini-Campbell, M., S. Hook, K. Mallick, M. Langsdale, G. Hulley, K. Cawse-Nicholson, T. Hu, G. Halverson, R.t Freepartner, G. Rivera, L. Genesio, and F. Rabuffi. 2024. A first assessment of airborne HyTES-based land surface temperature and evapotranspiration. Remote Sensing Applications: Society and Environment Volume 36:101344. https://doi.org/10.1016/j.rsase.2024.101344