Documentation Revision Date: 2025-10-09
Dataset Version: 1
Summary
This dataset holds three files in comma separated values format.
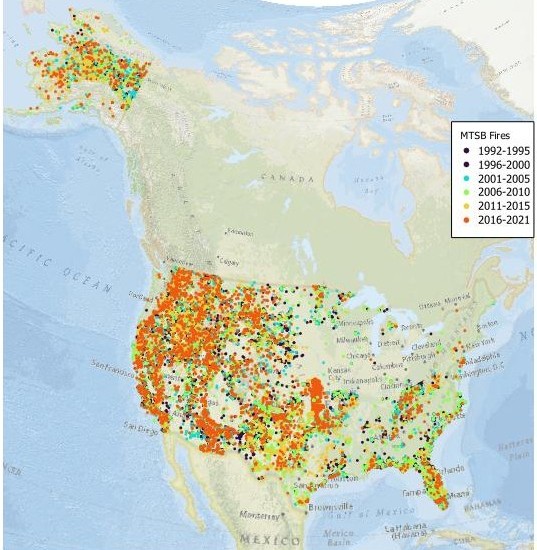
Figure 1. Fire events by year from Monitoring Trends in Burn Severity (MTBS) database for the contiguous U.S. and Alaska. Basemap: ESRI National Geographic.
Citation
Kasischke, E.S., N.H.F. French, M. Billmire, D. Redhuis, and C. Cook. 2025. An integrated Wildfire Event Dataset (iWED), Version 1, Continental U.S., 1992-2021. ORNL DAAC, Oak Ridge, Tennessee, USA. https://doi.org/10.3334/ORNLDAAC/2452
Table of Contents
- Dataset Overview
- Data Characteristics
- Application and Derivation
- Quality Assessment
- Data Acquisition, Materials, and Methods
- Data Access
- References
Dataset Overview
This dataset provides an integrated Wildfire Event Dataset (iWED version 1) for wildfire events of 100 ha or more in area from 1992 to 2021 for the continental US. Fire information was compiled from a variety of state, regional, and federal-level agencies responsible for filing and archiving incident level reports. Additional information was obtained from the Monitoring Trends in Burn Severity (MTBS) program initiated in the mid-2000s (Eidenshink et al., 2007). MTBS is being continuously updated as new satellite remote sensing data are collected and processed.
Project: Carbon Monitoring System
NASA's Carbon Monitoring System (CMS) project is designed to make significant contributions in characterizing, quantifying, understanding, and predicting the evolution of global carbon sources and sinks through improved monitoring of carbon stocks and fluxes. CMS uses NASA satellite observations and modeling/analysis capabilities to establish the accuracy, quantitative uncertainties, and utility of products for supporting national and international policy, regulatory, and management activities. CMS data products are designed to inform near-term policy development and planning.
Related Publication
Kasischke, E.S. and N.H. French. 2025. An integrated wildfire event database for improved fire science research for the continental United States, 1992-2021. Earth System Science Data (in preparation)
Acknowledgement
This work was supported by NASA's Interdisciplinary Science Program (grant 80NSSC24K0299).
Data Characteristics
Spatial Coverage: continental US including Alaska
Spatial Resolution: fire events >=100 ha
Temporal Coverage: 1992-01-01 to 2021-12-31
Temporal Resolution: daily
Study Area: (All latitudes and longitudes given in decimal degrees)
| Site | Northernmost Latitude | Southernmost Latitude | Easternmost Longitude | Westernmost Longitude |
|---|---|---|---|---|
| continental U.S. | 70.15 | 25.00 | -67.60 | -178.82 |
Data File Information
There are three files in comma separated values (CSV) format.
iWED_V1_wildfire_events.csv holds information on individual wildfire events (Table 1).
iWED_V1_event_notes.csv holds informative notes about wildfire events and data compilation. There are two fields in this CSV: "Note_number" and "Description".
iWED_V1_event_sources.csv holds a list of information sources used to develop the iWED_V1 dataset. There are four fields in this CSV: "Region" (National or Regional source), "Data_Source" (name of agency or database), "Description", and "URL" (as of September 2025). See Table 2.
Table 1. Variables in iWED_V1_wildfire_events.csv. More details about each variable are in Section 5.
| Variable | Units | Description |
|---|---|---|
| Event_Number | - | Fire event identification number |
| Primary_Source | - | Primary source for the wildfire event data (see Table 3) |
| Secondary_Sources | - | Secondary source for the wildfire event data (see Table 4) |
| Number_Large_MTBS_Perimeters | 1 | Number of large MTBS perimeters for an event |
| Number_Medium_MTBS_Perimeters | 1 | Number of medium MTBS perimeters for an event |
| Number_Small_MTBS_Perimeters | 1 | Number of small MTBS perimeters for an event |
| Primary_Note | - | Primary note on the development of data and information for a specific fire event. See matching record in iWED_V1_event_notes.csv. |
| Secondary_Notes | - | The secondary notes provide additional information on the development of data and information for a specific fire event (see Table 4) |
| Fire_Event_Name | Fire event name (when no name was provided, the fire was assigned Unnamed) | |
| Year | YYYY | The year during which the fire event occurred. |
| State | - | The state where the fire occurred (Table 6) |
| Start_DOY | d | The Julian day of year (DOY) when the fire event started (from fire management records) |
| End_DOY | d | The Julian day of year when the fire event ended or was controlled (from fire management records). Values >366 indicate that the end date occurred during the following year. End_DOY for following year = value - max(DOY) for previous year |
| Ignition_Source | - | Source of ignition for the fire event |
| Fire_Management_Size | acres | Fire event size from fire management databases and reports in acers |
| MTBS_Event_Size | acres | Fire event size for fire events contained within the Monitoring Trends in Burn Severity (MTBS) database in acres |
| MTBS_Event_Name | - | Fire event name in the MTBS database |
| MTBS_Fire_ID | - | MTBS identification number for the fire event |
| MTBS_Start_Date | YYYY-MM-DD | Start date of fire in MTBS |
| MTBS_Fire_Type | - | MTBS fire type: "Prescribed-PR", "Prescribed-Un", "Prescribed-WF", "Wildfire", "Unknown," "Unknown-PR", and "Unknown-WF" |
Application and Derivation
Many studies of wildfire regimes for different areas of the continental US have relied on datasets containing information from individual fire events for the entire US (Short, 2014, 2017, 2021; Eidenshink et al., 20007) or areas under the jurisdiction of specific federal or state agencies (see, e.g., Kasischke et al., 2002; Calkin et al., 2005; Westerling et al., 2002). These datasets have been compiled for various periods of time dating back to 1950. Kasischke and French (2025, in preparation) found a number of uncertainties existed within commonly used wildfire event datasets. A comparison of events contained within reports and datasets from state, regional and national fire management agencies showed the commonly used datasets contained incomplete or incorrect information on medium-sized and larger fire events (≥100 hectares, 247 acres) that have occurred over the past three decades. In addition, existing datasets do not always accurately report information on the wildfires managed as complexes, either failing to provide data on the individual fires within the complex or identify instances where individual fires within the complex have merged to form a single fire. Finally, it was discovered that some wildfires reported as single events consisted of multiple events. To address these shortcomings, information for wildfire events was harvested from multiple information sources to create an integrated wildfire event dataset containing wildfires ≥100 ha in size for the continental US for the period of 1992 to 2021.
Quality Assessment
Steps were employed to ensure that duplicate wildfire events were not included in this composite wildfire event dataset. Duplicate names, with minor differences in spelling were identified. Fire event size and the start day of year were used to identify duplicate events. Finally, for some events, the latitude and longitude of the suspected duplicate events were used. Wildfire events that spanned >1 state are reported as a single event.
The 2021 version of the USFS fire occurrence dataset included a column that allowed the matching of MTBS events with specific events within this dataset. In many cases, the MTBS fire event (especially fire events from the 1990s) were listed as “UNNAMED” when the fire event had a name in the USFS dataset. A careful comparison of UNNAMED MTBS fires not matched with USFS fire events was made with fires in the integrated fire event dataset. Comparisons between fire events were based initially on fire-event start date and size. When suspected matches were found, the latitudes and longitudes of the ignition points and MTBS fire perimeters were compared to make a final determination. UNNAMED MTBS fires that did not match existing fire events were then added to this dataset.
Three different types of data sources (Short, 2014) were used to create this dataset: (a) documentary fire records; (b) remote sensing analyses of individual fire events; and (c) archival summary reports, where some reports contain summaries of annual area burned and others contain summaries of larger wildfire events. There are issues with each of these information/data sources that introduce uncertainties when they are used to analyze trends in annual wildfire area burned. In addition, there are also issues with the methods used to estimate the size of individual wildfire events that also result in uncertainties.
Documentary fire records – The USFS fire occurrence dataset for 1992-2020 is based on harvesting of data from documentary fire records produced by a number of federal, state, and local agencies (Short, 2014). While records from federal agencies are the most complete, additional events were identified from federal reports reviewed for this study (see information in iWED_V1_event_notes.csv). Records produced by state and local agencies are incomplete, especially during the 1990s (Short, 2014; Short, 2015). Short (2014) observed that wildfire documentation in Texas by local and state agencies has been incomplete, which is supported by the larger number of additional fire events and area burned identified for the Southern Plains in the 1990s and 2000s. Finally, the higher area burned estimates contained in this dataset were due to addition of fire events ≥100 ha. While smaller events (< 100 ha) represent a very small portion of wildfire activity in the western US (2.5%), they represent a significant portion of area burned in Great Plains (15.3%) and the eastern US (48.3%). Based on the results from this study, it is likely that area burned for the Great Plains and eastern US regions are low.
Remote sensing analyses of individual fire events – In the creation of the two datasets presented here, information obtained from the MTBS archive was used in several ways. First, they were used to add additional fire events to this dataset. Second, they were used as a basis for estimating seasonal area burned in 1991 for most regions. And third, they were used to adjust fire size for some fire events. The uncertainties with fire sizes are discussed below. In regions where the majority of annual area burned is due to larger fire events, the MTBS archive represents a reasonable sample of wildfire activity. However, in areas such as the eastern US, where smaller wildfires dominate annual area burned, using information derived from MTBS data may underestimate fire activity. In addition, during the 1990s, coverage of the Landsat imagery used to generate the MTBS data was limited in some regions due to commercialization efforts and lack of receiving stations (Short, 2015). Uncertainties in the composite wildfire dataset may exist due to the inclusion of fires categorized as unknown that were actually wildfires.
Archival summary reports – Two sets of archival reports were used to create the annual wildfire area burned dataset, and a different set of uncertainties exist for each. The National Interagency Fire Center (NIFC) annual reports containing state-by-state estimates are based on a year-end compilation of individual fire reports. Such compilations may not include all events and thus underestimate area burned. In addition, more careful analysis of fire perimeter maps after a fire season often results in a revision of fire size, and may be different than the size used in the seasonal compilation. Short (2015) identified a number of issues that contributed to uncertainties in the USDA annual reports of area burned from 1926-1990. The vast majority of these issues concerned data collected prior to 1980, which was the primary reason the annual area burned dataset created here focused on the period of 1981-2020. The uncertainties with the data in these reports are difficult to quantify but are likely to include the fact that different methods were used to compile fire data records and estimate area burned by different agencies responsible for the collection of this information.
Fire event size – Between 1992-2020, the entire United States averaged some 77,800 wildfire events per year (based on the combined information from the USFS and composited wildfire event datasets), and ultimately, the uncertainty in estimates of annual area burned depend on the uncertainties associated with the measurement of fire event size. Wildfire managers define the size of an event as the area within its perimeter. Since the development of global positioning systems (GPS) and geographic information systems, it has been possible to accurately map fire perimeters and measure the areas within them to determine fire size. However, such mapping approaches are not applied to all fire events due to limitations on the availability of resources to map fire perimeters. It is likely that the vast majority of fire events (those <10 ha), which represent 9.2% of burned area on average across all regions, do not have their perimeters mapped using GPS.
Data Acquisition, Materials, and Methods
The data used to create the iWED version 1 came from two sources. First, a variety of state, regional, and federal-level agencies are responsible for filing and archiving incident level reports containing information on specific wildland fires (see Short, 2014) occurring between 1992 and 2021. The second source of information was from the large-fire dataset created as part of the Monitoring Trends in Burn Severity program initiated in the mid-2000s (Eidenshink et al., 2007). This dataset contains fire events for the entire continental United States and is being continuously updated as new satellite remote sensing data are collected and as resources needed to process the satellite imagery become available. This dataset, iWED version 1, was developed between June of 2017 and August 2025.
The information on individual fire events was collected and compiled by a variety of local, state, and federal land management agencies (Table 2). Each fire event has two spatial elements within most fire management datasets or reports: (1) the latitude and longitude of the fire ignition location of the centroid of the fire perimeter; and (2) the fire size which is measured as the area within the perimeter of the fire event. This Version 1 of iWED does not contain latitude and longitude for each event, but provides the state where the fire event occurred. A future version of this dataset will contain the latitude and longitude locations of the ignition point for a fire event or the centroid location of a fire perimeter.
Table 2. Sources of information on wildfire events. The file iWED_V1_event_sources.csv includes URLs for these sources (valid in September 2025).
| Source | Description |
|---|---|
| Monitoring Trends in Burn Severity Program | Interactive website that provides a listing of all wildfire events >1000 ha (500 ha in eastern states) and area burned in these events, where area burned has been measured using Landsat TM imagery. The website allows for downloading of PDF files containing images for each fire event. Finally, it also contains a database with information on all fire events. Data available for 1992-2022. |
| National Interagency Coordination Center | Archive of daily/weekly wildfire situations reports from 1992-2018. Reports available as PDF files. |
| National Interagency Fire Center | a. Microsoft EXCEL worksheet containing wildfire event information for the United States for different years |
| b. Microsoft EXCEL worksheets or PDF files containing wildfire information from 2002 to 2023 organized by the coordination centers of the National Interagency Coordination Center. Data available from this site include: (i) Incident Status Reports (ICS-209) reports submitted for large or significant wildfire events; and (ii) summary tables of all wildfire events for a given year. Information from 2002 and 2007 were not available. | |
| U.S. Forest Service | a. Microsoft Excel Worksheet containing fire event information from 1992-2015 for all states and territories in the United States (see Short, 2017). |
| b. Microsoft ACCESS Database containing fire event information from 1992-2018 for all states and territories in the United States (see Short, 2021). | |
| c. Microsoft ACCESS Database containing fire event information from 1992-2020 for all states and territories in the United States (see Short, 2022) | |
| U.S. Geological Survey | Microsoft Excel Worksheet containing fire event information from various regions of the United States for the 1980s to present (see Welty and Jeffires, 2021). |
| Alaska Interagency Coordination Center | Archive of daily wildfire situations reports from 1993-2020. Reports available as PDF files. |
| Cal Fire - State of California | a. Annual reports from 2010 to 2076, containing wildfire events >300 acres.Reports available as PDF files. |
| b. Table containing wildfire area burned for 1991 | |
| Great Basin Coordination Center | Annual reports containing a summary of fies >100 acres for Eastern Great Basin (Utah, southern Idaho), 2008-2014; Western Great Basin, 2000-2013; and entire region, 2015-2018. Reports available as PDF files. |
| Northern Rockies Coordination Center | Tables containing wildfire events >100 acres from 2001-2018. |
| Northwest interagency Coordination Center | Annual reports from 2004-2018 containing a summary of wildfires events >100 acres, Reports available as PDF files. |
| Rocky Mountain Area Coordination Center | Annual reports from 2001-2018 containing a summary of wildfire events >100 acres. Reports available as PDF files. |
| Southern Area Coordination Center | Annual reports from 2002-2004 and 2016-2018 containing a summary of wildfire events. |
| Southern California Geographic Coordination Center | Microsoft EXCEL Worksheet containing wildfire event information for 2004-2018 |
| Southwest Coordination Center | a. Microsoft Excel Worksheets containing information on wildfire events >100 ha from 2000-2018. |
| b. Table containing wildfire area burned for 1991. |
The methods used to identify specific wildfire events (in particular the visual interpretation of MTBS images of fire perimeters) are described in Kasischke and French (2025, in preparation).
Additional information for variables in Table 1:
- Primary_Source: identifies the initial source of the information, which is presented in Table 3. Those fire events that were named as complexes or had “complex” in their names (i.e., Fire_Management_Name or MTBS_Name) have a ‘cx’ designation in addition to a number. Duplicate events have a ‘d’ designation in addition to a number.
- Secondary_Source: identifies sources of additional information used to provide or modify variables for a wildfire event (Table 4). Note that information obtained through searches of the worldwide web served as both a primary and secondary data source. Of particular importance was the visual interpretation of MTBS imagery to identify events that contained multiple events (7mu), that contained multiple events that had joined (7j), to identify multiple events merged into a single fire (7mg), events named as complexes that were single events (7s), and to identify wind-driven events (7wd). Many of the Secondary Sources consist of an alpha-numeric code, where the letters provide information that was common to multiple events.
- Number_(Large|Medium|Small)_MTBS_Perimeters: Visual interpretation revealed that many MTBS events consisted of multiple perimeters. These perimeters were assigned a size class (large, medium, or small) based on a relative, not absolute, scale. The numbers of perimeters are provided in three variables.
- Primary_Note: identifies an event where additional information is included in iWED_V1_event_notes.csv. These notes document the steps used to develop data and information for specific wildfire events. These discussions include the URLs for information sources as well as visual interpretation approaches used to develop information.
- Secondary_Notes: For some events more than one approach was used.
- Fire_Event_Name: Name based on the original source for a fire event from fire management sources or from MTBS archives. When no name was provided, the event was named “Unnamed”. For some events that were Unnamed from their primary source, an event name was provided from a secondary source. These events are identified with the secondary source following an “n”. For some events, the Fire_Event_Name was changed. First, the name was changed when two or more single events merged into a single event. Here, the names of the individual fire events were used separated by a slash (/). Second, where a single complex fire was found to consist of individual fires, the name was changed when the names of the individual fires were added to the complex name, separated by a dash (-). When no name was available for an event where multiple individual fires were found, those events were named FIRE-1, FIRE-2, etc. based on the number of unnamed events within the complex.
- State: Abbreviation used to identify the state where a fire event occurred (Table X).
- Fire_Management_Size: Fire area initially based on the size provided by a fire management source (Primary_Source). A number of circumstances resulted in changing the fire management size for an event, which are discussed in the Primary_Note (iWED_V1_event_notes.csv) and Secondary_Source variables.
- MTBS_Event_Size: Initially based on the size provided by the MTBS database. A number of circumstances resulted in changing the MTBS size of the event, which are discussed in the Primary_Note (iWED_V1_event_notes.csv) and Secondary_Source variables.
- MTBS_Event_Name: The name given by the MTBS program. This name was changed under three circumstances. First, when it was determined that an MTBS fire had multiple perimeters, those perimeters >100 acres in size were identified as NAME – FIRE 1, NAME FIRE 2, etc. (up to the number of perimeters for the event). Second, when it was determined that the perimeter was the result of the joining of two or three fire management events, the size of the MTBS event was allocated to the fire management events in proportion to the fire management event sizes, where the MTBS name was changed to NAME – FIRE 1a, NAME FIRE 1b, and in the case of three joined fires, FIRE 1c. And third, when it was determined that two individual MTBS events had merged, the name for the merged events was a combination of the two names separated by a slash (/).
- MTBS_Fire_ID: For some events, it was determined that MTBS produced multiple fire perimeter maps for different portions of a single fire event. For these events, a single event was included in the iWED, where the names and MTBS_FIRE_IDs were joined (separated by a “/”) and the sizes were added.
- MTBS_Fire_Type: iWED contains seven fire types for MTBS events: “Prescribed-PR”, “Prescribed-Un”, “Prescribed-WF”, “Wildfire”, “Unknown”, “Unknown-PR”, and “Unknown-WF”. All but the Wildfire and Unknown types were generated through visual interpretation of MTBS fire perimeter images (see Kasischke and French, 2025, in preparation).
Details on the collection or compiling of parameters contained in fire event-level data datasets and reports used in this study and their uncertainties can be found in Short (2014, 2015). Details on the generation of the fire perimeter data and fire event information from the MTBS program are presented in Eidenshink et al. (2006), Picotte et al. (2020) and on the MTBS website (Table 2). Additional information was derived through visual interpretation of MTBS fire perimeters or data discovered by searching the world wide web (see Kasischke and French, 2025, in preparation). MTBS imagery of the perimeters of fire events was visually interpreted to identify individual fires within the event or events that had merged or joined. Information on relative fire size was obtained from different geospatial datasets using the Wildland Emissions Inventory System (https://wfeis.mtri.org/calculator, last used on 2025-09-08).
Table 3. Primary sources for fire events. Codes in the Primary_Source variable.
| Code | Description |
|---|---|
| 1 | Data obtained from the U.S. Forest Service Fire Occurrence Dataset for 1992 to 2018 (Short, 2022). |
| 2 | Data obtained from the U.S. Forest Service Fire Occurrence Dataset for 1992 to 2015 (Short, 2017). |
| 3 | Data obtained from a database, dataset or annual report published by a state, regional, and national government organization. |
| 4 | Data obtained from daily or weekly fire situation reports published online by the National Interagency Fire Center or the Alaska Interagency Coordination Center. |
| 5 | Data obtained from the Monitoring Trends in Burn Severity program |
| 6 | Data obtained from government or media reports found through a search of the world wide web. |
| 1cx | Data obtained from the U.S. Forest Service Fire Occurrence Dataset for 1992 to 2018 (Short 2021) and named as a complex. |
| 3cx | Data obtained from a database. dataset or annual report published by a state, regional, and national governmental organization and named as a complex. |
| 4cx | Data obtained from daily or weekly fire situation reports published online by the National Interagency Fire Center or the Alaska Interagency Coordination Center and named a complex. |
| 5cx | Data obtained from the Monitoring Trends in Burn Severity program and named a complex. |
| 6cx | Data obtained from documents or media reports found through searches of the worldwide web and named a complex |
| 1d | It was determined that this event represented a duplicate of another event |
| 5d | It was determined that this event represented a duplicate of another event |
Table 4. Secondary sources for fire events. Codes in the Secondary_Source variable.
| Code | Description |
|---|---|
| 3 | Additional information obtained from a report or dataset published by state or regional fire management agency (Table 2). |
| 4 | Additional information obtained from an NICC or AICC IMSR. |
| 6 | Additional information obtained from government or media reports found through a search of the world wide web. |
| 3ad | An adjustment to the wildfire size was made based on additional information obtained from a report or dataset published by a state or regional fire management agency (Table 2). |
| 3mg | The merging of fire events was based on information obtained from a report or dataset published by a state or regional fire management agency (Table 2). |
| 3mu | The numbers of individual fires within a complex were obtained from a report or dataset published by a state or regional fire management agency (Table 2). |
| 3n | The name for an Unnamed wildfire from the FS18 dataset was obtained from a report or dataset published by a state or regional fire management agency (Table 2). |
| 3sp | The fact that a fire spanned the border of two states was obtained from a report or dataset published by a state or regional fire management agency (Table 2). |
| 4ad | An adjustment to the wildfire size was made based on additional information obtained from a NICC or AICC IMSR. |
| 4mg | The merging of fire events was based on additional information obtained from an NICC or AICC IMSR. |
| 4mu | The numbers of individual fires within a complex were obtained from an NICC or AICC IMSR. |
| 4n | The name for an Unnamed wildfire from the FS18 dataset was obtained from a NICC or AICC IMSR. |
| 5ad | Based on information derived from other sources (see Notes for specific events), an adjustment to the MTBS size was made. |
| 6ad | An adjustment to the wildfire size was made based on additional information from a government or media report found through a search of the world wide web. |
| 6mg | The merging of fire events was based on additional information obtained from a government or media report found through a search of the world wide web. |
| 6mu | Information on multiple fire events within a complex was obtained from a government or media report found through a search of the world wide web. |
| 6n | The name for an Unnamed wildfire from the FS18 dataset was obtained from a government or media report found through a search of the world wide web. |
| 7ad | Adjustments were made to a fire management size based on information obtained through visual interpretation of the fraction of total MTBS size in a fire which contained multiple perimeters |
| 7aj | Comparison of fire management positions was used to determine that multiple fires were within a single perimeter because one fire had an end date that was before the start date of another fire or fires, it was concluded these fires had not merged. Because a natural feature (such as a large river) served as the boundary between the two fires, these fires were described as being adjacent to one another. |
| 7j | While comparison of fire management positions was used to determine that multiple fires were within a single perimeter, because one fire had an end date that was before the start date of another fire or fires, it was concluded these fires had joined, not merged. |
| 7mg | Image interpretation of a fire perimeter image produced by the Monitoring Trends in Burn Severity program was used to determine that multiple fires had merged into a single fire. |
| 7mu | Visual interpretation of a fire perimeter image produced by the Monitoring Trends in Burn Severity program was used to determine that multiple fire perimeters existed for the MTBS event. |
| 7s | Visual interpretation of a fire perimeter image produced by the Monitoring Trends in Burn Severity program was used to determine that a fire event listed as a complex consisted of a single fire. |
| 7sp | Visual interpretation of an MTBS fire perimeter image revealed this wildfire spanned the border of two states or spanned the border between the United States and Canada or Mexico. |
| 7i/5 | Visual interpretation of the false-color Landsat image containing the MTBS perimeter was used to determine that the MTBS size was more likely than not incorrect. See Notes for specific details for this event. |
| 7wd | Visual interpretation showed this MTBS perimeter contained a narrow, elongated shape that was common to wind-driven fires found in grassland ecosystems. |
| 8i/5 | Fire perimeter data from the NIFS/GeoMAC dataset were used to identify areas that were incorrectly mapped using the MTBS algorithm. See Notes for specific details for this event. |
| 9i/5 | Burned area pixels developed from Landsat data were used to identify areas that were incorrectly mapped using the MTBS algorithm. See Notes for specific details for this event. |
| 10i/5 | Burned area pixels from MODIS data were used to identify areas that were incorrectly mapped using the MTBS algorithm. See Notes for specific details for this event. |
| 11i/5 | Visual interpretation of fine-resolution, color aerial photographs available from GoogleMap aided in identifying vegetation and geomorphological characteristics that contributed to areas being incorrectly mapped using the MTBS algorithm. See Notes for specific details for this event. |
Table 5. Abbreviations for agencies mentioned in iWED_V1_event_notes.csv and this document.
| Abbreviation | Description |
|---|---|
| AICC | Alaska Interagency Coordination Center |
| CalFire | California Department of Forestry and Fire Protection's Fire and Resource Assessment Program (FRAP); a source for wildfire perimeters |
| EGBCC | Eastern Great Basin Coordination Center |
| ICS 209 | Incident Status Summary Report filed to record information on individual wildfires |
| IMSR | Incident Management Situation Report |
| iWED | integrated Wildfire Event Dataset |
| MTBS | Monitoring Trends in Burn Severity |
| NICC | National Interagency Coordination Center |
| NIFS/GeoMAC | U.S. Geological Survey Geospatial Multi-Agency Coordination website that was operated from 2000 to 2020; a source for wildfire perimeters |
| NWCC | Northwest Interagency Coordination Center |
| OpenStreetMap | A web-based, open source map used to display and compare wildfire positions (https://www.openstreetmap.org/#map=10/38.7423/-104.3069 last accessed on 3 March 2025). |
| RMCC | Rocky Mountain Coordination Center |
| SWCC | Southeast Area Coordination Center |
| WFEIS | Wildland Fire Emissions Inventory System (https://wfeis.mtri.org/calculator), last accessed on 3 March 2025 |
| WGBCC | Western Great Basin Coordination Center |
| WFIGS | Wildfire perimeters obtained from Wildland Fire Interagency Geospatial Services |
Table 6. Abbreviations for U.S. states.
| Abbreviation | State | Abbreviation | State | Abbreviation | State |
|---|---|---|---|---|---|
| AL | Alabama | LA | Louisiana | OH | Ohio |
| AK | Alaska | ME | Maine | OK | Oklahoma |
| AZ | Arizona | MD | Maryland | OR | Oregon |
| AR | Arkansas | MA | Massachusetts | PA | Pennsylvania |
| CA | California | MI | Michigan | RI | Rhode Island |
| CO | Colorado | MN | Minnesota | SC | South Carolina |
| CT | Connecticut | MS | Mississippi | SD | South Dakota |
| DE | Delaware | MO | Missouri | TN | Tennessee |
| DC | District of Columbia | MT | Montana | TX | Texas |
| FL | Florida | NE | Nebraska | UT | Utah |
| GA | Georgia | NV | Nevada | VT | Vermont |
| ID | Idaho | NH | New Hampshire | VA | Virginia |
| IL | Illinois | NJ | New Jersey | WA | Washington |
| IN | Indiana | NM | New Mexico | WV | West Virginia |
| IA | Iowa | NY | New York | WI | Wisconsin |
| KS | Kansas | NC | North Carolina | WY | Wyoming |
| KY | Kentucky | ND | North Dakota |
Data Access
These data are available through the Oak Ridge National Laboratory (ORNL) Distributed Active Archive Center (DAAC).
An integrated Wildfire Event Dataset (iWED), Version 1, Continental U.S., 1992-2021
Contact for Data Center Access Information:
- E-mail: uso@daac.ornl.gov
- Telephone: +1 (865) 241-3952
References
Calkin, D.E., K.M. Gebert, J.G. Jones, and R.P. Neilson. 2005. Forest Service large fire area burned and suppression expenditure trends, 1970–2002. Journal of Forestry 103:179-183. https://doi.org/10.1093/jof/103.4.179
Eidenshink, J., B. Schwind, K. Brewer, Z.-L. Zhu, B. Quayle, and S. Howard. 2007. A project for Monitoring Trends in Burn Severity. Fire Ecology 3:3-21. https://doi.org/10.4996/fireecology.0301003
Kasischke, E.S. and N.H. French. 2025. An integrated wildfire event database for improved fire science research for the continental United States, 1992-2021. Earth System Science Data (in preparation)
Kasischke, E.S., D. Williams, and D. Barry. 2002. Analysis of the patterns of large fires in the boreal forest region of Alaska. International Journal of Wildland Fire 11:131-144. https://doi.org/10.1071/WF02023
Kolden, C.A., J.A. Lutz, C.H. Key, J.T. Kane, and J.W. van Wagtendonk. 2012. Mapped versus actual burned area within wildfire perimeters: Characterizing the unburned. Forest Ecology and Management 286:38-47. https://doi.org/10.1016/J.FORECO.2012.08.020
Picotte, J.J., K. Bhattarai, D. Howard, J. Lecker, J. Epting, B. Quayle, N. Benson, and K. Nelson. 2020. Changes to the Monitoring Trends in Burn Severity program mapping production procedures and data products. Fire Ecology 16:16. https://doi.org/10.1186/s42408-020-00076-y
Short, K.C. 2022. Spatial wildfire occurrence data for the United States, 1992-2020 [FPA_FOD_20221014] (6th Edition). USDA Forest Service. https://doi.org/10.2737/RDS-2013-0009.6
Short, K.C.2021. Spatial wildfire occurrence data for the United States, 1992-2018 [FPA_FOD_20210617] (5th Edition). USDA Forest Service. https://doi.org/10.2737/RDS-2013-0009.5
Short, K.C. 2017. Spatial wildfire occurrence data for the United States, 1992-2015 [FPA_FOD_20170508] (4th Edition). USDA Forest Service. https://doi.org/10.2737/RDS-2013-0009.4
Short, K.C. 2015. Sources and implications of bias and uncertainty in a century of US wildfire activity data. International Journal of Wildland Fire 24:883-891. https://doi.org/10.1071/WF14190
Short, K.C. 2014. A spatial database of wildfires in the United States, 1992-2011. Earth System Science Data 6:1-27. https://doi.org/10.5194/ESSD-6-1-2014
Welty, J., and M. Jeffries. 2021. Combined wildland fire datasets for the United States and certain territories, 1800s-Present. U.S. Geological Survey. https://doi.org/10.5066/P9ZXGFY3
Westerling, A.L., A. Gershunov, D.R. Cayan, and T.P. Barnett. 2002. Long lead statistical forecasts of area burned in western U.S. wildfires by ecosystem province. International Journal of Wildland Fire 11:257-266. https://doi.org/10.1071/WF02009