Documentation Revision Date: 2026-10-06
Dataset Version: 1
Summary
This dataset holds four cloud-optimized GeoTIFFs and one file in comma-separated values (CSV) format.
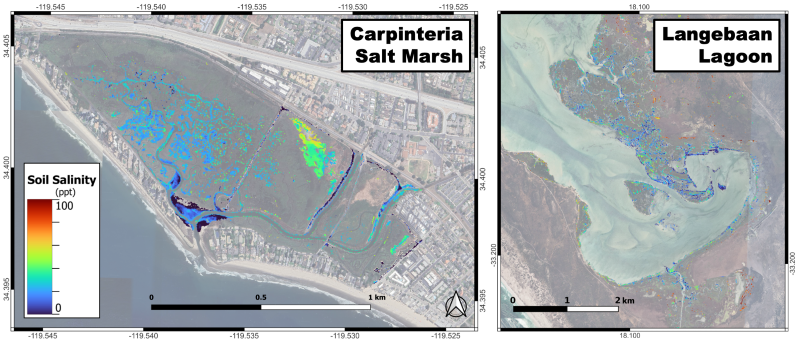
Figure 1. Soil salinity (parts per thousand) derived from AVIRIS-3 across the Carpinteria Salt Marsh Reserve, California, USA, and AVIRIS-NG across the Langebaan Lagoon, Western Cape, South Africa.
Citation
Jensen, D.J., K. Adams, A. Soloy, C.J. Davis, S. Belhadj-Aissa, L. Naidoo, P. Thakali, E. Adam, A. Barrenblit, and A. Campbell. 2026. Coastal Wetland Soil Salinity and Hydroperiod, California, USA, and Western Cape, ZA. ORNL DAAC, Oak Ridge, Tennessee, USA. https://doi.org/10.3334/ORNLDAAC/2529
Table of Contents
- Dataset Overview
- Data Characteristics
- Application and Derivation
- Quality Assessment
- Data Acquisition, Materials, and Methods
- Data Access
- References
Dataset Overview
This dataset holds measurements of surface soil salinity and reflectance for Carpinteria Salt Marsh Reserve (CSMR), California, USA and imaging spectroscopy-derived surface soil salinity raster products for CSMR and Langebaan Lagoon, Western Cape, South Africa. This dataset supports development and evaluation of an imaging spectroscopy approach for mapping surface soil salinity in coastal wetlands and examining its relationship with wetland hydroperiod at these locations. The dataset includes: (1) in situ visible-shortwave infrared soil reflectance measurements paired with soil samples processed to estimate dry-basis surface soil salinity at CSMR in April 2024; (2) imaging spectroscopy-derived surface soil salinity raster products generated from AVIRIS-3 observations acquired over CSMR in April 2024 and AVIRIS-NG observations acquired over Langebaan Lagoon in October 2023; and (3) hydroperiod raster products for both wetlands derived from 2018 Sentinel-1 synthetic aperture radar time series data. The CSMR field reflectance and salinity measurements were used to develop a Partial Least Squares Regression model relating the first derivative of soil reflectance to dry-basis surface soil salinity. The model was applied to airborne imaging spectroscopy data at both sites, with final salinity products restricted to non-submerged pixels with Multiple Endmember Spectral Mixture Analysis (MESMA)-derived soil fractional cover of at least 50 percent. Hydroperiod represents the percentage of Sentinel-1 observations in which each pixel was classified as inundated. The soil salinity products have spatial resolutions of 2.1 m at CSMR and 6.3 m at Langebaan Lagoon, while the Sentinel-1 hydroperiod products have a 10-m pixel size. These products enable analysis of surface soil salinity distributions, transferability of the salinity retrieval approach, and hydroperiod-salinity relationships across two contrasting coastal wetland systems.
Project: Biodiversity Survey of the Cape (BioSCape)
The Biodiversity Survey of the Cape (BioSCape) is a research project that uses remote sensing and field data to understand the distribution, function, and importance of biodiversity on land and in the water around the Greater Cape Floristic Region (GCFR). Located in southwestern South Africa along the Atlantic coast, the GFCR is one of the world’s 36 biodiversity hotspots. BioSCape is a collaboration between the US and South Africa. The team conducted an integrated field and airborne campaign in the hyperdiverse region in 2023. Researchers collected laser altimetry LiDAR data and UV/visible to short wavelength infrared (UVSWIR) and thermal imaging spectroscopy data over terrestrial and aquatic targets using four airborne instruments: AVIRIS-NG, PRISM, LVIS, and HyTES. This airborne dataset is unique in its size and scope and unprecedented in its instrument combination and level of detail. These airborne data are accompanied by a range of biodiversity-related field observations.
Related Publication:
Jensen, D., K. Adams, A. Soloy, S. Belhadj-Aissa, M. Simard, C. Davis, L. Naidoo, P. Thakali, E. Adam, L. van Niekerk, H. van Deventer, J. Adams, R.M. Fisher, A. Barrenblitt, and A. Campbell. 2026. Towards a generalized imaging spectroscopy framework for surface soil salinity retrieval in coastal wetlands: Evaluating transferability and hydroperiod–salinity relationships. Journal of Geophysical Research: Biogeosciences (in press).
Related Datasets:
Brodrick, P.G., E.L. Hestir, J.A. Slingsby, A.M. Wilson, A.W. Cardoso, A.M. Chlus, R. Eckert, J.W. Chapman, M. Eastwood, E. Greenberg, J. Montgomery, B.A. Wilder, N. Bohn, D.R. Thompson, and R.O. Green. 2026. BioSCape: AVIRIS-NG L2 Orthocorrected Surface Reflectance. ORNL DAAC, Oak Ridge, Tennessee, USA. https://doi.org/10.3334/ORNLDAAC/2419
Brodrick, P.G., A.M. Chlus, U.N. Bohn, E. Greenberg, J. Montgomery, J.W. Chapman, M. Eastwood, S.R. Lundeen, R. Eckert, W. Olson-Duvall, D.R. Thompson, and R.O. Green. 2025. AVIRIS-3 L2A Orthocorrected Surface Reflectance, Facility Instrument Collection. ORNL DAAC, Oak Ridge, Tennessee, USA. https://doi.org/10.3334/ORNLDAAC/2357
Campbell, A., E. Adam, L. Fatoyinbo, D.J. Jensen, M. Simard, K. Smith, P. Thakali, A. Barrenblit, L. Naidoo, H. van Deventer, and A. Stovall. 2025. BioSCape Estuary Wetland Vegetation Plot Data and Habitat Extents, South Africa. ORNL DAAC, Oak Ridge, Tennessee, USA. https://doi.org/10.3334/ORNLDAAC/2441
Acknowledgements:
This work was supported by NASA's Biodiversity Survey of the Cape (BioSCape) Project (grant NNH21ZDA001N-BIODIV) and carried out at the Jet Propulsion Laboratory, California Institute of Technology (NASA contract 80NM0018D0004).
Data Characteristics
Spatial Coverage: Carpinteria Salt Marsh Reserve, California, USA; Langebaan Lagoon, Western Cape, South Africa
Spatial Resolution: 2.1 to 6.3 m for soil salinity, 10 m for hydroperiod
Temporal Coverage: hydroperiod, 2018; soil salinity 2023-10-29 to 2024-04-16
Temporal Resolution: One time sample for soil salinity; annual composite for hydroperiod
Site Boundaries: Latitude and longitude are given in decimal degrees.
| Site | Westernmost Longitude | Easternmost Longitude | Northernmost Latitude | Southernmost Latitude |
|---|---|---|---|---|
| Carpinteria, California, USA | -119.5544 | -119.5195 | 34.4132 | 34.3877 |
| Langebaan,Western Cape, South Africa |
17.9188 | 18.2033 | -33.2704 | -33.0357 |
Data File Information
This dataset holds four cloud-optimized GeoTIFFs and one file in comma-separated values (CSV) format.
Table 1. GeoTIFF files with descriptions
| File name | Units | Description |
|---|---|---|
| carpinteria_av3_20240416_soilsalinity.tif | ppt | Surface soil salinity derived from AVIRIS-3 surface reflectance acquired over the Carpinteria Salt Marsh Reserve on April 16, 2024. Values are in parts per thousand (ppt; g salt/kg dry soil) at 2.1 m spatial resolution. Retrievals are limited to non-submerged pixels with MESMA-derived soil fractional cover ≥0.50 |
| carpinteria_sentinel1_2018_hydroperiod.tif | percent | Hydroperiod derived from the 2018 Sentinel-1 SAR time series for the Carpinteria Salt Marsh Reserve. Pixel values represent the percentage of retained Sentinel-1 observations in which each 10 m pixel was classified as inundated, ranging from 0-100% |
| langebaan_avng_20231029_soilsalinity.tif | ppt | Surface soil salinity derived from AVIRIS-NG surface reflectance acquired over Langebaan Lagoon on October 29, 2023. Values are in parts per thousand (ppt; g salt/kg dry soil) at 6.3 m spatial resolution. Retrievals are limited to non-submerged pixels with MESMA-derived soil fractional cover ≥0.50 |
| langebaan_sentinel1_2018_hydroperiod.tif | percent | Hydroperiod derived from the 2018 Sentinel-1 SAR time series for Langebaan Lagoon. Pixel values represent the percentage of retained Sentinel-1 observations in which each 10 m pixel was classified as inundated, ranging from 0-100%. |
GeoTIFF characteristics
- Projected coordinate system: UTM using WGS-84 datum: zone 11N (EPSG 32611) for Carpinteria, zone 33S (EPSG 32733) for Langebaan.
- Spatial resolution: Carpinteria soil salinity, 2.1 m; Langebaan soil salinity, 6.3 m; hydroperiod 10 m.
- Number of bands: one
- Nodata value: -9999
The CSV file, carpinteria_soilsalinity_reflectance_fieldsurvey_20240416.csv, holds field and laboratory measurements from 32 sampling locations collected at the Carpinteria Salt Marsh Reserve on April 16, 2024 (Table 2).
Table 2. Variables in carpinteria_soilsalinity_reflectance_fieldsurvey_20240416.csv.
| Variable | Units | Description |
|---|---|---|
| Latitude | degrees north | Latitude of sampling location in decimal degrees |
| Longitude | degrees east | Longitude of sampling location in decimal degrees |
| Wet_soil_relative_salinity | 1 | Relative soil salinity in the upper 2 cm, calculated as salt mass divided by the original wet soil mass (g salt per g wet soil) |
| Dry_soil_relative_salinity | 1 | Relative soil salinity in the upper 2 cm, calculated as salt mass divided by the dried soil mass, correcting for soil water content (g salt per g dry soil) |
| 350 ... 2500 (2151 columns) |
1 | Surface reflectance for 2151 wavelengths (350 - 2500 nm). Column name is the wavelength in nm. |
Application and Derivation
Surface soil salinity and hydroperiod are important indicators of coastal wetland hydrology and ecosystem condition. Salinity reflects the combined influence of marine inundation, freshwater inputs, and evapoconcentration, while hydroperiod characterizes the frequency of inundation that helps regulate these processes. The datasets provided here can be used to examine landscape-scale salinity distributions, evaluate hydroperiod-salinity relationships, assess hydrologic controls on salinity patterns, and investigate potential impacts on vegetation communities and wetland vulnerability. Together, these spatial products support coastal wetland monitoring and enable analysis of hydro-ecological dynamics that are difficult to detect or quantify using point-based field measurements alone.
Quality Assessment
Uncertainty and data quality were assessed through model calibration and validation against available in situ salinity measurements. The Partial Least Squares Regression (PLSR) model, trained on the first derivatives of the in situ soil reflectance data convolved to AVIRIS-3's 7.4 nm spectral resolution, attained an R2 of 0.90 and a mean absolute error (MAE) of 0.005 g salt/g dry soil (5.00 ppt). The model was also re-trained to match AVIRIS-NG's 5 nm spectral resolution and attained an R2 of 0.92 and an MAE of 0.004 g salt/g dry soil (4.00 ppt). The final mapped salinity products were restricted to non-submerged pixels with MESMA-derived soil fractional cover of at least 0.50 to reduce uncertainty associated with water, vegetation, and mixed-pixel effects.
The mapped salinity values were compared with available in situ measurements at both study sites (Figure 2). For the Carpinteria Salt Marsh Reserve (CSMR), predicted map values were extracted within a 3-pixel radius, averaging valid values within a 7 × 7 pixel window around each field location, for comparison with the 32 laboratory-measured soil salinity values. Validation of the AVIRIS-3 salinity product using the 7 × 7 neighborhood yielded R2 = 0.53 and MAE = 9.22 ppt (n = 32; Figure 2a). A single-pixel comparison was also conducted where the coincident pixel met the ≥0.50 soil-cover criterion, yielding R2 = 0.79 and MAE = 6.21 ppt (n = 28; Figure 2a).
At Langebaan Lagoon, the same retrieval framework was applied independently to AVIRIS-NG data to test the transferability of the salinity retrieval algorithm. Because these field sites occurred under varying vegetation cover, 12 sites contained valid salinity retrievals from pixels with soil fractional cover ≥0.50 within the 7 × 7 validation window. With all qualifying sites retained, the AVIRIS-NG validation yielded R2 = 0.19 and MAE = 18.64 ppt (n = 12; Figure 2b). One high-residual observation disproportionately influenced these summary error statistics, so a sensitivity analysis was also conducted using an objective residual-based outlier criterion. The observation exceeded Q3 + 1.5 × IQR of the absolute residual distribution, where Q3 is the third quartile (75th percentile) and IQR is the interquartile range. Excluding this observation improved performance to R2 = 0.67 and MAE = 14.11 ppt (n = 11; Figure 2b). Figure 2 reports the regression statistics both with and without this observation.
The Langebaan Lagoon results represent an independent application of a model calibrated using CSMR data and therefore provide a more stringent test of transferability than the CSMR validation. Retrieval performance may be affected by sample size and differences in substrate, soil moisture, vegetation cover, and other surface conditions that influence observed reflectance. The soil fractional-cover threshold was used to limit application to the domain in which the soil surface provides a sufficiently strong contribution to the measured spectrum. These salinity products therefore do not provide estimates for submerged pixels or pixels with soil fractional cover below 0.50.
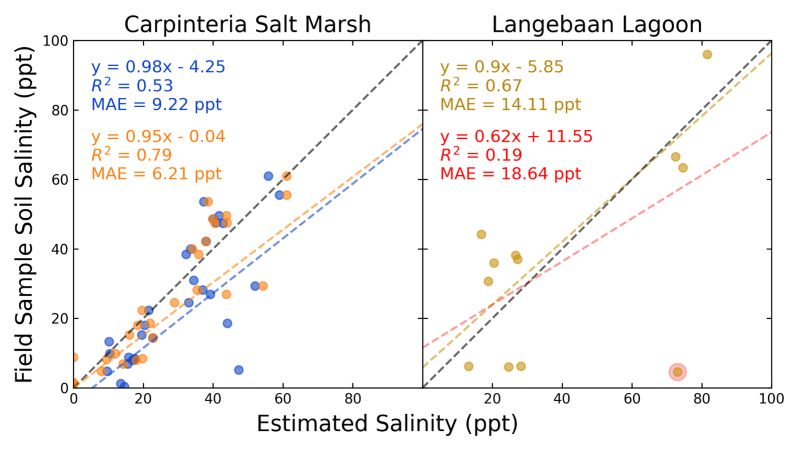
Figure 2. Validation of surface soil salinity estimates (ppt; maps shown in Figure 1) from the first-derivative reflectance partial least squares regression model using (a) AVIRIS-3 at the Carpinteria Salt Marsh Reserve (CSMR) and (b) AVIRIS-NG at the Langebaan Lagoon. The dashed gray line denotes the 1:1 relationship, and dashed colored lines indicate least-squares fits. For the CSMR, the validation uses both the 7 × 7 pixel neighborhood average (blue) and the single coincident pixel values (orange). For Langebaan, an additional sensitivity analysis is reported excluding a single high-residual observation identified by an objective residual-based outlier criterion (Q3 + 1.5 × IQR of the absolute residuals; circled in red); regression statistics are shown both with (red) and without (yellow) this point (Jensen et al., 2026).
Data Acquisition, Materials, and Methods
Carpinteria Salt Marsh Reserve field and laboratory data
Field data were collected at the Carpinteria Salt Marsh Reserve (CSMR), California, on April 16, 2024, coincident with the AVIRIS-3 overflight. Soil surface reflectance was measured using an Analytical Spectral Devices (ASD) FieldSpec-3 spectrometer at 1 nm sampling from 350–2500 nm. At the same locations, 32 soil samples were collected from the upper 2 cm of exposed soil. Sampling locations were selected to capture a range of exposed-soil conditions, including variability in mineral composition and surface organic material or biofilm, so that the calibration dataset represented realistic within-marsh surface heterogeneity (Jensen et al., 2026).
Following collection, approximately 50 g of each soil sample was weighed and dried under a heating lamp for one week. Samples were reweighed to determine water content, and the dried soil was mixed with 100 mL of distilled water and agitated for 10 minutes to extract water-soluble salts. Electrical conductivity (EC) of the resulting solution was measured using an EC-3185 EC/TDS/conductivity meter. Measurements were standardized to 25°C, and EC was converted to total salt concentration using a conversion factor of 0.6 g L-1 per mS cm-1. Total salt mass was then normalized by dry soil mass to calculate dry-basis surface soil salinity, expressed as g salt per g dry soil and converted to parts per thousand (ppt). The extraction procedure was adapted from established soil salinity methods and was designed to provide consistent quantification of total water-soluble salt mass for spectroscopy-based model calibration (U.S. Salinity Laboratory Staff, 1954; Rhoades et al., 1999). The paired field reflectance measurements and laboratory-derived soil properties are included in carpinteria_soilsalinity_reflectance_fieldsurvey_20240416.csv.
PLSR model development and AVIRIS-3 application at CSMR
The laboratory-derived CSMR salinity measurements were paired with their corresponding field reflectance spectra to develop the surface soil salinity retrieval model. The 1 nm field spectra were spectrally resampled to match AVIRIS-3 and AVIRIS-NG using Gaussian spectral response functions defined by the full width at half maximum (FWHM) of each sensor band. Separate versions of the model were generated at the 7.4 nm spectral sampling of AVIRIS-3 and approximately 5 nm sampling of AVIRIS-NG. Bands strongly affected by atmospheric water vapor were excluded, and Partial Least Squares Regression (PLSR) models were trained using the first derivative of reflectance as the predictor variables and dry-basis soil salinity as the response variable. The optimal number of PLS components was selected using Predicted Residual Sum of Squares (PRESS) calculated with leave-one-out cross validation, with the final implementation using six components (Jensen et al., 2026).
AVIRIS-3 was flown over CSMR on April 16, 2024, at approximately 3,810 m altitude, producing imagery at approximately 2.1 m ground sampling distance. AVIRIS-3 measures radiance from approximately 390–2500 nm with 7.4 nm spectral sampling. The Level 1B at-sensor radiance data were processed to Level 2A orthocorrected surface reflectance using an optimal-estimation atmospheric correction approach (Thompson et al., 2018; Thompson et al., 2019; Brodrick et al., 2025). To identify pixels suitable for soil salinity retrieval, Multiple Endmember Spectral Mixture Analysis (MESMA) was applied to the AVIRIS surface reflectance data to estimate fractional cover of green vegetation (GV), non-photosynthetic vegetation (NPV), and soil. The MESMA implementation used the EMIT spectral library supplemented with the 32 CSMR field soil spectra to better represent coastal marsh soils (Brodrick, 2024; Ochoa et al., 2025). Submerged pixels were excluded using a Normalized Difference Water Index (NDWI) mask, and the valid retrieval domain for the final soil salinity products was restricted to pixels with MESMA-derived soil fractional cover ≥0.50. Reflectance spectra within this domain were smoothed using a Savitzky-Golay filter, converted to first derivatives, and input to the appropriate sensor-specific PLSR model. Model predictions were converted from units of g salt per g dry soil to ppt (Figure 1).
BioSCape data application at Langebaan Lagoon with AVIRIS-NG
Langebaan Lagoon, Western Cape, South Africa, was used as an independent test site for assessing transferability of the CSMR-trained salinity retrieval. AVIRIS-NG data were collected over Langebaan Lagoon on October 29, 2023, as part of NASA's BioSCape field campaign. AVIRIS-NG was flown aboard the NASA Gulfstream III at approximately 6,400 m altitude, producing imagery at approximately 6.3 m spatial resolution and measuring radiance from approximately 380–2510 nm at 5 nm spectral sampling. The at-sensor radiance data were atmospherically corrected using the same optimal-estimation framework to produce surface reflectance (Brodrick et al., 2026).
Independent field measurements at Langebaan Lagoon were collected during the BioSCape campaign in November 2023 (Campbell et al., 2025). The validation data used for this study included porewater salinity measurements collected with salinometers or refractometers and direct soil EC measurements, with EC values corrected for temperature and converted to ppt. Porewater salinity and probe-based soil EC are related but not fully equivalent measures which were treated as complementary indicators of local soil salinity for validation. These Langebaan field observations are not included in this dataset and are available through the related BioSCape Estuary Wetland Vegetation Plot Data and Habitat Extents, South Africa dataset (Campbell et al., 2025).
The AVIRIS-NG surface reflectance data were processed using the same general MESMA, soil-fraction masking, spectral smoothing, derivative calculation, and PLSR workflow used for CSMR. The model was not calibrated using Langebaan data; rather, the CSMR-trained model was spectrally matched to AVIRIS-NG and applied directly to Langebaan to provide an independent test of transferability.
Sentinel-1 Hydroperiod
Hydroperiod was mapped independently for both wetlands using a 2018 Sentinel-1 Synthetic Aperture Radar (SAR) time series, following the approach described by Belhadj-Aissa et al. (2026). Sentinel-1 vertical-transmit, vertical-receive (VV) backscatter was used because of its sensitivity to the low backscatter associated with open water and to scattering differences between flooded and non-flooded wetland surfaces. The 2018 period was selected when Sentinel-1A and Sentinel-1B were both operational, providing a nominal 6-day repeat interval. Level 1 Ground Range Detected imagery was obtained as Radiometrically Terrain Corrected (RTC) products through the Alaska Satellite Facility HyP3 processing system. RTC processing included terrain flattening using the Copernicus GLO-30 elevation model and Lee filtering to reduce speckle, with final imagery provided at 10 m pixel spacing.
For each site, the SAR analysis was limited to the wetland domain. Individual Sentinel-1 scenes were screened using their backscatter histograms, and only scenes exhibiting a clear bimodal distribution corresponding to separable water and non-water surfaces were retained. For each retained image, the local minimum between the two histogram modes was used as a scene-specific threshold to classify pixels as inundated or non-inundated. The resulting binary inundation maps were aggregated through time, and hydroperiod was calculated for each pixel as the percentage of retained Sentinel-1 observations in which that pixel was classified as inundated. The resulting 10-m hydroperiod products provide a spatial measure of inundation frequency that can be used with the soil salinity products to examine hydrologic controls on coastal wetland salinity (Figure 3).
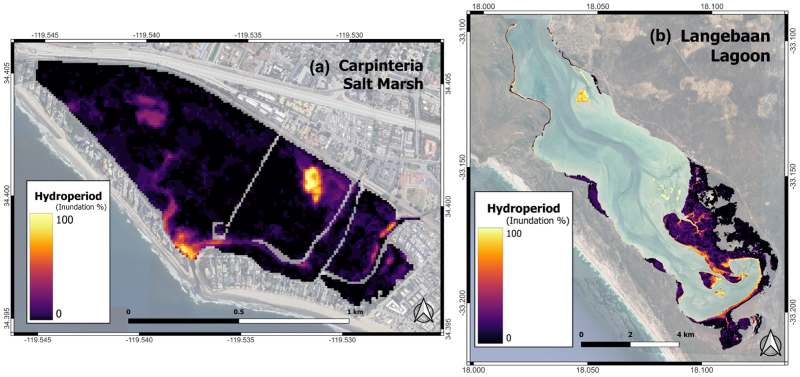
Figure 3. Hydroperiod (percent time spent inundated) derived from Sentinel-1 across (a) the Carpinteria Salt Marsh Reserve and (b) the Langebaan Lagoon (Jensen et al., 2026).
Data Access
These data are available through the Oak Ridge National Laboratory (ORNL) Distributed Active Archive Center (DAAC).
Coastal Wetland Soil Salinity and Hydroperiod, California, USA, and Western Cape, ZA
Contact for Data Center Access Information:
- E-mail: uso@daac.ornl.gov
- Telephone: +1 (865) 241-3952
References
Belhadj-Aissa, S., M. Simard, A.P. Ruiz, J. Palacios, and S. Fagherazzi. 2026. Mapping salt marsh hydroperiod using Synthetic Aperture Radar time series. Remote Sensing Applications: Society and Environment 41:101850. https://doi.org/10.1016/j.rsase.2025.101850
Brodrick, P.G., A.M. Chlus, U.N. Bohn, E. Greenberg, J. Montgomery, J.W. Chapman, M. Eastwood, S.R. Lundeen, R. Eckert, W. Olson-Duvall, D.R. Thompson, and R.O. Green. 2025. AVIRIS-3 L2A Orthocorrected Surface Reflectance, Facility Instrument Collection. ORNL Distributed Active Archive Center. https://doi.org/10.3334/ORNLDAAC/2357
Brodrick, P.G., E.L. Hestir, J.A. Slingsby, A.M. Wilson, A.W. Cardoso, A.M. Chlus, R. Eckert, J.W. Chapman, M. Eastwood, E. Greenberg, J. Montgomery, B.A. Wilder, N. Bohn, D.R. Thompson, and R.O. Green. 2026. BioSCape: AVIRIS-NG L2 Orthocorrected Surface Reflectance. ORNL Distributed Active Archive Center. https://doi.org/10.3334/ORNLDAAC/2419
Brodrick, P.G., W. Olson-Duvall, F. Ochoa, and V.A. Jhalani. 2024 emit-sds/SpectralUnmixing: v0.2.4 (Version v0.2.4). https://doi.org/10.5281/ZENODO.14362833
Campbell, A., E. Adam, L. Fatoyinbo, D.J. Jensen, M. Simard, K. Smith, P. Thakali, A. Barrenblit, L. Naidoo, H. van Deventer, and A. Stovall. 2025. BioSCape Estuary Wetland Vegetation Plot Data and Habitat Extents, South Africa. ORNL Distributed Active Archive Center. https://doi.org/10.3334/ORNLDAAC/2441
Jensen, D., K. Adams, A. Soloy, S. Belhadj-Aissa, M. Simard, C. Davis, L. Naidoo, P. Thakali, E. Adam, L. van Niekerk, H. van Deventer, J. Adams, R.M. Fisher, A. Barrenblitt, and A. Campbell. 2026. Towards a generalized imaging spectroscopy framework for surface soil salinity retrieval in coastal wetlands: Evaluating transferability and hydroperiod–salinity relationships. Journal of Geophysical Research: Biogeosciences (in press).
Ochoa, F., P.G. Brodrick, G.S. Okin, E. Ben-Dor, T. Meyer, D.R. Thompson, and R.O. Green. 2025. Soil and vegetation cover estimation for global imaging spectroscopy using spectral mixture analysis. Remote Sensing of Environment 324:114746. https://doi.org/10.1016/j.rse.2025.114746
Rhoades, J.D.,F. Chanduvi, and S. Lesch. 1999. Soil Salinity Assessment: Methods and Interpretation of Electrical Conductivity Measurements. FAO Irrigation and Drainage Paper No. 57. Food and Agriculture Organization of the United Nations, Rome, Italy. https://www.fao.org/4/x2002e/x2002e.pdf
Thompson, D.R., V. Natraj, R.O. Green, M.C. Helmlinger, B.-C. Gao, and M.L. Eastwood. 2018. Optimal estimation for imaging spectrometer atmospheric correction. Remote Sensing of Environment 216:355–373. https://doi.org/10.1016/j.rse.2018.07.003
Thompson, D.R., K. Cawse-Nicholson, Z. Erickson, C.G. Fichot, C. Frankenberg, B.-C. Gao, M.M. Gierach, R.O. Green, D. Jensen, V. Natraj, and A. Thompson. 2019. A unified approach to estimate land and water reflectances with uncertainties for coastal imaging spectroscopy. Remote Sensing of Environment 231:111198. https://doi.org/10.1016/j.rse.2019.05.017
U.S. Salinity Laboratory Staff. 1954. Diagnosis and Improvement of Saline and Alkali Soils. USDA Agriculture Handbook No. 60. U.S. Government Printing Office, Washington, DC. https://www.ars.usda.gov/ARSUserFiles/20360500/hb60_pdf/hb60complete.pdf