Documentation Revision Date: 2026-02-13
Dataset Version: 1
Summary
This dataset includes five files in comma separated values (CSV) format.
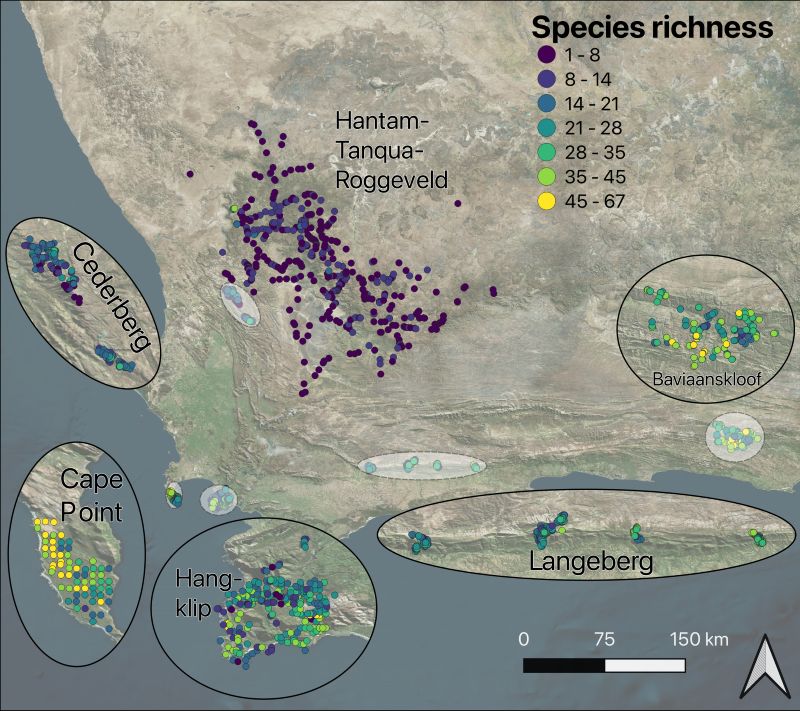
Figure 1. Map of releve plots from the most recent surveys of each subregion. Each releve plot is represented by a single point and is colored by its species richness. The Fynbos dominated subregions are shown with insets.
Citation
Frye, H., M.E Aiello-Lammens, D. Euston-Brown, C.S. Jones, H. Kilroy Mollmann, C. Merow, J.A. Slingsby, H. van der Merwe, R. Turner, A.M. Wilson, and J.A. Silander Jr. 2026. Foliar Trait and Spectroscopy Data, Greater Cape Floristic Region, South Africa. ORNL DAAC, Oak Ridge, Tennessee, USA. https://doi.org/10.3334/ORNLDAAC/2482
Table of Contents
- Dataset Overview
- Data Characteristics
- Application and Derivation
- Quality Assessment
- Data Acquisition, Materials, and Methods
- Data Access
- References
Dataset Overview
This dataset holds foliar trait measurements, species-level life history traits, visible-near infrared (VNIR) spectroscopy, and vegetation survey data for plant communities within the Greater Cape Floristic Region (GCFR) of South Africa. Foliar traits measurements were made between 2010 and 2014. Relevé surveys data include plots from 1966 to 2014. Trait collection efforts extended over 5.8% of the GCFR's total area, where measurements were made for 1,327 species from 99 families. The trait dataset comprises 135,325 leaf and twig structural measurements, 7,513 canopy measurements and 11,950 elemental/isotopic measurements. The spectroscopy dataset contains 3,205 VNIR spectral measurements (450-949 nm) of 1,181 species from 96 families. These data contribute to research initiatives such as the Biodiversity Survey of the Cape (BioSCape) project and help understand this ecosystem from a trait-based perspective.
Project: Biodiversity Survey of the Cape (BioSCape)
The Biodiversity Survey of the Cape (BioSCape) is an international collaboration between South Africa and the United States to study biodiversity in South Africa’s Greater Cape Floristic Region (GCFR). The GCFR was selected due to two exceptional hotspots of both terrestrial and aquatic biodiversity. The GCFR is listed among the World’s 200 Significant Ecoregions. The BioSCape is an integrated field and airborne campaign occurring in 2023. The campaign will collect UV/visible to short wavelength infrared (UVSWIR) and thermal imaging spectroscopy and laser altimetry LiDAR data over terrestrial and aquatic targets using four airborne instruments: Airborne Visible InfraRed Imaging Spectrometer - Next Generation (AVIRIS-NG), Portable Remote Imaging SpectroMeter (PRISM), Land, Vegetation, and Ice Sensor (LVIS), and Hyperspectral Thermal Emission Spectrometer (HyTES). The anticipated airborne data set is unique in its size and scope and unprecedented in its instrument combination and level of detail. These airborne data will be accompanied by a range of biodiversity-related field observations. BioSCape’s primary objective is to understand the structure, function, and composition of the region’s ecosystems, and to learn about how and why they are changing in time and space.
Related Publications:
Aiello-Lammens, M.E., J.A. Slingsby, C. Merow, H.K. Mollmann, D. Euston-Brown, C.S. Jones, and J.A. Silander. 2016. Processes of community assembly in an environmentally heterogeneous, high biodiversity region. Ecography 40:561–576. https://doi.org/10.1111/ecog.01945
Frye, H.A., M.E. Aiello-Lammens, D. Euston-Brown, C.S. Jones, H. Kilroy Mollmann, C. Merow, J.A. Slingsby, H. van der Merwe, A.M. Wilson, and J.A. Silander. 2021. Plant spectral diversity as a surrogate for species, functional and phylogenetic diversity across a hyper-diverse biogeographic region. Global Ecology and Biogeography 30:1403–1417. https://doi.org/10.1111/geb.13306
Frye, H.A., M.E. Aiello-Lammens, D. Euston-Brown, C.S. Jones, H. Kilroy Mollmann, C. Merow, J.A. Slingsby, H. van der Merwe, R. Turner, A.M. Wilson, and J.A. Silander Jr. 2026. Foliar trait and spectroscopy data from the megadiverse Greater Cape Floristic Region. In preparation.
Schliep, E.M., A.E. Gelfand, R.M. Mitchell, M.E. Aiello-Lammens, and J.A. Silander. 2017. Assessing the joint behaviour of species traits as filtered by environment. Methods in Ecology and Evolution 9:716–727. https://doi.org/10.1111/2041-210X.12901
Slingsby, J.A., C. Merow, M. Aiello-Lammens, N. Allsopp, S. Hall, H. Kilroy Mollmann, R. Turner, A.M. Wilson, and J.A. Silander. 2017. Intensifying postfire weather and biological invasion drive species loss in a Mediterranean-type biodiversity hotspot. Proceedings of the National Academy of Sciences 114:4697–4702. https://doi.org/10.1073/pnas.1619014114
van Leeuwen, M., H.A. Frye, and A.M. Wilson. 2021. Understanding limits of species identification using simulated imaging spectroscopy. Remote Sensing of Environment 259:112405. https://doi.org/10.1016/j.rse.2021.112405
White, P.A., H. Frye, M.F. Christensen, A.E. Gelfand, and J.A. Silander. 2022. Spatial functional data modeling of plant reflectances. The Annals of Applied Statistics 16. https://doi.org/10.1214/21-AOAS1576
White, P.A., M.F. Christensen, H. Frye, A.E. Gelfand, and J.A. Silander. 2023. Joint multivariate and functional modeling for plant traits and reflectances. Environmental and Ecological Statistics 30:501–528. https://doi.org/10.1007/s10651-023-00574-7
White, P.A., H.A. Frye, J.A. Slingsby, J.A. Silander, and A.E. Gelfand. 2023. Generative spatial generalized dissimilarity mixed modelling (spGDMM): An enhanced approach to modelling beta diversity. Methods in Ecology and Evolution 15:214–226. https://doi.org/10.1111/2041-210X.14259
White, P.A., A.E. Gelfand, H. Frye, and J.A. Silander. 2024. Good modelling practice in ecology, the hierarchical Bayesian perspective. Ecological Modelling 496:110847. https://doi.org/10.1016/j.ecolmodel.2024.110847
Acknowledgements:
The BioSCape Project is a multi-agency, NASA-led research project that integrates airborne imaging spectroscopy (AVIRIS NG) and lidar (LVIS) with a suite of surface measures of biodiversity. Financial support was provided by the National Science Foundation (NSF) grant DEB-1046328, with a Research Experiences for Undergraduates Broadening Participation (REU-BP) Supplement to J. A. Silander and C. S. Jones, and the South African Environmental Observation Network (SAEON). Compilation of data was supported by NASA grant 80NSSC22K1383 and National Research Foundation of South Africa (grant 142438). H.A. Frye was supported by funding from NSF grant DBI-2021898 and NASA grant 80NSSC22K0905. Additional funding was provided by the Critical Ecosystem Partnership Fund (CEPF) via the SKEP (Succulent Karoo Ecosystem Plan/Program) initiative.
Kirstenbosch Gardens, South African National Parks, Cape Nature, and Northern Cape Department of Environment and Nature Conservation gave permission to collect leaf spectra and traits and herbarium specimens. Logistical support was provided by Eastern Cape Parks and Tourism Agency and the Gamtoos Irrigation Board.
Data Characteristics
Spatial Coverage: Greater Cape Floristic Region (GCFR), Northern Cape and Western Cape provinces, South Africa
Spatial Resolution: plots with average spacing of 1.1 km
Temporal Coverage: 2010-07-21 to 2014-08-26 for foliar traits; relevé data include plots from 1966 to 2014
Temporal Resolution: One time measurements
Site Boundaries: Latitude and longitude are given in decimal degrees.
| Site | Westernmost Longitude | Easternmost Longitude | Northernmost Latitude | Southernmost Latitude |
|---|---|---|---|---|
| Greater Cape Floristic Region, South Africa | 18.3744 | 24.4833 | -30.3925 | -34.4000 |
Data File Information
This dataset includes five files in comma separated values (CSV) format (Table 1).
Table 1. Files in this dataset.
| File name | Content | Rows | Columns |
|---|---|---|---|
| BioSCape_foliar_canopy_leaf_chemistry.csv | 11,948 foliar chemistry and canopy measurements of 1,327 species | 2509 | 24 |
| BioSCape_foliar_leaf_struct_water_traits.csv | 135,325 foliar and twig structural measurements for 1,327 species | 9547 | 30 |
| BioSCape_foliar_species_traits.csv | 49 variables related to life history, growth form, and phenology for 2,213 species | 2225 | 54 |
| BioSCape_foliar_vnir_spectra.csv | 3,205 spectral measurements for 1,182 species | 3205 | 512 |
| BioSCape_foliar_releve.csv | 1,826 relevé surveys across a time span from 1966–2014 | 40744 | 12 |
Table 2. Variables in BioSCape_foliar_canopy_leaf_chemistry.csv.
| Variable | Units | Description |
|---|---|---|
| unique_ID | - | A unique value that identifies the collection of a particular species, at a particular location, on a particular day. The value is based on Date_Sample_Subregion |
| scientific_name_original | - | Latin binomial assigned to plant based on most recent taxonomy at the time of data collection (e.g., "Abutilon sonneratianum", "Zygophyllum procumbens") |
| genus_MG | - | Genus of plant based on the Manning and Goldblatt (2012) taxonomy |
| family_MG | - | Family of plant based on the Manning and Goldblatt (2012) taxonomy |
| scientific_name_WFO | - | Latin binomial of plant based on the World Flora Online v.2023.12 static backbone |
| scientific_name_authorship | - | Taxonomic authorship assigned to the World Flora Online taxa |
| family_WFO | - | Plant family based on the World Flora Online v.2023.12 static backbone |
| latitude | degrees north | Latitude in decimal degrees |
| longitude | degrees east | Longitude in decimal degrees |
| subregion | - | Subregion category |
| date | YYYY-MM-DD | Date of trait collection |
| collector | - | Collector initial code, retained for provenance of unique identifier |
| sample | - | Sample number of individual collected |
| height_cm | cm | Vegetation height; range: 0 - 2500 |
| canopy_axis_1_cm | cm | Length of canopy axis 1; range: 1 - 1400 |
| canopy_axis_2_cm | cm | Length of canopy axis 2; range: 0.5 - 1300 |
| canopy_cover_cm2 | cm2 | Canopy cover calculation; range: 0.392 - 1429424.657 |
| branch_order | - | Ordinal measure (0 to 4) of branch order, a measure of complexity of branching, with higher values representing greater complexity; range: 0 - 4 |
| pubescence | - | Categorical value indicating presence of pubescence (hair) on leaves ("l"), stems ("s"), both leaves and stems ("b"), or neither ("n"). "NA" indicates lack of measurement, not necessarily lack of pubescence |
| percent_N | percent | Percent of nitrogen content of leaf or primary photosynthetic surface; range: 0.200 - 4.837 |
| percent_C | percent | Percent of carbon content of leaf or primary photosynthetic surface; range: 14.388 - 415.884 |
| C_to_N_ratio | 1 | Carbon to nitrogen ratio; range: 6.654 - 234.890 |
| d_15N_14N | 0.001 | Ratio of δ15N to δ14N isotopes in per mille (‰); range: -10.2654 - 17.38412 |
| d_13C_12C | 0.001 | Ratio of δ13C to δ12C isotopes in per mille (‰); range: -33.2334 - -11.5092 |
Table 3. Variables in BioSCape_foliar_leaf_struct_water_traits.csv.
| Variable | Units | Description |
|---|---|---|
| unique_ID | - | A unique value that identifies the collection of a particular species, at a particular location, on a particular day. The value is based on Date_Sample_Subregion |
| scientific_name_original | - | Latin binomial assigned to plant based on most recent taxonomy at the time of data collection |
| genus_MG | - | Genus of plant based on the Manning and Goldblatt (2012) taxonomy |
| family_MG | - | Family of plant based on the Manning and Goldblatt (2012) taxonomy |
| scientific_name_WFO | - | Latin binomial of plant based on the World Flora Online v.2023.12 static backbone |
| scientific_name_authorship | - | Taxonomic authorship assigned to the World Flora Online taxa |
| family_WFO | - | Plant family based on the World Flora Online v.2023.12 static backbone |
| latitude | degrees north | Latitude in decimal degrees |
| longitude | degrees east | Longitude in decimal degrees |
| subregion | - | Subregion category |
| replicate | - | Replicate number of leaf within individual sample plant |
| date | YYYY-MM-DD | Date of trait collection |
| collector | - | Collector initial code, retained for provenance of unique identifier |
| sample | - | Sample number of individual collected |
| num_leaves | 1 | Number of leaves used to make area and weight measurements |
| leaf_area_cm2 | cm2 | Leaf area as measured with LI-COR Leaf Area Meter (LAM); range: 0.165 - 573.53 |
| leaf_length_cm | cm | Leaf length of a single leaf, as measured either by LI-COR LAM or with calipers; range: 0.011 - 210.5 |
| avg_leaf_width_cm | cm | Average leaf width, as measured with LI-COR LAM or with calipers; range: 0.002 - 23.5 |
| max_leaf_width_cm | cm | Max leaf width, as measured with LI-COR LAM or with calipers; range: 0.002 - 47 |
| leaf_thickness_mm | mm | Thickness of leaf lamina, as measured with micrometer or calipers; range: 0.002 - 34.5 |
| leaf_fresh_wgt_g | g | Leaf fresh (wet) weight; range: 0.007 - 976.036 |
| leaf_dry_wgt_g | g | Leaf dry weight, measured after drying in oven; range: 0.004 - 70.451 |
| twig_fresh_g | g | Stem fresh (wet) weight; range: 0.002 - 103.784 |
| twig_dry_g | g | Stem dry weight, measured after drying in oven; range: 0.007 - 10.673 |
| lma | g cm-2 | Leaf mass area - calculated as leaf dry mass / leaf area; range: 0.00134 - 0.46541 |
| lwc | g g-1 | Leaf water content - calculated as (leaf wet mass - leaf dry mass) / leaf dry mass; range: 0.1123 - 84.9167 |
| succulence | g cm-2 | Succulence - calculated as (leaf wet mass - leaf dry mass) / leaf area; range: 0 - 2.8299 |
| ldmc | g g-1 | Leaf dry matter content - calculated as leaf dry mass / leaf wet mass; range: 0.0116 - 1 |
| lwr | cm cm-1 | Leaf length-to-width ratio - calculated as leaf length / average leaf width; range: 0.211 - 3086.667 |
| twig_fwc | g g-1 | Stem fresh water content - calculated as stem dry mass / stem wet mass; range: 0.0263 - 99 |
Table 4. Variables in BioSCape_foliar_species_traits.csv.
| Variable | Units | Description |
|---|---|---|
| scientific_name_original | - | Latin binomial assigned to plant based on most recent taxonomy at the time of data collection |
| scientific_name_MG | - | Latin binomial of plant based on the Manning and Goldblatt (2012) taxonomy |
| family_MG | - | Family of plant based on the Manning and Goldblatt (2012) taxonomy |
| scientific_name_WFO | - | Latin binomial of plant based on the World Flora Online v.2023.12 static backbone |
| scientific_name_authorship | - | Taxonomic authorship assigned to the World Flora Online taxa |
| family_WFO | - | Plant family based on the World Flora Online v.2023.12 static backbone |
| perennial | - | Binary trait extracted from regional floras and expert opinion (1 = perennial, 0 = not perennial) |
| annual | - | Binary trait extracted from regional floras and expert opinion (1 = annual, 0 = not annual) |
| lifecycle_POSA | - | Categorical variable of "perennial" or "annual" extracted from Plants of South Africa (POSA) data base |
| monoecious | - | Binary trait extracted from regional floras and expert opinion (1 = monoecious, 0 = not monoecious) |
| dioecious | - | Binary trait extracted from regional floras and expert opinion(1 = dioecious, 0 = not dioecious) |
| evergreen | - | Binary trait extracted from regional floras and expert opinion (1 = evergreen, 0 = not evergreen) |
| deciduous | - | Binary trait extracted from regional floras and expert opinion (1 = deciduous, 0 = not deciduous) |
| seasonally_apparent | - | Binary trait extracted from regional floras and expert opinion (1 = species is seasonally apparent, 0 = species is apparent year round) |
| seasonally_identifiable | - | Binary trait extracted from regional floras and expert opinion (1 = species is identifiable only during part of the season, 0 = identifiable year round) |
| flower_postfire | - | Binary trait extracted from regional floras and expert opinion (1 = species does flower after a fire, 0 = species does not flower after fire) |
| resprout_postfire | - | Binary trait extracted from regional floras and expert opinion (1 = species does resprout after a fire, 0 = species does not resprout after fire) |
| serotinous | - | Binary trait extracted from regional floras and expert opinion (1 = species is serotinous, 0 = species is not serotinous) |
| flower_begin | month | Abbreviation of month flowering begins |
| flower_end | month | Abbreviation of month flowering ends |
| flower_begin_alt | month | Ambiguous flowering begin month; there are several possible reasons a record may have included alternative end flowering, e.g., regional differences in range |
| flower_end_alt | month | Ambiguous flowering end month; there are several possible reasons a record may have included alternative end flowering, e.g., regional differences in range |
| max_height_cm | cm | Maximum height based on regional floras and expert opinion |
| herb | - | Binary trait extracted from regional floras and expert opinion (1 = species is herb, 0 = species is not an herb) |
| geophyte | - | Binary trait extracted from regional floras and expert opinion (1 = species is a geophyte, 0 = species is not a geophyte) |
| graminoid | - | Binary trait extracted from regional floras and expert opinion (1 = species is a graminoid, 0 = species is not a graminoid) |
| low_shrub | - | Binary trait extracted from regional floras and expert opinion (1 = species is a shrub less than 1 m tall, 0 = species is not a shrub less than 1 m tall) |
| mid_shrub | - | Binary trait extracted from regional floras and expert opinion (1 = species is a shrub between than 1 to 2 m tall, 0 = species is not a shrub between 1 to 2 m tall) |
| tall_shrub | - | Binary trait extracted from regional floras and expert opinion (1 = species is a shrub taller than 2 m, 0 = species is not a shrub taller than 2 m) |
| tree | - | Binary trait extracted from regional floras and expert opinion (1 = species is a tree, 0 = species is not a tree) |
| scrambler | - | Binary trait extracted from regional floras and expert opinion (1 = species is a scrambler, 0 = species is not a scrambler) |
| liana | - | Binary trait extracted from regional floras and expert opinion (1 = species is a liana, 0 = species is not a liana) |
| hemiparasite | - | Binary trait extracted from regional floras and expert opinion (1 = species is a hemiparasite, 0 = species is not a hemiparasite) |
| parasite | - | Binary trait extracted from regional floras and expert opinion (1= species is a parasite, 0 = species is not a parasite) |
| missing_growthform_class | - | Binary trait extracted from regional floras and expert opinion (1 = species has an unknown growth form class, 0 = species has a known growth form class) |
| succulent | - | Binary trait extracted from regional floras and expert opinion (1= species is a succulent, 0 = species is not a succulent) |
| leaf_succulent | - | Binary trait extracted from regional floras and expert opinion (1 = species is a leaf succulent, 0 = species is not a leaf succulent) |
| stem_succulent | - | Binary trait extracted from regional floras and expert opinion (1 = species is a stem succulent, 0 = species is not a stem succulent) |
| other_succulent | - | Binary trait extracted from regional floras and expert opinion (1 = species is a succulent based on a different part of the plant, 0 = species is not a succulent based on a different part of the plant) |
| leaf_type | - | Categorical trait: "leaf", "frond", "cladode"," microphyll", "none", and "phyllode" |
| lvs_linear | - | Binary trait extracted from regional floras and expert opinion (1 = species has linear leaves, 0 = species does not have linear leaves) |
| lvs_intermediate | - | Binary trait extracted from regional floras and expert opinion (1 = species has intermediate leaves, 0 = species does not have intermediate leaves) |
| lvs_oval | - | Binary trait extracted from regional floras and expert opinion (1 = species has oval leaves, 0 = species does not have oval leaves) |
| lvs_compound | - | Binary trait extracted from regional floras and expert opinion (1 = species has compound leaves, 0 = species does not have compound leaves) |
| lvs_lobed | - | Binary trait extracted from regional floras and expert opinion (1 = species has lobed leaves, 0 = species does not have lobed leaves) |
| lvs_dissected | - | Binary trait extracted from regional floras and expert opinion (1 = species has dissected leaves, 0 = species does not have dissected leaves) |
| leaf_length | cm | Leaf length as measured from herbarium specimens; range 0.10 - 160.84 |
| virtually_no_leaves | - | Binary trait extracted from regional floras and expert opinion (1 = species has virtually no leaves, 0 = species has leaves) |
| stems_photosynthetic | - | Binary trait extracted from regional floras and expert opinion (1 = species has photosynthetic stems, 0 = species does has photosynthetic stems) |
| functional_leaf | - | Categorical trait describing main photosynthetic surface of the plant: "leaf", "mixed," "culm_stem", "none" |
| plant_longevity | - | Ordinal variable: 0 = <2 yrs; 1 = 2-8 yrs; 2 = 8-25 yrs; 3 = >25 yrs |
| flammability | - | Ordinal variable: low ("l"), med ("m"), high ("h") |
| pollination | - | Categorical variable from regional floras and expert opinion describing the main pollinator of the plant" "I"=insect; "b"=bird; "m"=mammal;"w"=wind; "u"=unknown |
| dispersal | - | Categorical variable from regional floras and expert opinion describing the main dispersal mechanism of the plant: "I"=insect; "m"=mammal; "w"=wind; "p"=passive; "u"=unknown |
Table 5. Variables in BioSCape_foliar_vnir_spectra.csv.
| Column.Name | Units | Description |
|---|---|---|
| unique_ID | - | A unique value that identifies the collection of a particular species, at a particular location, on a particular day. The value is based on Date_Sample_Subregion format (e.g., "619_1_HK") |
| scientific_name_original | - | Latin binomial assigned to plant based on most recent taxonomy at the time of data collection |
| family_MG | - | Family of plant based on the Manning and Goldblatt (2012) taxonomy (e.g., "Acanthaceae", "Zygophyllaceae") |
| scientific_name_WFO | - | Latin binomial of plant based on the World Flora Online v.2023.12 static backbone |
| scientific_name_authorship | - | Taxonomic authorship assigned to the World Flora Online taxa |
| family_WFO | - | Plant family based on the World Flora Online v.2023.12 static backbone |
| latitude | degrees north | Latitude of sample location in decimal degrees |
| longitude | degrees east | Longitude of sample location in decimal degrees |
| subregion | - | Subregion category (e.g., "baviaanskloof", "langeberg") |
| date | YYYY-MM-DD | Date of spectral collection |
| sample | - | Sample number of individual collected |
| X450 - X949 | 1 | Reflectance value in percent by wavelength. There are 500 fields labeled by X<aaa>, where <aaa> = wavelength in nm. Values range: 0.00 to 90.24. |
| year | YYYY | Year of sample collection |
Table 6. Variables in BioSCape_foliar_releve.csv.
| Variable | Units | Description |
|---|---|---|
| scientific_name_original | - | Latin binomial assigned to plant based on most recent taxonomy at the time of data collection |
| scientific_name_WFO | - | Latin binomial of plant based on the World Flora Online v.2023.12 static backbone |
| scientific_name_authorship | - | Taxonomic authorship assigned to the World Flora Online taxa |
| family_WFO | - | Plant family based on the World Flora Online v.2023.12 static backbone |
| plot | - | Plot ID of relevé |
| year | YYYY | The year in which the the survey was either conducted or published; range: 1966 - 2014 |
| subregion | - | Subregion in which relevé was conducted |
| latitude | degrees north | Latitude of plot location in decimal degrees |
| longitude | degrees east | Longitude of plot location in decimal degrees |
| percent_cover | percent | Percent cover of observed plant; range: 0 - 87.5 |
| abundance_class | - | Abundance class if abundance was originally recorded on a Braun-Blanquet scale: 0 = single or sporadic individual (<1 % cover), 1 = insignificant cover (1-5% cover), 2 = low cover(5-25%), 3 = 25-50% cover, 4 = 50-75% cover, and 5 = 75-100% cover; values range: 0 - 5 |
| plot_percent_cover | percent | This is the sum total plot percent cover; range: 0.1 - 585 |
| relative_percent_cover | percent | The percent cover relative to the total plot percent cover; range: 0 - 1 |
Application and Derivation
The Greater Cape Floristic Region of South Africa is a megadiverse region threatened by climate change, human-driven habitat loss, and invasive species. Trait-based ecology offers a mechanistic approach to understand and predict how ecosystems function and respond to disturbance. Leveraging the interactions between plants and incoming solar radiation, remote sensing offers a way to measure foliar traits at landscape scales. In addition to greatly expanding the availability of foliar trait data for this region, these data are contributing to ongoing major research initiatives such as the Biodiversity Survey of the Cape (BioSCape) project and should prove invaluable for future efforts to understand this ecosystem from a trait-based perspective.
Quality Assessment
Data cleaning and taxon harmonization are documented in workflows available in Frye (2026). Unrealistic foliar chemistry and structural values (e.g., percent element values over 100% or negative water content values) were removed from the dataset or if possible corrected based on the original data entries. Where applicable, replicate measurements are fully retained to allow users to conduct appropriate assessments of uncertainty. Sampling constraints due to labor and availability of plant material may limit the amount of measurement replication.
Data Acquisition, Materials, and Methods
Between 2010–2014 plant trait data was collected across the Greater Cape Floristic Region in South Africa. Sampling efforts were concentrated in six subregions where either historical or concurrently measured relevé surveys were conducted. While some of these floristic inventories took place several decades before the time of foliar collection and the local vegetation has likely changed due to the influence of fire and other drivers, these surveys still represent the dominant vegetation of the broader subregion. Foliar collections took place in the vicinity (typically < 1 km) of the relevé plots, but not within the original plots to avoid disturbance of vegetation for long-term monitoring efforts.
For foliar traits measurements, sunlit leaves from the top of the canopy were collected from a median of five individuals per species across all subregions. Leaves were placed in plastic bags with moist paper towels and kept in a cooler box or refrigerator and processed within 24 hours. Twenty-four morphological and chemical traits on leaves, stems, and canopies were measured following the standardized protocols of Cornelissen et al. (2003) and Pérez-Harguindeguy et al. (2013). These traits include: leaf area (cm2), leaf length (cm), average leaf width (cm), maximum leaf width (cm), leaf thickness (mm), leaf fresh weight (g), leaf dry weight (g), twig fresh weight (g), twig dry weight (g), leaf mass per area (g cm-2), leaf water content (g g-1), leaf succulence (g cm-2), leaf dry matter content (g g-1), leaf length-to-width ratio (cm cm-1), twig water content (g g-1), canopy height (cm), canopy area (cm2), branch order, pubescence, nitrogen (N; %), carbon, (C; %), carbon-nitrogen ratio (C:N), nitrogen isotope ratio (δ15N; ‰), and carbon isotope ratio (δ13C; ‰). In cases where the stem organ acted as the primary photosynthetic organ (e.g., culms of Restionaceae species or stems of succulent species) the stem material was treated as a leaf.
In addition to the foliar traits, leaf reflectance spectroscopy measurements were made on sunlit leaves using a USB-4000 spectrometer (Ocean Optics Inc., Largo, Florida, USA) with a leaf clip attachment. Note that mats of stems were measured in cases where the stem represented the main photosynthetic surface (e.g., some graminoids and stem succulents) covering the full field of view of the clip attachment. The spectrometer range was 450–950 nm, and the data were interpolated to 1-nm band centers.
As ancillary data, a compilation of species-level life history and phenological traits was created based on Germishuizen and Meyer (2003), Manning and Goldblatt (2012), and input from expert botanists. Both the historical and concurrent relevé survey data were collated for all subregions.
For further details regarding the description, measurement, and biogeographical context of these data, please see Frye et al. (2026).
To make ecologically informative inferences using abundance weighted data, researchers should combine the percent cover values from the relevé data and foliar trait data . Broad trait and environmental trends should always be interpreted with a degree of caution given the strong role that fire plays in the Fynbos ecosystems. Additionally, researchers are encouraged to link these data to regional abiotic data used in the Ecological Monitoring and Management Application project (EMMA; https://github.com/AdamWilsonLab/emma_envdata; Slingsby et al., 2020) and to explore NASA's related BioSCape Project. For the most recent regionally accepted taxonomic designations, check taxonomic names in these data with the Botanical Database of Southern Africa (South African National Biodiversity Institute, 2016).
Data Access
These data are available through the Oak Ridge National Laboratory (ORNL) Distributed Active Archive Center (DAAC).
Foliar Trait and Spectroscopy Data, Greater Cape Floristic Region, South Africa
Contact for Data Center Access Information:
- E-mail: uso@daac.ornl.gov
- Telephone: +1 (865) 241-3952
References
Aiello-Lammens, M.E., J.A. Slingsby, C. Merow, H.K. Mollmann, D. Euston-Brown, C.S. Jones, and J.A. Silander. 2016. Processes of community assembly in an environmentally heterogeneous, high biodiversity region. Ecography 40:561–576. https://doi.org/10.1111/ecog.01945
Cornelissen, J.H. C., S. Lavorel, E. Garnier, S. Diaz, N. Buchmann, D.E. Gurvich, P.B. Reich, H. ter Steege, H.D. Morgan, M.G. A. van der Heijden, J.G. Pausas, and H. Poorter. 2003. A handbook of protocols for standardised and easy measurement of plant functional traits worldwide. Australian Journal of Botany 51:335-380. https://doi.org/10.1071/BT02124
Frye, H. 2026a. Plant traits of the Greater Cape Floristic Region. Github repository. https://github.com/henryf6/GCFR_Traits
Frye, H. 2026b. henryf6/GCFR_Traits: Primary code release. Zenodo.https://doi.org/10.5281/ZENODO.18189263
Frye, H.A., M.E. Aiello-Lammens, D. Euston-Brown, C.S. Jones, H. Kilroy Mollmann, C. Merow, J.A. Slingsby, H. van der Merwe, R. Turner, A.M. Wilson, and J.A. Silander Jr. 2026. Foliar trait and spectroscopy data from the megadiverse Greater Cape Floristic Region. In preparation.
Frye, H.A., M.E. Aiello-Lammens, D. Euston-Brown, C.S. Jones, H. Kilroy Mollmann, C. Merow, J.A. Slingsby, H. van der Merwe, A.M. Wilson, and J.A. Silander. 2021. Plant spectral diversity as a surrogate for species, functional and phylogenetic diversity across a hyper-diverse biogeographic region. Global Ecology and Biogeography 30:1403-1417. https://doi.org/10.1111/geb.13306
Germishuizen, G. and N.L. Meyer (eds). 2003. Plants of southern Africa: An annotated checklist. South African National Biodiversity Institute (SANBI Publishing); Pretoria, South Africa.
Manning, J. and P. Goldblatt. 2012. Plants of the Greater Cape Floristic Region: Vol. 1: The Core Cape flora. South African National Biodiversity Institute (SANBI Publishing); Pretoria, South Africa. ISBN: 978-1-919976-74-7
Perez-Harguindeguy, N., S. Diaz, E. Garnier, S. Lavorel, H. Poorter, P. Jaureguiberry, M.S. Bret-Harte, W.K. Cornwell, J.M. Craine, D.E. Gurvich, C. Urcelay, E.J. Veneklaas, P.B. Reich, L. Poorter, I.J. Wright, P. Ray, L. Enrico, J.G. Pausas, A.C. de Vos, N. Buchmann, G. Funes, F. Quetier, J.G. Hodgson, K. Thompson, H.D. Morgan, H. ter Steege, M.G. A. van der Heijden, L. Sack, B. Blonder, P. Poschlod, M.V. Vaieretti, G. Conti, A.C. Staver, S. Aquino, and J.H. C. Cornelissen. 2013. New handbook for standardised measurement of plant functional traits worldwide. Australian Journal of Botany 61:167-234. https://doi.org/10.1071/BT12225
Schliep, E.M., A.E. Gelfand, R.M. Mitchell, M.E. Aiello-Lammens, and J.A. Silander. 2017. Assessing the joint behaviour of species traits as filtered by environment. Methods in Ecology and Evolution 9:716-727. https://doi.org/10.1111/2041-210X.12901
Slingsby, J.A., C. Merow, M. Aiello-Lammens, N. Allsopp, S. Hall, H. Kilroy Mollmann, R. Turner, A.M. Wilson, and J.A. Silander. 2017. Intensifying postfire weather and biological invasion drive species loss in a Mediterranean-type biodiversity hotspot. Proceedings of the National Academy of Sciences 114:4697-4702. https://doi.org/10.1073/pnas.1619014114
South African National Biodiversity Institute. 2016. Botanical Database of Southern Africa (BODATSA). https://posa.sanbi.org/
van Leeuwen, M., H.A. Frye, and A.M. Wilson. 2021. Understanding limits of species identification using simulated imaging spectroscopy. Remote Sensing of Environment 259:112405. https://doi.org/10.1016/j.rse.2021.112405
White, P.A., H. Frye, M.F. Christensen, A.E. Gelfand, and J.A. Silander. 2022. Spatial functional data modeling of plant reflectances. The Annals of Applied Statistics 16. https://doi.org/10.1214/21-AOAS1576
White, P.A., M.F. Christensen, H. Frye, A.E. Gelfand, and J.A. Silander. 2023. Joint multivariate and functional modeling for plant traits and reflectances. Environmental and Ecological Statistics 30:501–528. https://doi.org/10.1007/s10651-023-00574-7
White, P.A., H.A. Frye, J.A. Slingsby, J.A. Silander, and A.E. Gelfand. 2023. Generative spatial generalized dissimilarity mixed modelling (spGDMM): An enhanced approach to modelling beta diversity. Methods in Ecology and Evolution 15:214–226. https://doi.org/10.1111/2041-210X.14259
White, P.A., A.E. Gelfand, H. Frye, and J.A. Silander. 2024. Good modelling practice in ecology, the hierarchical Bayesian perspective. Ecological Modelling 496:110847. https://doi.org/10.1016/j.ecolmodel.2024.110847