Documentation Revision Date: 2026-07-29
Dataset Version: 1
Summary
This dataset holds four files: one geopackage and three cloud optimized GeoTIFFs.
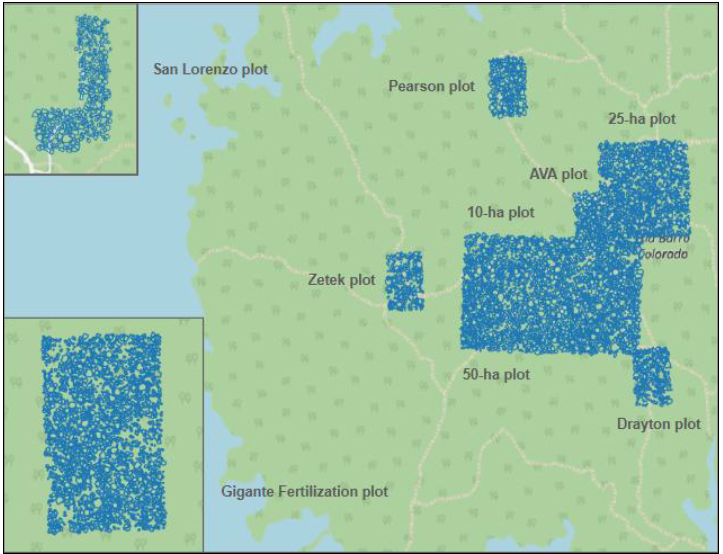
Figure 1. Spatial distribution of nine plots: seven located on Barro Colorado Island, one on the Gigante Peninsula within the Barro Colorado Nature Monument, and one in the San Lorenzo Protected Area. All of them are in central Panama within the provinces of Panama, Colon, and La Chorrera.
Citation
Arauz, F., M. Hernandez, P. Villarreal, P. Ramos, A. Agrazal, M. Perez, M. Demarsan, and H.C. Muller-Landau. 2026. AVUELO: Tropical Forest Crown Maps with Tree Species Names, Panama. ORNL DAAC, Oak Ridge, Tennessee, USA. https://doi.org/10.3334/ORNLDAAC/2517
Table of Contents
- Dataset Overview
- Data Characteristics
- Application and Derivation
- Quality Assessment
- Data Acquisition, Materials, and Methods
- Data Access
- References
Dataset Overview
This dataset contains a map of tree crown polygons and orthomosaics for field sites in Panama across 153.36 ha of mapped plots in old-growth and old secondary forest in the Barro Colorado Nature Monument (BCNM), and San Lorenzo Protected Area (SLPA) (Figure 1). Tree crown polygons were developed from orthophoto mosaics of UAV imagery acquired in July 2024, November 2024, and January 2025 (Figure 2). Field work verified crown polygons, linked them to tagged trees, and evaluated liana cover, crown intactness, crown illumination, and phenological state (leafing, flowering, fruiting). The dataset covers nine large, partially overlapping forest plots: the Gigante Fertilization plot (38.4-ha), three plots on Barro Colorado Island (BCI; 50-ha, 25-ha, and 10-ha), four additional 6-ha BCI plots (AVA, Pearson, Drayton, and Zetek), and the San Lorenzo 5.96-ha plot (formerly known as the Sherman plot). The 7,688 crown segments represent 204 unique species; 3,838 crowns were liana-free. The resulting dataset is an important resource for linking remote sensing data with tropical tree taxonomic identification.
Project: Airborne Validation Unified Experiment Land to Ocean (AVUELO)
The Airborne Validation Unified Experiment Land to Ocean (AVUELO) project aims to advance the validation of spaceborne hyperspectral data for tropical ecosystems. In a February 2025 campaign, AVUELO combined airborne hyperspectral imagery for terrestrial and marine sites in Panama and Costa Rica with contemporaneous field measurements and collections. In May of 2026, UAVSAR flights complimented AVIRIS-3 flights in targeted areas and included concurrent field collections. AVUELO deployed the Airborne Visible-Infrared Imaging Spectrometer 3 (AVIRIS-3) and Uninhabited Aerial Vehicle Synthetic Aperture Radar (UAVSAR) to collect imagery. In Panama, terrestrial collection encompassed many intensively studied sites and wide variation in soil type, geology, rainfall, and vegetation type. In Costa Rica, AVUELO focused on the Rincon de la Vieja and Turrialba volcanoes, well-studied forests sites, and Pacific coastal areas in collaboration with the Plankton, Aerosol, Cloud, ocean Ecosystem (PACE) team. UAVSAR flights complement NISAR data comparisons. Associated terrestrial field work focused on acquiring data on the traits and taxonomic identity of canopy plant species captured in the airborne imagery.
Related Dataset:
Araúz, F., M. Hernández, P. Villarreal, P. Ramos, A. Agrazal, M. Pérez, M. Demarsan, and H.C. Muller-Landau. 2026. Field-verified canopy tree crown segmentation for 7,536 crowns across 147.4 hectares of tropical forest plots in the Barro Colorado Nature Monument, Panama in 2025. Smithsonian Research Data Repository. https://doi.org/10.60635/C34S6C.
Acknowledgements:
Portions of this work were carried out with the Jet Propulsion Laboratory under contract with the National Aeronautics and Space Administration in relation to the Airborne Validation Unified Experiment Land to Ocean (AVUELO) campaign. Additional financial support was provided by Simons Foundation (grant 429440). The Plant Functional Ecology Laboratory (LEFO) at Université de Montréal and Mila developed the automatic crown segmentation workflow. UAV imagery was collected by the LEFO (Gigante plot) and the GIGANTE large tree mortality project.
Data Characteristics
Spatial Coverage: Barro Colorado Island, Barro Colorado Peninsula, and San Lorenzo Protected Area in Panama.
Spatial Resolution: 1.8 - 4.0 cm
Temporal Coverage: imagery: 2024-07-11 to 2025-01-07; field data: 2023-04-13 to 2026-02-21
Temporal Resolution: One-time estimates
Study Areas: Latitude and longitude are given in decimal degrees.
| Site | Northernmost Latitude | Southernmost Latitude | Westernmost Longitude | Easternmost Longitude |
|---|---|---|---|---|
| Barro Colorado Island | 9.16581 | 9.14801 | -79.85981 | -79.84262 |
| Gigante Peninsula | 9.10746 | 9.09839 | -79.85793 | -79.85008 |
| San Lorenzo | 9.28585 | 9.27985 | -79.97629 | -79.97221 |
This data holds four files: one GeoPackage and three cloud optimized GeoTIFFs (Table 1).
The GeoPackage, AVUELO_combined_crownmaps_2025.gpkg, is the principal data file. It holds the polygon outlines of tree crowns with areas ≥25 m2 for nine study areas in Panama; variables are described in Table 2. The GeoTIFFs hold orthophoto mosaics that were used in creating and validating the tree crown polygons.
The coordinate reference system for all four files is UTM zone 17N using the WGS 84 datum (EPSG: 32617).
Table 1. Data files and descriptions.
| Filename | Description |
|---|---|
| 20240716_bciclippled_trinity_rgb.tif | Orthomosaic GeoTIFF with RGB and alpha bands with 3.93 cm/pixel spatial resolution generated using photogrammetry from images collected by a Trinity Pro UAV on July 16, 2024 at Barro Colorado Island. |
| 20241125_giganteplot_m3e_rgb.tif | Orthomosaic GeoTIFF with RGB and alpha bands with 1.85 cm/pixel spatial resolution generated using photogrammetry from images collected by a DJI Mavic Enterprise M3E UAV on November 25, 2024 at the Gigante Peninsula. |
| 20250107_sherman_m3e_rgb.tif | Orthomosaic GeoTIFF with RGB and alpha bands with 1.89 cm/pixel spatial resolution generated using photogrammetry from images collected by a DJI Mavic Enterprise M3E UAV on January 07, 2025, at the Sherman plot located in the San Lorenzo Protected Area. |
| AVUELO_combined_crownmaps_2025.gpkg | GeoPackage containing 7,688 field-validated individual tree crown polygons with an area greater or equal to 25 square meters. |
Table 2. Variables in AVUELO_combined_crownmaps_2025.gpkg.
| Variable | Units | Description |
|---|---|---|
| Plot_tag | - | Unique identifier for each tree formed by concatenating the plot name ("Plot"), an underscore, and the tag ("Tag") (e.g., "ava_1001"). Created because the same value of tag can occur in more than one plot. |
| Plot | - | Name of the plot in which the tree is located: "p50", "p25", "p10", "ava", "drayton", "pearson", "zetek", "gigante", "sherman" |
| Tag | - | Integer value on an aluminum tag affixed to the tree. |
| Sp6 | - | Six-character species code that uniquely identifies the tree morphospecies. Links to Panama woody plant spused to identify trees to species in the main census file. |
| Sp4 | - | Four-character species code that uniquely identifies the tree morphospecies. Links to Panama woody plant spused to identify trees to species in the main census file. |
| SpeciesName | - | Scientific name of the tree species, in most cases the binomial consisting of its genus and specific epithet, and rarely also including subspecies. |
| Crown | 1 | Crown intactness is measured on a four-point scale: 4 (75-100% of the crown is intact, no or few branches lost), 3 (50-75% of the crown is intact), 2 (25-50% of the crown is intact), 1 (0-25% of the crown is intact, most of the crown is gone). The value -9999 represents missing data. Values: 1, 2, 3, 4, -9999 (nodata) |
| Illumination | 1 | Crown illumination is evaluated on a five-point scale based on vertical and lateral exposure to direct light, disregarding liana coverage: 5 (crown completely exposed, to vertical light and to lateral light within the 90 degree inverted cone encompassing the crown), 4 (full overhead light, >=90% of the vertical projection of the crown exposed to vertical light; later light blocked within some or all of the 90 degree inverted cone encompassing the crown), 3 (some overhead light, 10-90% of the vertical project of the crown exposed to vertical light), 2 (lateral light, <10% of the vertical project of the crown exposed to vertical light; crown lit laterally), and 1 (no direct light, crown not lit directly either vertically or laterally). The value -9999 represents missing data. |
| Liana | 1 | Crown cover by lianas or hemiepiphytes is recorded on a scale where 4 (76-100% liana coverage), 3 (51-75 % liana coverage), 2 (26-50% liana coverage), 1 (1-25% liana coverage), and 0 (0% liana coverage). The value -9999 represents missing data. |
| Mature_leaves | - | Proportion of crown that have mature leaves at the time the crown is observed. Values: None, Partial, Complete, NA |
| New_leaves | - | Proportion of crown that have new leaves at the time the crown is observed. The value NA represents missing data. Values: None, Partial, Complete, NA |
| Deciduous | - | Proportion of crown that is deciduous at the time the crown is observed. The value NA represents missing data. Values: None, Partial, Complete, NA |
| Flowers | - | Proportion of crown that has flowers at the time the crown is observed. The value NA represents missing data. Values: None, Partial, Complete, NA |
| Fruits | - | Proportion of crown that have fruits at the time the crown is observed. The value NA represents missing data. Values: None, Partial, Complete, NA |
| Area_m2 | m2 | The horizontally projected tree crown area visible from above in square meters. |
| Dbh_mm | mm | Trunk diameter in the 2023 (50-ha, Gigante, and Sherman plots) or 2025 (25-ha, 10-ha, AVA, Drayton, Pearson, and Zetek plots) census at 1.3 m height or above buttresses (diameter at breast height), in millimeters. |
| Hom_m | m | Height of measurement of the DBH in the 2023 (50-ha, Gigante, and Sherman plots) or 2025 (25-ha, 10-ha, AVA, Drayton, Pearson, and Zetek plots), in meters. |
| Avuelo_sample_id | - | Unique identifier used during the NASA AVUELO field campaign for sampled plants. The value -9999 represents missing data (i.e., the plant was not sampled for the AVUELO campaign). Values: 1001 to 5003. |
| Collector | - | Person responsible for the field data collection. |
| Census_date_2025 | YYYY-MM-DD | Date of the field validation for the dataset crownmaps_2025. |
| Dataset_CrownLightLiana | - | For the 50-ha plot, data for the crown, illumination, and liana columns were compiled from three historical sources: "crownmaps_2023", "dendrometer_2024", and "crownmaps_2025". For all other plots, data comes exclusively from crownmaps_2025, meaning those polygons were fully verified in 2025. |
| Census_date_CrownLightLiana | YYYY-MM-DD | Date of the field validation process from the datasets: "crownmaps_2023", and "dendrometer_2024". |
| Global_id | - | Universally unique identifier (UUID) within the geodataframe. |
Application and Derivation
This dataset is an important resource for linking remote sensing data with tropical tree taxonomic identification. It can facilitate training and testing methods for classifying tropical tree taxa from remote sensing data, as well as utilization of remote sensing data to quantify species-specific variation in phenology and canopy dynamics.
The Barro Colorado Nature Monument (BCNM) is a world-renowned tropical forest research site located within the Panama Canal region. It includes Barro Colorado Island (BCI) and five nearby peninsulas and has been managed by the Smithsonian Tropical Research Institute (STRI) since 1946. Created during the construction of the Panama Canal, BCI is the most extensively studied tropical forest globally. It supports long-term ecological monitoring, biodiversity research, and a research station, and it also offers guided visits that allow the public to explore its exceptional wildlife and scientific value.
For additional background, see Muller-Landau and Wright (2024), an edited volume with extensive information about the plants and ecosystem of the BCNM. Wright et al. (2024) provides a review of research on the Gigante fertilization plot. Meakem et al. (2024) analyze forest structure, dynamics, and composition in the other large plots used here, Muller-Landau and Svenning (2024) review landscape-level variation across BCI, and Yavitt (2024) reviews the soils of BCI. Baudchon et al. (2025) presents the crown detection algorithm used here, which was chained with the Segment Anything Model 2 (SAM2) to generate crown segmentations using the CanopyRS pipeline (https://github.com/hugobaudchon/CanopyRS). Graves et al. (2018) present a similar crown mapping method. Related datasets include airborne lidar (ForestGEO Smithsonian 2024), drone imagery products (Cushman et al., 2022, Vasquez et al. 2024), and a previous crown map of the BCI 50-ha plot (Vasquez et al., 2023).
Quality Assessment
Tree crown polygons created or modified in the field were refined in the lab where more advanced drawing tools are available. Tree tag assignments were evaluated by calculating the distance between each polygon’s centroid and the corresponding stem location. Greater distances indicated a higher likelihood of incorrect tag assignment. Any stem located more than 20 m from its assigned crown centroid was flagged as inaccurate. These cases were reviewed to identify nearby candidate trees or potential field-entry errors. If discrepancies remain unresolved, additional fieldwork was conducted.
Data Acquisition, Materials, and Methods
This dataset includes all crown segments with an area of at least 25 square meters that could be linked to tagged stems. The dataset covers nine large, partially overlapping forest plots: the Gigante Fertilization plot (38.4-ha), three plots on Barro Colorado Island (BCI; 50-ha, 25-ha, and 10-ha), four additional 6-ha BCI plots (AVA, Pearson, Drayton, and Zetek), and the San Lorenzo plot (5.96- ha, formerly known as the Sherman plot). The AVA plot overlaps the 10-ha and 25-ha plots, and the Drayton plot slightly overlaps the 50-ha plot (Figure 1).
Tag numbers and species identifications were from prior censuses of these plots, which had differing size thresholds: 1 cm minimum stem diameter for the BCI 50-ha and San Lorenzo plots, 20-cm minimum diameter for the 25-ha, 10-ha, and 6-ha plots, and mixed thresholds (1-20 cm) for the Gigante plot depending on within-plot location. Whether smaller crowns could be linked with tagged trees depended in part on the minimum diameter for the relevant plot. Published tree census datasets for these plots can be found at Wright (2024), Wright (2026), Condit et al. (2019, and Condit et al. (2022).
Creation of the tree crown polygons involved three steps: creation of the field data sheet form, field data collection, and quality assurance in the lab. The procedure used is similar to the one described in Graves et al. (2018).
Orthomosaics and Field Data Sheet Creation
To build the field data collection form, orthophotographs and vector layers (plot boundaries, crown segmentations, and trails) were prepared. These layers provided the spatial context needed for navigation and accurate data entry in the field. High-resolution orthomosaics were generated from RGB aerial photographs collected during drone mapping missions using a Trinity Pro UAV and a DJI Mavic Enterprise 3 (ME3) (Arauz et al., 2026). This imagery was collected by the Plant Functional Ecology Laboratory (LEFO) at Université de Montréal and Mila (Gigante plot) and by members of the GIGANTE large tree mortality project (BCI 50-ha, 25-ha, 10-ha, AVA, Drayton, Pearson, and Zetek). The imagery was processed in Agisoft Metashape to produce three site-specific orthomosaics: Barro Colorado Island (BCI) whole-island (3.93-cm/pixel spatial resolution), the Gigante Fertilization plot (1.85 cm resolution), and the San Lorenzo or Sherman plot (1.89 cm resolution). The BCI whole-island orthomosaic include the plots: 50-ha, 25-ha, 10-ha, AVA, Pearson, Zetek and Drayton.
Initial tree crown segmentation was performed by members of the Plant Functional Ecology Laboratory (LEFO) at Université de Montréal and Mila using a workflow they developed (https://github.com/hugobaudchon/CanopyRS). The workflow began with detecting individual crowns using a DINO + Swin L-384 crown detector to generate bounding boxes (Baudchon et al., 2025). Duplicate boxes were removed using non-maximum suppression (NMS), and selected bounding boxes were used by SAM-2, which produced precise polygon masks that trace actual crown boundaries. The final crown masks were saved as vector polygons, cleaned, and assigned unique IDs, resulting in detailed crown maps ready for integration with field data. Orthomosaics and crown layers were saved into a data collection form.
Field Data Collection
Field data collection was conducted via the ArcGIS FieldMaps application on mobile devices. The process began with the spatial verification of automated tree crown segmentations. If a segmentation was inaccurate, the boundary was manually redrawn using the most recent orthomosaic as a reference; otherwise, it was marked as verified. To ensure data integrity, each tree tag was linked to its corresponding polygon by observing the tree from below and comparing its position relative to neighboring trees or palms. The date of each field evaluation was recorded.
Next, the crown’s physical condition was assessed using standardized scales. Crown intactness was measured on a four-point scale: 4 (75–100 percent intact), 3 (50–75 percent), 2 (25–50 percent), and 1 (less than 25 percent). Crown illumination was evaluated on a five-point scale based on vertical and lateral exposure to direct light, disregarding liana coverage: 5 (completely exposed), 4 (greater or equal to 90 percent vertical exposure), 3 (10–90 percent vertical exposure), 2 (equal or less than 10 percent vertical exposure), and 1 (no direct light). Liana or strangler infestation was recorded on a scale where 4 represents 76–100 percent coverage, 3 represents 51–75 percent, 2 represents 26–50 percent, 1 represents 1–25 percent, and 0 indicates no lianas. Accuracy for upper canopy lianas was ensured by viewing the crown from multiple vantage points using binoculars (Muller-Landau, 2023). Phenological status and deciduousness were assessed by presence of new leaves, mature leaves, flowers, and fruits. These attributes were assigned values of Complete, Partial, or None based on their proportional coverage relative to the total crown.
Quality assurance in the lab
Field data were reviewed for inconsistencies and corrected manually (see Quality Assessment above). The primary objective of this process was to assign a species identification to each crown based on the tree tag recorded during fieldwork and existing forest census data. Additional variables, such as crown area (in square meters), were calculated for each polygon.
The 7,688 crown segments were linked to tagged trees representing 204 unique species, of which 3,838 crowns are liana-free.
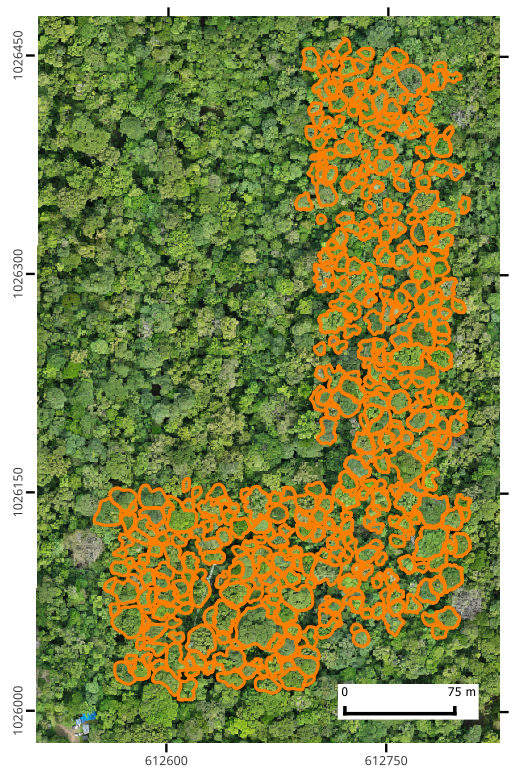
Figure 2. Tree crown polygons (orange) overlaid on UAV-derived orthophoto mosaic of the San Lorenzo (Sherman) plot (approximately 9.282 lat,-79.974 lon) west of Gatun, Panama. Ticks show UTM zone 17N (EPSG: 32617) coordinates.
Contributions
Contributions of the coauthors: F. Arauz led the data collection, contributed to field form preparation, curated the data, conducted the data quality assurance, and drafted the text. H. C. Muller-Landau conceptualized the research, secured funding, supervised the work, and reviewed and edited the data and text. M. Hernandez, P. Villarreal, P. Ramos, A. Agrazal, M. Perez, and M. Demarsan contributed to field data collection.
A number of additional people also contributed to this dataset. Members of the Plant Functional Ecology Laboratory (LEFO) at Université de Montréal and Mila, led by E. Laliberté, developed the automatic crown segmentation workflow, especially: H. Baudchon, A. Ouaknine, M. Teng, M. Weiss, V. Le Falher, S. Demers-Thibeault, and A. Caron-Guay. GIGANTE project members C. Gutierrez, V. Rubio Ramos, I. McGregor, E.M. Gora, and A. Esquivel Muelbert and LEFO lab member A. Caron-Guay acquired and processing the orthomosaic imagery. M. Solano produced the FieldMaps forms and provided GIS support. Finally, this dataset depends critically on prior tree censuses and species identifications in the mapped plots; the contributions of the many people who worked on these censuses is acknowledged, especially botanists R. Pérez, S. Aguilar, and O. Hernandez.
Data Access
These data are available through the Oak Ridge National Laboratory (ORNL) Distributed Active Archive Center (DAAC).
AVUELO: Tropical Forest Crown Maps with Tree Species Names, Panama
Contact for Data Center Access Information:
- E-mail: uso@daac.ornl.gov
- Telephone: +1 (865) 241-3952
References
Araúz, F., M. Hernández, P. Villarreal, P. Ramos, A. Agrazal, M. Pérez, M. Demarsan, and H.C. Muller-Landau. 2026. Field-verified canopy tree crown segmentation for 7,536 crowns across 147.4 hectares of tropical forest plots in the Barro Colorado Nature Monument, Panama in 2025. Smithsonian Research Data Repository. https://doi.org/10.60635/C34S6C
Baudchon, H., A. Ouaknine, M. Weiss, M. Teng, T.R. Walla, A. Caron-Guay, C. Pal, and E. Laliberté. 2025. SelvaBox: A high-resolution dataset for tropical tree crown detection. arXiv 2507.00170. https://doi.org/10.48550/arXiv.2507.00170
Condit, R., R. Pérez, S. Aguilar, S. Lao, R. Foster, and S. Hubbell. 2019, June 7. Complete data from the Barro Colorado 50-ha plot: 423617 trees, 35 years. Dryad. https://doi.org/10.15146/5xcp-0d46
Condit, R., R. Pérez, S. Aguilar, and S. Lao. 2019, July 20. Census data from 65 tree plots in Panama, 1994-2015. Dryad. https://doi.org/10.15146/mdpr-pm59
Cushman, K., H. Muller-Landau, M. Detto, and M. Garcia. 2022. Soils and topography control natural disturbance rates and thereby forest structure in a lowland tropical landscape. Smithsonian Tropical Research Institute. https://doi.org/10.25573/data.17102600.v1
ForestGEO Smithsonian. 2024. 2023 high-resolution airborne LiDAR data for Barro Colorado Island and other Smithsonian ForestGEO Sites in Central Panama. Smithsonian Research Data Repository. https://doi.org/10.60635/C34W2W
Graves, S., J. Gearhart, T.T. Caughlin, and S. Bohlman. 2018. A digital mapping method for linking high-resolution remote sensing images to individual tree crowns. PeerJ Preprints 6:e27182v1. https://doi.org/10.7287/peerj.preprints.27182v1
Meakem, V., S.J. Wright, and H. Muller-Landau. 2024. Variation in forest structure, dynamics, and composition across 108 ha of large forest plots on Barro Colorado Island. In H. Muller-Landau. and S.J. Wright (eds). The First 100 Years of Research on Barro Colorado: Plant and Ecosystem Science. Smithsonian Insitution Scholarly Press; Washington, DC. https://doi.org/10.5479/si.26809618
Muller-Landau, H. 2023. Combined Band Dendrometer Protocol Used by ForestGEO in Panama. Smithsonian Tropical Research Institute. https://doi.org/10.25573/data.20010176.v1
Muller-Landau, H., and J.-C. Svenning. 2024. An Introduction to Landscape-Level Variation Across the Barro Colorado Nature Monument. In H. Muller-Landau. and S.J. Wright (eds). The First 100 Years of Research on Barro Colorado: Plant and Ecosystem Science. Smithsonian Insitution Scholarly Press; Washington, DC. https://doi.org/10.5479/si.26814820
Muller-Landau, H.C., and S.J. Wright (eds). 2024. The First 100 Years of Research on Barro Colorado: Plant and Ecosystem Science (Volumes 1 and 2). Smithsonian Insitution Scholarly Press; Washington, DC. https://doi.org/10.5479/si.26048527
Vasquez, V., M. Garcia, M. Hernandez, and H. Muller-Landau. 2023. Barro Colorado Island 50-ha plot aerial photogrammetry orthomosaics and digital surface models for 2018-2023: Globally and locally aligned time series. Smithsonian Tropical Research Institute. https://doi.org/10.25573/data.24782016
Vasquez, V., M. Garcia, M. Hernandez, and H. Muller-Landau. 2024. Barro Colorado Island 50-ha Plot Aerial Photogrammetry (2018-2024): Orthomosaics, Digital Surface Models, Point Clouds, Raw Images, and Globally/Locally Aligned Timeseries. Smithsonian Research Data Repository. https://doi.org/10.60635/C3KW2X
Wright, J., K.E. Harms, O. Hernández, M.N. Garcia, and J.B. Yavitt. 2024. Insights from a Long-term, Factorial Nitrogen, Phosphorus, and Potassium Addition Experiment Conducted in a Mature Lowland Tropical Forest in the Barro Colorado Nature Monument. In H. Muller-Landau. and S.J. Wright (eds). The First 100 Years of Research on Barro Colorado: Plant and Ecosystem Science. Smithsonian Insitution Scholarly Press; Washington, DC. https://doi.org/10.5479/si.26880808
Wright, J. 2024. Tree census data for the 25-ha, 10-ha and tower plots on Barro Colorado Island, Panama. Smithsonian Tropical Research Institute. https://doi.org/10.25573/data.24531133
Wright, S.J. 2026. Tree census data for 21 years and 58 hectares of secondary and old-growth forests at Barro Colorado Island, Panama. Dryad. https://doi.org/10.5061/dryad.1g1jwsvc3
Yavitt, J.B. 2024. Soils of Barro Colorado Island. In H. Muller-Landau. and S.J. Wright (eds). The First 100 Years of Research on Barro Colorado: Plant and Ecosystem Science. Smithsonian Insitution Scholarly Press; Washington, DC. https://doi.org/10.5479/si.26809609