Documentation Revision Date: 2019-09-30
Dataset Version: 1
Summary
This dataset includes 201 files in comma-delimited text (ICARTT) format.
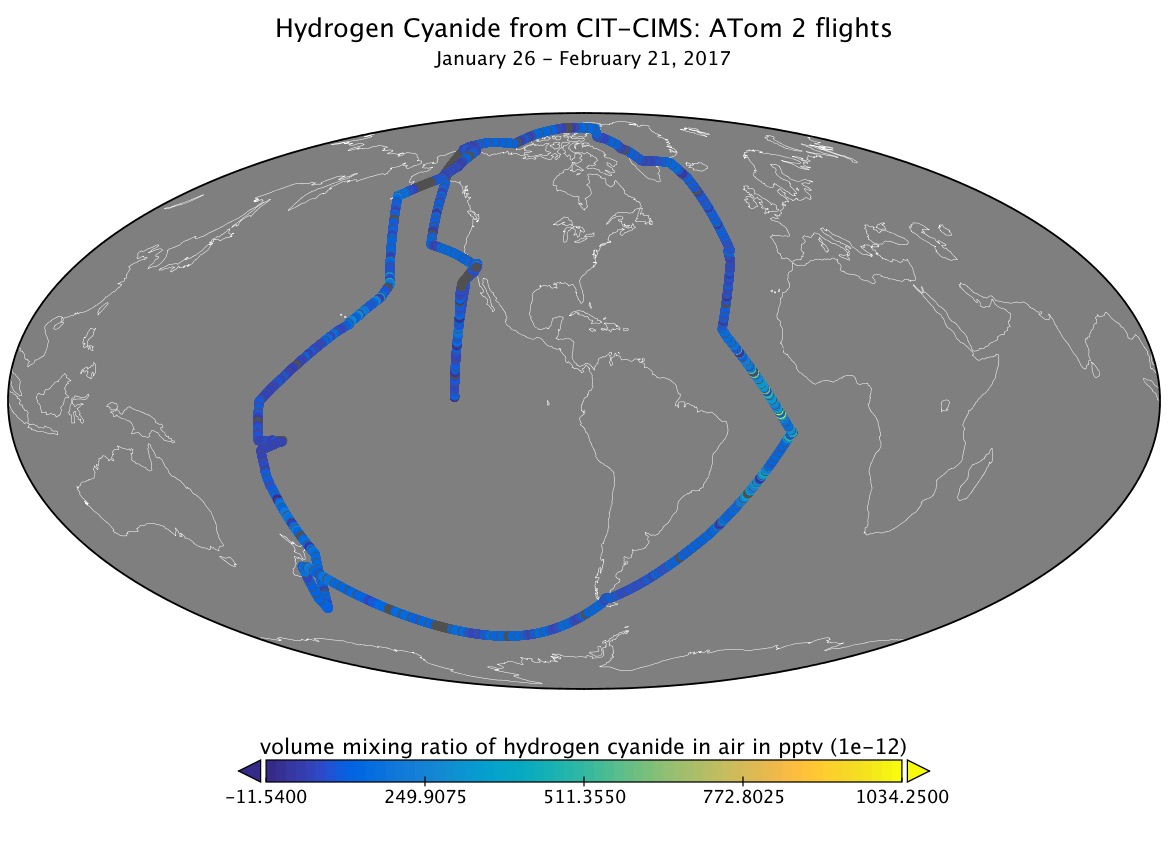
Figure 1. Measurements of Hydrogen Cyanide from the CIT-CIMS instrument taken during ATom 2 flights.
Citation
Allen, H.M., J.D. Crounse, M.J. Kim, A.P. Teng, and P.O. Wennberg. 2019. ATom: L2 In Situ Data from Caltech Chemical Ionization Mass Spectrometer (CIT-CIMS). ORNL DAAC, Oak Ridge, Tennessee, USA. https://doi.org/10.3334/ORNLDAAC/1713
Table of Contents
- Dataset Overview
- Data Characteristics
- Application and Derivation
- Quality Assessment
- Data Acquisition, Materials, and Methods
- Data Access
- References
Dataset Overview
This dataset provides the concentrations of gas phase organic and inorganic analytes measured by the California Institute of Technology (CIT) Chemical Ionization Mass Spectrometer (CIMS), or CIT-CIMS. The CIT-CIMS employs CF3O-ion chemistry with two independent mass spectrometers (compact time-of-flight and triple quadrupole) to enable sensitive and specific measurements of atmospheric trace gases. The measurements include hydrogen cyanide (HCN), nitric acid (HNO3), methyl hydrogen peroxide (CH3OOH), peroxyacetic acid (C2O3H4), peroxynitric acid (HO2NO2), and sulfur dioxide (SO2), in parts-per-trillion-by-volume (pptv).
Project: Atmospheric Tomography Mission (ATom)
The Atmospheric Tomography Mission (ATom) was a NASA Earth Venture Suborbital-2 mission. It studied the impact of human-produced air pollution on greenhouse gases and on chemically reactive gases in the atmosphere. ATom deployed an extensive gas and aerosol payload on the NASA DC-8 aircraft for systematic, global-scale sampling of the atmosphere, profiling continuously from 0.2 to 12 km altitude. Flights occurred in each of four seasons over a 4-year period.
Related Data
ATom: Merged Atmospheric Chemistry, Trace Gases, and Aerosols. Data from all ATom instruments and all four flight campaigns, including aircraft location and navigation data, merged to several different time bases: https://doi.org/10.3334/ORNLDAAC/1581
ATom Flight Track and Navigational Data. Flight path (location and altitude) data for each of the four campaigns provided in KML and csv format: https://doi.org/10.3334/ORNLDAAC/1613
Data Characteristics
Spatial Coverage: Global. Flights circumnavigate the globe, primarily over the oceans.
Spatial Resolution: Point measurements
Temporal Coverage: Periodic flights occurred during each deployment.
Table 1. Flight campaign schedule
| Deployment | Date Range |
|---|---|
| ATom-1 | July 29 - August 23, 2016 |
| ATom-2 | January 26 - February 21, 2017 |
| ATom-3 | September 28 - October 28, 2017 |
| ATom-4 | April 24 - May 21, 2018 |
Temporal Resolution: 1 second
Data File Information
This dataset includes 201 files in comma-delimited text (ICARTT) format. Data files conform to the ICARTT File Format Standards V1.1.
File names are structured as CIT-measurement_DC8_YYYYMMDD_R1, where measurement is an abbreviation for what was measured and YYYYMMDD is the start date (in UTC time) of the flight.
Table 2. Quantity and measurements given each file name.
| File Name | Number of Files | Measurement |
|---|---|---|
| CIT-H2O2_DC8_YYYYMMDD_R1.ict | 35 | hydrogen peroxide (H2O2) |
| CIT-HCN_DC8_YYYYMMDD_R1.ict | 35 | hydrogen cyanide (HCN) |
| CIT-HNO3_DC8_YYYYMMDD_R1.ict | 35 | nitric acid (HNO3) |
| CIT-MHP_DC8_YYYYMMDD_R2.ict | 35 | methyl hydrogen peroxide (CH3OOH) |
| CIT-PAA_DC8_YYYYMMDD_R1.ict | 22 | peroxyacetic acid (C2O3H4) |
| CIT-PNA_DC8_YYYYMMDD_R0.ict | 22 | peroxynitric acid (HO2NO2) |
| CIT-SO2_DC8_YYYYMMDD_R1.ict | 17 | sulfur dioxide (SO2) |
Table 3. Variables in the data files. Note: Missing data are indicated by -9999.000. UTC_start is included as a variable in every file, and indicates the seconds since seconds since midnight (UTC) that a measurement was taken. Measurements are from ambient air and reported as 1 second averages. Do not extrapolate data outside of given time interval as these are discrete measurements.
| File Name | Variable Name | Units | Description |
|---|---|---|---|
| all files | UTC_start | seconds | seconds since midnight UTC |
| CIT-H2O2_DC8_YYYYMMDD_R1.ict | H2O2_CIT | pptv | volume mixing ratio of H2O2 in parts per trillion volume |
| CIT-HCN_DC8_YYYYMMDD_R1.ict | HCN_CIT | pptv | volume mixing ratio of HCN in parts per trillion volume |
| CIT-HNO3_DC8_YYYYMMDD_R1.ict | HNO3_CIT | pptv | volume mixing ratio of HNO3 in parts per trillion volume |
| CIT-MHP_DC8_YYYYMMDD_R2.ict | UTCstop | seconds | seconds since midnight UTC |
| CIT-MHP_DC8_YYYYMMDD_R2.ict | UTCmid | seconds | seconds since midnight UTC |
| CIT-MHP_DC8_YYYYMMDD_R2.ict | MHP_CIT | pptv | volume mixing ratio of CH3OOH in parts per trillion volume |
| CIT-PAA_DC8_YYYYMMDD_R1.ict | PAA_CIT | pptv | volume mixing ratio of C2O3H4 in parts per trillion volume |
| CIT-PNA_DC8_YYYYMMDD_R0.ict | PNA_CIT | pptv | volume mixing ratio of HO2NO2 in parts per trillion volume |
| CIT-SO2_DC8_YYYYMMDD_R1.ict | SO2_CIT | pptv | volume mixing ratio of SO2 in parts per trillion volume |
Application and Derivation
ATom builds the scientific foundation for mitigation of short-lived climate forcers, in particular methane (CH4), tropospheric ozone (O3), and Black Carbon aerosols (BC).
ATom Science Questions
Tier 1
What are chemical processes that control the short-lived climate forcing agents CH4, O3, and BC in the atmosphere? How is the chemical reactivity of the atmosphere on a global scale affected by anthropogenic emissions? How can we improve chemistry-climate modeling of these processes?
Tier 2
- Over large, remote regions, what are the distributions of BC and other aerosols important as short-lived climate forcers? What are the sources of new particles? How rapidly do aerosols grow to CCN-active sizes? How well are these processes represented in models?
- What type of variability and spatial gradients occur over remote ocean regions for greenhouse gases (GHGs) and ozone depleting substances (ODSs)? How do the variations among air parcels help identify anthropogenic influences on photochemical reactivity, validate satellite data for these gases, and refine knowledge of sources and sinks?
Significance
ATom delivers unique data and analysis to address the Science Mission Directorate objectives of acquiring “datasets that identify and characterize important phenomena in the changing Earth system” and “measurements that address weaknesses in current Earth system models leading to improvement in modeling capabilities.” ATom will provide unprecedented challenges to the CCMs used as policy tools for climate change assessments, with comprehensive data on atmospheric chemical reactivity at global scales, and will work closely with modeling teams to translate ATom data to better, more reliable CCMs. ATom provides extraordinary validation data for remote sensing.
Quality Assessment
Table 4. Uncertainty of measurement values in parts per trillion volume.
| File Name | Uncertainty |
|---|---|
| CIT-H2O2_DC8_YYYYMMDD_R1.ict | +- (30% of measurement value + 50 pptv ) |
| CIT-HCN_DC8_YYYYMMDD_R1.ict | +- ( 50% of measurement value + 50 pptv ) |
| CIT-HNO3_DC8_YYYYMMDD_R1.ict | +- ( 30% of measurement value + 50 pptv ) |
| CIT-MHP_DC8_YYYYMMDD_R2.ict | +- ( 30% of measurement value + 25 pptv ) |
| CIT-PAA_DC8_YYYYMMDD_R1.ict | +- ( 50% of measurement value + 30 pptv ) |
| CIT-PNA_DC8_YYYYMMDD_R0.ict | +- ( 30% of measurement value + 100 pptv ) |
| CIT-SO2_DC8_YYYYMMDD_R1.ict | +- ( 30% of measurement value + 250 pptv ) |
Data Acquisition, Materials, and Methods
Project Overview
ATom makes global-scale measurements of the chemistry of the atmosphere using the NASA DC-8 aircraft. Flights span the Pacific and Atlantic Oceans, nearly pole-to-pole, in continuous profiling mode, covering remote regions that receive long-range inputs of pollution from expanding industrial economies. The payload has proven instruments for in situ measurements of reactive and long-lived gases, diagnostic chemical tracers, and aerosol size, number, and composition, plus spectrally resolved solar radiation and meteorological parameters.
Combining distributions of aerosols and reactive gases with long-lived GHGs and ODSs enables disentangling of the processes that regulate atmospheric chemistry: emissions, transport, cloud processes, and chemical transformations. ATom analyzes measurements using customized modeling tools to derive daily averaged chemical rates for key atmospheric processes and to critically evaluate Chemistry-Climate Models (CCMs). ATom also differentiates between hypotheses for the formation and growth of aerosols over the remote oceans.
Caltech Chemical Ionization Mass Spectrometers (CIT-CIMS):
| Instrument | Full Name | Contact Person | Type | Measurements |
|---|---|---|---|---|
| CIT-CIMS | Caltech Chemical Ionization Mass Spectrometers (CIT-CIMS) | Paul Wennberg | Chemical Ionization Mass Spectrometer (CIMS) | gas phase organic and inorganic analytes |
The CIT-CIMS instrumentation as deployed during ATom uses two mass spectrometers, a compact time-of-flight and a triple quadrupole, to detect trace gases in the atmosphere. Analytes react with the CF3O-reagent ion to form specific product ions which are subsequently detected by the mass analyzers. The triple quadrupole mass spectrometer enables collisional induced fragmentation (CID) of product ions, and subsequent analysis of fragment ions. This methodology allows for distinguishing certain mass analogs and reducing instrumental backgrounds. For ATom, CH3OOH data is derived from the triple quadrupole instrument, and the remainder of the data files are from the compact time-of-flight instrument. See Crounse, et al., 2006 and St. Clair, et al., 2010 for more information.
Note: It is possible that formaldehyde hydrate (HOCH2OH) contributes a significant artifact impacting the reported CH3OOH values for boundary layer sampling during the ATom mission. In the free and upper troposphere the impact of this artifact is expected to be negligible.
Data Access
These data are available through the Oak Ridge National Laboratory (ORNL) Distributed Active Archive Center (DAAC).
ATom: L2 In Situ Data from Caltech Chemical Ionization Mass Spectrometer (CIT-CIMS)
Contact for Data Center Access Information:
- E-mail: uso@daac.ornl.gov
- Telephone: +1 (865) 241-3952
References
Crounse, J.D., McKinney, K.A., Kwan, A.J., and Wennberg, P.O., 2006. Measurement of gas-phase hydroperoxides by chemical ionization mass spectrometry. Analytical Chemistry, 78, 6726–6732. https://doi.org/10.1021/ac0604235
St. Clair, J.M., McCabe, D.C., Crounse, J.D., Steiner, U. and Wennberg, P.O., 2010. Chemical ionization tandem mass spectrometer for the in situ measurement of methyl hydrogen peroxide. Review of Scientific Instruments, 81(9), p.094102.