Documentation Revision Date: 2019-06-21
Dataset Version: 1
Summary
The measurement process begins when OH is both excited and detected with transition near 308 nm. HO2 is reacted with reagent nitrogen oxide (NO) to form OH and is then detected with LIF. The laser is tuned on and off the OH wavelength to determine the fluorescence and background signals. ATHOS can detect OH and HO2 in clear air and light clouds from Earth's surface to the lower stratosphere. The ambient air is slowed from the aircraft speed of 240 m/s to 8-40 m/s in an aerodynamic nacelle. It is then pulled by a vacuum pump through a small inlet, up a sampling tube, and into two low-pressure detection cells: the first for OH and the second for HO2. Detection occurs in each cell at the intersection of the airflow, the laser beam, and the detector field-of-view.
This dataset includes 138 files in comma-delimited text (ICARTT) format, with three data files per flight.
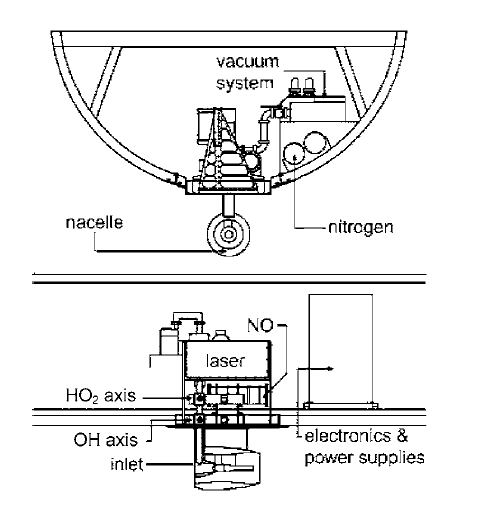
Figure 1. A schematic of ATHOS looking from in front of the electronics rack (top) and from the DC-8 aircraft's port side (bottom).
Citation
Brune, W.H., D.O. Miller, and A.B. Thames. 2019. ATom: L2 Measurements from Airborne Tropospheric Hydrogen Oxides Sensor (ATHOS). ORNL DAAC, Oak Ridge, Tennessee, USA. https://doi.org/10.3334/ORNLDAAC/1709
Table of Contents
- Dataset Overview
- Data Characteristics
- Application and Derivation
- Quality Assessment
- Data Acquisition, Materials, and Methods
- Data Access
- References
Dataset Overview
This dataset provides the concentrations of hydrogen oxides measured by the Airborne Tropospheric Hydrogen Oxides Sensor (ATHOS) during airborne campaigns conducted by NASA's Atmospheric Tomography (ATom) mission from 2016 - 2018. ATHOS uses laser-induced fluorescence (LIF) to measure hydroxide (OH) and hydroperoxyl (HO2) simultaneously. The measurements include OH and HO2 mixing ratio in parts-per-trillion-by-volume (pptv), OH interference from chemical removal in pptv, and OH reactivity from discharge flow in hertz.
The measurement process begins when OH is both excited and detected with transition near 308 nm. HO2 is reacted with reagent nitrogen oxide (NO) to form OH and is then detected with LIF. The laser is tuned on and off the OH wavelength to determine the fluorescence and background signals. ATHOS can detect OH and HO2 in clear air and light clouds from Earth's surface to the lower stratosphere. The ambient air is slowed from the aircraft speed of 240 m/s to 8-40 m/s in an aerodynamic nacelle. It is then pulled by a vacuum pump through a small inlet, up a sampling tube, and into two low-pressure detection cells: the first for OH and the second for HO2. Detection occurs in each cell at the intersection of the airflow, the laser beam, and the detector field-of-view.
Project: Atmospheric Tomography Mission (ATom)
The Atmospheric Tomography Mission (ATom) was a NASA Earth Venture Suborbital-2 mission. It studied the impact of human-produced air pollution on greenhouse gases and on chemically reactive gases in the atmosphere. ATom deployed an extensive gas and aerosol payload on the NASA DC-8 aircraft for systematic, global-scale sampling of the atmosphere, profiling continuously from 0.2 to 12 km altitude. Flights occurred in each of four seasons over a 4-year period.
Related Data:
ATom: Merged Atmospheric Chemistry, Trace Gases, and Aerosols. Data from all ATom instruments and all four flight campaigns, including aircraft location and navigation data, merged to several different time bases: https://doi.org/10.3334/ORNLDAAC/1581
ATom Flight Track and Navigational Data. Flight path (location and altitude) data for each of the four campaigns provided in KML and csv format: https://doi.org/10.3334/ORNLDAAC/1613
Data Characteristics
Spatial Coverage: Global. Flights circumnavigate the globe, primarily over the oceans
Spatial Resolution: Point measurements
Temporal Coverage: Periodic flights occurred during each campaign
Table 1. Flight campaign schedule
| Deployment | Date Range |
|---|---|
| ATom-1 | July 29 - August 23, 2016 |
| ATom-2 | January 26 - February 21, 2017 |
| ATom-3 | September 28 - October 28, 2017 |
| ATom-4 | April 24 - May 21, 2018 |
Temporal Resolution: 1 second
Data File Information
This dataset includes 138 files in comma-delimited text (ICARTT) format, with three files per flight date for all four ATom flight campaigns. Data files conform to the ICARTT File Format Standards V1.1.
File names are structured as ATHOS-MEA_DC8_YYYYMMDD_R#.ict, where MEA is the three-letter abbreviation for the measurement (OHI = OH Interference, OHR = OH Reactivity, HOx = mixing ratios; with 46 files each), YYYYMMDD is the start date (in UTC time) of the flight, and R# is the file version or revision number.
Data Variables
Missing data are indicated by -9999.000.
Table 2. Variables in the OHI data files ATHOS-OHI_DC8_YYYYMMDD_R#.ict.
| Name | Units | Description |
|---|---|---|
| Start_UTC | seconds | seconds since UTC midnight on day of takeoff |
| Stop_UTC | seconds | seconds since UTC midnight on day of takeoff |
| Mid_UTC | seconds | seconds since UTC midnight on day of takeoff |
| OHInterference_ATHOS | pptv | OH interference in parts-per-trillion-by-volume |
Table 3. Variables in the OHR data files ATHOS-OHR_DC8_YYYYMMDD_R#.ict.
| Name | Units | Description |
|---|---|---|
| Start_UTC | seconds | seconds since UTC midnight on day of takeoff |
| Stop_UTC | seconds | seconds since UTC midnight on day of takeoff |
| Mid_UTC | seconds | seconds since UTC midnight on day of takeoff |
| T_OHR | Kelvin | temperature inside OHR instrument in Kelvin |
| P_OHR | kPa | pressure inside OHR instrument in kilopascal |
| OHReactivity_OHR | Hz | OH reactivity in hertz |
Table 4. Variables in the HOx data files ATHOS-HOx_DC8_YYYYMMDD_R#.ict.
| Name | Units | Description |
|---|---|---|
| Start_UTC | seconds | seconds since UTC midnight on day of takeoff |
| Stop_UTC | seconds | seconds since UTC midnight on day of takeoff |
| Mid_UTC | seconds | seconds since UTC midnight on day of takeoff |
| OH_ATHOS | pptv | OH mixing ratio in parts-per-trillion-by-volume |
| HO2_ATHOS | pptv | HO2 mixing ratio in parts-per-trillion-by-volume |
Application and Derivation
ATom builds the scientific foundation for mitigation of short-lived climate forcers, in particular methane (CH4), tropospheric ozone (O3), and Black Carbon aerosols (BC).
ATom Science Questions
Tier 1
- What are chemical processes that control the short-lived climate forcing agents CH4, O3, and BC in the atmosphere? How is the chemical reactivity of the atmosphere on a global scale affected by anthropogenic emissions? How can we improve chemistry-climate modeling of these processes?
Tier 2
- Over large, remote regions, what are the distributions of BC and other aerosols important as short-lived climate forcers? What are the sources of new particles? How rapidly do aerosols grow to CCN-active sizes? How well are these processes represented in models?
- What type of variability and spatial gradients occur over remote ocean regions for greenhouse gases (GHGs) and ozone depleting substances (ODSs)? How do the variations among air parcels help identify anthropogenic influences on photochemical reactivity, validate satellite data for these gases, and refine knowledge of sources and sinks?
Significance
ATom delivers unique data and analysis to address the Science Mission Directorate objectives of acquiring “datasets that identify and characterize important phenomena in the changing Earth system” and “measurements that address weaknesses in current Earth system models leading to improvement in modeling capabilities.” ATom will provide unprecedented challenges to the CCMs used as policy tools for climate change assessments, with comprehensive data on atmospheric chemical reactivity at global scales, and will work closely with modeling teams to translate ATom data to better, more reliable CCMs. ATom provides extraordinary validation data for remote sensing.
Quality Assessment
Estimated absolute uncertainty for OHR measurement is +/- 15% at 2 sigma confidence (with 0.8 s^-1 at 2 sigma confidence in the zero uncertainty), and estimated absolute accuracy for HOx is ~+/- 32% at 2 sigma confidence (actually a multiplicative factor of 1/1.32 to 1.32). The dependence of the instrument detection sensitivity has been quantified for changes in ambient water vapor, pressure, laser power, and the flow velocity of ambient air past the inlet. During the last 7 years, the instrument has been deployed in multi-investigator intensive field studies 5 times on the NASA DC-8 aircraft.
Calibrating ATHOS with the new OH-removing inlet (OHSI) has been difficult, particularly for low pressure (high altitude). The ATHOS HOx calibrations are pressure-dependent, changing a factor of 3-5 over the atmospheric pressure range. The laboratory calibration uses different inlet hole sizes to simulate atmospheric pressure changes. For two years, various calibration approaches were attempted with the OHSI in place, but none gave repeatable results for high altitude measurements. In the laboratory calibrations, it proved to be impossible to simulate the atmospheric airflow with the OHSI on and the smaller inlet sizes. In the end, previous calibration method gave the most repeatable and reliable results. In-flight diagnostics show that OH loss on the OHSI is negligible. Future modifications to the calibration are possible but unlikely.
More information is provided in Faloona et al. (2004).
Data Acquisition, Materials, and Methods
Project Overview
ATom makes global-scale measurements of the chemistry of the atmosphere using the NASA DC-8 aircraft. Flights span the Pacific and Atlantic Oceans, nearly pole-to-pole, in continuous profiling mode, covering remote regions that receive long-range inputs of pollution from expanding industrial economies. The payload has proven instruments for in situ measurements of reactive and long-lived gases, diagnostic chemical tracers, and aerosol size, number, and composition, plus spectrally resolved solar radiation and meteorological parameters.
Combining distributions of aerosols and reactive gases with long-lived GHGs and ODSs enables disentangling of the processes that regulate atmospheric chemistry: emissions, transport, cloud processes, and chemical transformations. ATom analyzes measurements using customized modeling tools to derive daily averaged chemical rates for key atmospheric processes and to critically evaluate Chemistry-Climate Models (CCMs). ATom also differentiates between hypotheses for the formation and growth of aerosols over the remote oceans.
Airborne Tropospheric Hydrogen Oxides Sensor
| Instrument | Full Name | Contact Person | Type | Measurements | Data Variables |
|---|---|---|---|---|---|
| ATHOS | Airborne Tropospheric Hydrogen Oxides Sensor | William H. Brune | Fluorescence | fluorescence and background signals of hydrogen oxides | OH, Napthalene, HO2, NO |
ATHOS uses laser-induced fluorescence (LIF) to measure OH and HO2 simultaneously. OH is both excited and detected with the A2Σ+ (v’=0) → X2π (v”=0) transition near 308 nm. HO2 is reacted with reagent NO to form OH and is then detected with LIF. The laser is tuned on and off the OH wavelength to determine the fluorescence and background signals. ATHOS can detect OH and HO2 in clear air and light clouds from Earth's surface to the lower stratosphere. The ambient air is slowed from the aircraft speed of 240 m/s to 8-40 m/s in an aerodynamic nacelle. It is then pulled by a vacuum pump through a small inlet, up a sampling tube, and into two low-pressure detection cells - the first for OH and the second for HO2. Detection occurs in each cell at the intersection of the airflow, the laser beam, and the detector field-of-view. More information is provided in Faloona et al. (2004).
Data Access
These data are available through the Oak Ridge National Laboratory (ORNL) Distributed Active Archive Center (DAAC).
ATom: L2 Measurements from Airborne Tropospheric Hydrogen Oxides Sensor (ATHOS)
Contact for Data Center Access Information:
- E-mail: uso@daac.ornl.gov
- Telephone: +1 (865) 241-3952
References
Faloona, I. C., et al. (2004), A laser-induced fluorescence instrument for detecting tropospheric OH and HO2: Characteristics and calibration, J. Atmos. Chem., 47, 139-167. https://doi.org/10.1023/B:JOCH.0000021036.53185.0e