Documentation Revision Date: 2026-07-29
Dataset Version: 1
Summary
There are four data files in this dataset in comma-separated values (.csv) format.
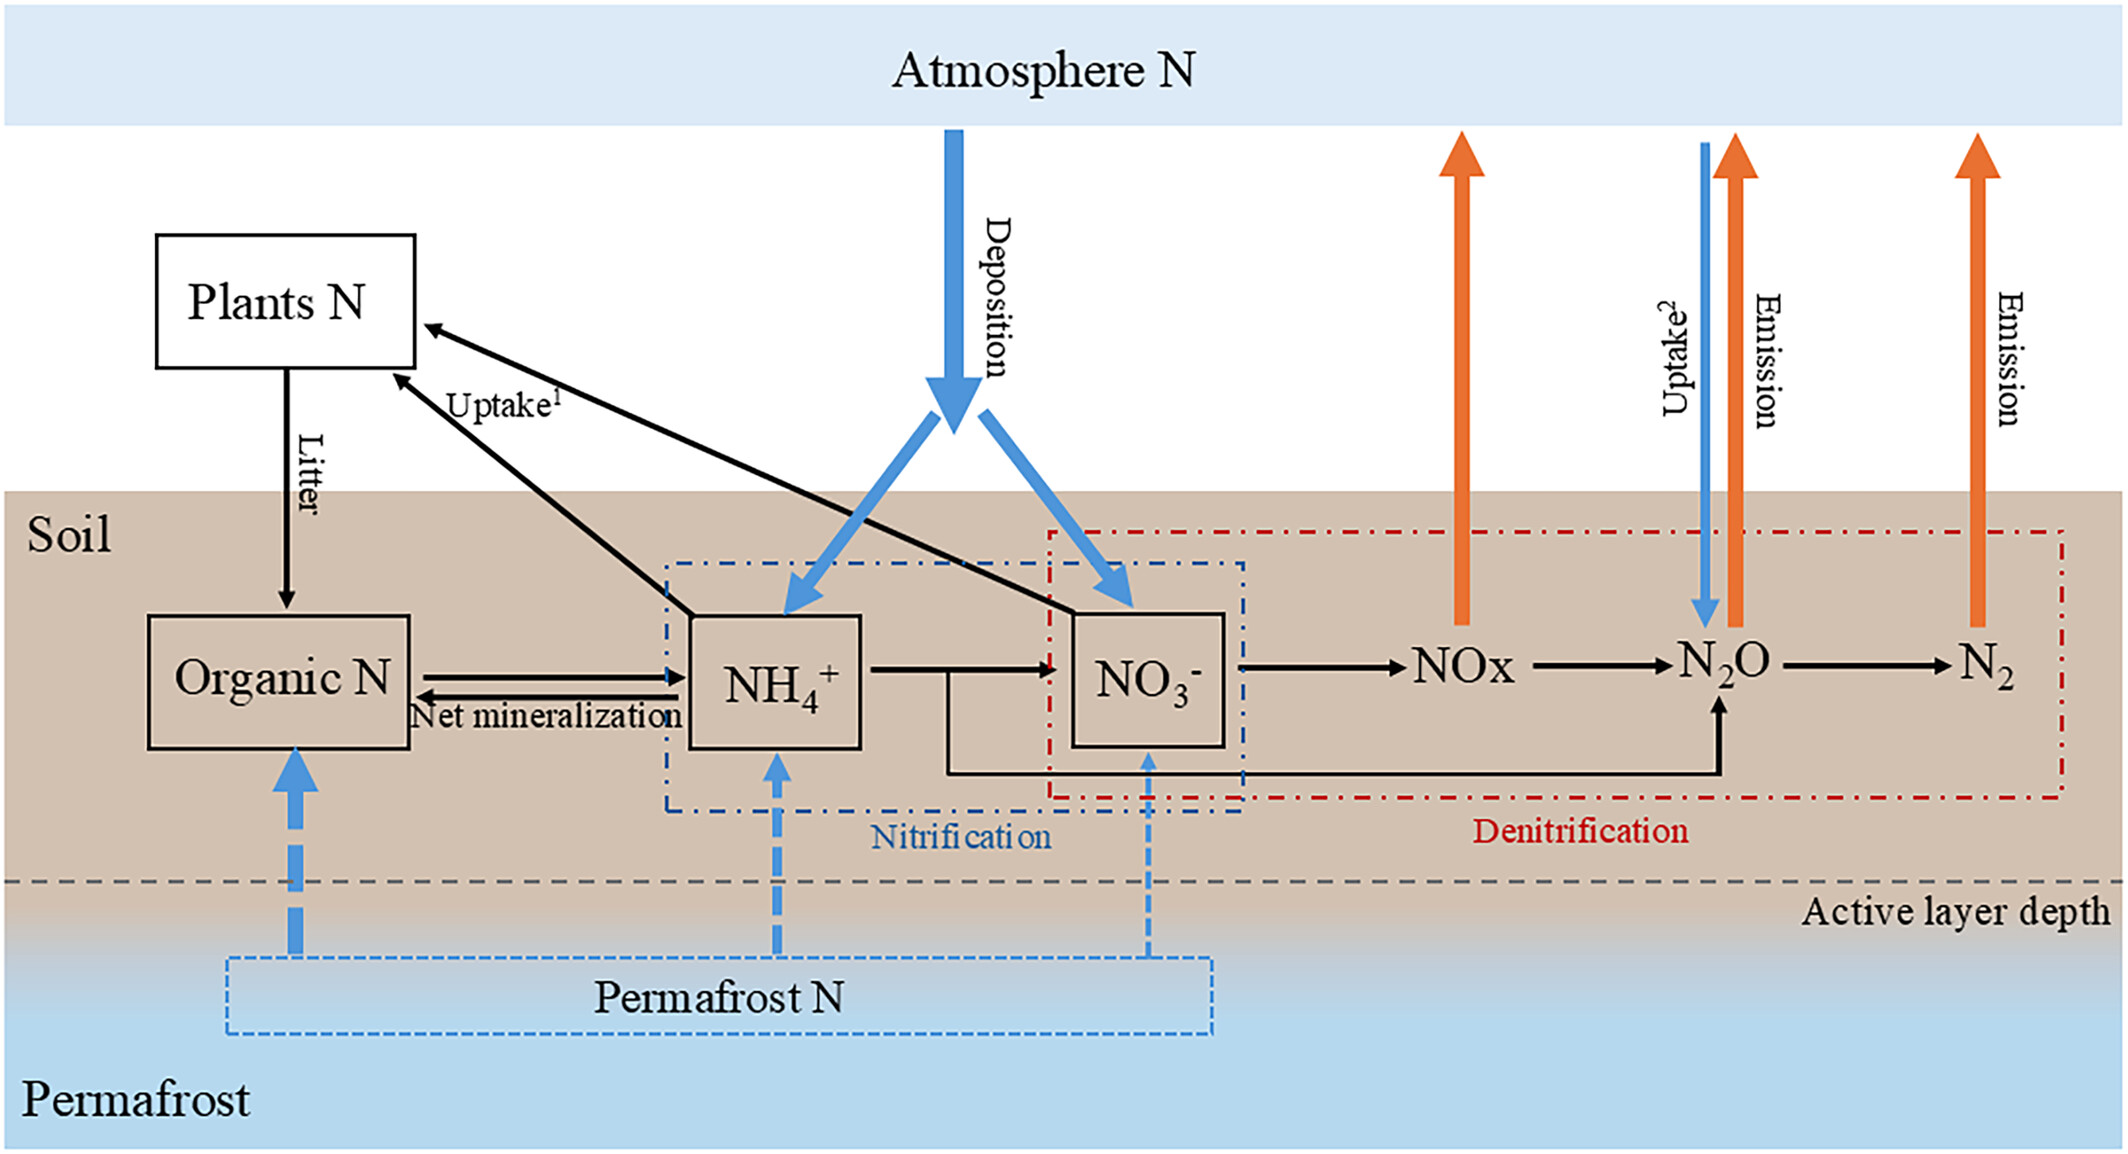
Figure 1. Nitrogen cycle and N2O production in the revised Terrestrial Ecosystem Model. Blue arrows represent nitrogen (N) inputs, while orange arrows represent nitrogen outputs. The active layer depth varies over time. Net mineralization: the difference between mineralization (organic N mineralized to inorganic N) and immobilization (inorganic N to organic N); Litter: organic N from plant litters; Uptake1: inorganic N uptake by plants; Deposition: atmospheric deposition of N; Emission: N2O emissions from soils; Uptake2: Atmospheric N2O uptake in soils.
Citation
Yuan, Y., and Q. Zhuang. 2026. Impacts of Permafrost Degradation on Nitrous Oxide Emissions. ORNL DAAC, Oak Ridge, Tennessee, USA. https://doi.org/10.3334/ORNLDAAC/2510
Table of Contents
- Dataset Overview
- Data Characteristics
- Application and Derivation
- Quality Assessment
- Data Acquisition, Materials, and Methods
- Data Access
- References
Dataset Overview
This dataset contains process-based model simulations of nitrous oxide (N2O) emissions and production from natural terrestrial ecosystems across northern high latitudes under baseline and permafrost-thaw conditions. Simulations cover northern high-latitude terrestrial ecosystems from 1969 to 2019 at a spatial resolution of 0.5 degree × 0.5 degree. Annual gridded outputs are reported in units of mg N m-2 yr-1. The dataset was generated using the Terrestrial Ecosystem Model (TEM), a global-scale biogeochemical model designed to quantify the cycling of carbon (C) and nitrogen (N) in terrestrial ecosystems (McGuire et al., 1997; Melillo et al., 1993; Zhuang et al., 2003; Yuan et al., 2025). The major processes of nitrogen (N) dynamic module were inherited from McGuire et al. (1997) and Yu and Zhuang (2019), including nitrogen input from plant litters, nitrogen uptake by vegetation, net soil mineralization, nitrogen lost from ecosystem, as well as the principles of the stoichiometry of carbon and nitrogen dynamics in soils. The updates to the permafrost and N2O emission processes are described in detail in Yuan et al. (2025). Two simulation scenarios are included: a baseline simulation and a permafrost-thaw simulation. For each scenario, annual gridded outputs include summed N2O net emissions and summed N2O production.
Project: ABoVE
The Arctic-Boreal Vulnerability Experiment (ABoVE) was a field campaign conducted in Alaska and western Canada for nearly ten years, starting in 2015. Researchers participating in ABoVE linked field-based, process-level studies with geospatial data products derived from airborne and satellite sensors. The work provided a foundation for improving the analysis and modeling capabilities needed to understand and predict ecosystem responses to, and societal implications of, climate change in the Arctic and boreal regions.
Related Publication
Yuan, Y., Q. Zhuang, B. Zhao, and N. Shurpali. 2025. Impacts of permafrost degradation on N2O emissions from natural terrestrial ecosystems in northern high latitudes: A process-based biogeochemistry model analysis. Global Biogeochemical Cycles 39:e2024GB008439. https://doi.org/10.1029/2024GB008439
Acknowledgements
This research was supported by the NASA ABoVE Program.
Data Characteristics
Spatial Coverage: High northern latitudes
ABoVE Reference Locations
Domain: Core ABoVE
Spatial Resolution: 0.5 degree x 0.5 degree
Temporal Coverage: 1969 - 2019
Temporal Resolution: Annual
Study Area: Latitude and longitude are given in decimal degrees.
| Site | Westernmost Longitude | Easternmost Longitude | Northernmost Latitude | Southernmost Latitude |
|---|---|---|---|---|
| High Northern Latitudes | -180 | 180 | 83 | 45 |
Data File Information
There are four data files in this dataset in comma-separated values (.csv) format. The model domain includes 28,009 grid cells (0.5° × 0.5°) in the northern high latitudes, and the simulation spans 51 years. Therefore, the total number of records in each file is 28,009 × 51 = 1,428,459.
Table 1. File Descriptions
| n2o_emission_1969_2019_annual.csv | Annual summed N2O net emissions for each 0.5° × 0.5° grid cell, 1969–2019 |
| n2o_production_1969_2019_annual.csv | Annual summed N2O production for each grid cell, 1969–2019 |
| n2o_emission_PermaThaw_1969_2019_annual.csv | Annual summed N2O net emissions under permafrost-thaw simulation |
| n2o_production_PermaThaw_1969_2019_annual.csv | Annual summed N2O production under permafrost-thaw simulation |
Table 2. Variables in the CSV data files
| Variable | Units | Description |
|---|---|---|
| Long | degrees east | Longitude of grid cell in decimal degrees |
| Lat | degrees north | Latitude of grid cell in decimal degrees |
| Area | km2 | Area of grid cell |
| Year | YYYY | Year of data |
| YearSum | mg N m-2 yr-1 | Summed annual N2O emissions or production |
Application and Derivation
This dataset provides information on the spatial and temporal patterns of N2O responses to permafrost degradation and can support studies of nitrogen cycling, ecosystem-climate interactions, climate feedbacks, and model intercomparison analyses.
Quality Assessment
Uncertainty associated with the model simulations was evaluated and discussed in Yuan et al. (2025). Sources of uncertainty include model parameterization, process representation, environmental forcing datasets, and assumptions related to permafrost dynamics and nitrogen cycling processes. Additional uncertainty may arise from input climate, soil, and land-surface datasets and their spatial and temporal variability.
The included data contains outputs from the primary simulation scenarios only and does not include separate uncertainty estimates or ensemble results. Users should refer to the associated publication for a detailed description of uncertainty assessment methods and interpretation of model uncertainty.
Data Acquisition, Materials, and Methods
Terrestrial Ecosystem Model is a global-scale biogeochemical model designed to quantify the cycling of carbon (C) and nitrogen (N) in terrestrial ecosystems (McGuire et al., 1997; Melillo et al., 1993; Zhuang et al., 2003; Yuan et al., 2025). The major processes of nitrogen (N) dynamic module were inherited from McGuire et al. (1997) and Yu and Zhuang (2019), including nitrogen input from plant litters, nitrogen uptake by vegetation, net soil mineralization, nitrogen lost from ecosystem, as well as the principles of the stoichiometry of carbon and nitrogen dynamics in soils. Detailed equations can be found in McGuire et al. (1997) and Yu and Zhuang (2019). The N cycling algorithms in the Terrestrial Ecosystem Model (TEM) were revised by enhancing the representation of physical effects on nitrification and denitrification modeling and incorporating the loss of nitrogen through gas emissions with empirical equations, the uptake of N2O from the atmosphere, and additional inputs of total nitrogen and organic carbon resulting from permafrost thawing, and atmospheric N deposition.
The net N2O emission (N2Oemi) is calculated as the difference between N2O production (N2Opro) in soils and soil N2O uptake (N2Oupt) from the atmosphere (Yuan et al., 2025. Equation 1). N2O is incorporated originating from nitrification (N2ON) and denitrification (N2ODN) into the total N2O production.
The amount of N2O uptake (N2Oupt) was calculated according to Fick's law of gas diffusion (Yuan et al. 2025, Equation 3), where Cair and Csoil represent N2O concentration in air and soils, respectively.
The additional nitrogen and carbon input due to permafrost thaw depth changes were accounted for to assess the impact of permafrost thawing on N mineralization. The thawing depth is calculated monthly. Each month's thaw depth for the current year is compared to the maximum thaw depth from prior years, beginning from 1969, which always reaches its peak during summer. If the thawing depth in the current month exceeds the previous maximum thawing depth, the thawing depth difference is considered the change in thawing depth, and the total N and organic C between the two depths were added to soil C and N cycle pools. Conversely, if the thawing depth in the current month is less than the previous maximum, the carbon and nitrogen in previously thawed layers are used. The calculation of thawing depth was based on a soil thermal model, which is tested effectively against the observations. Detailed information is well documented in Liu et al. (2022) and Zhuang et al. (2001). The latest spatially explicit northern permafrost soil carbon and nitrogen dataset was utilized (Palmtag et al., 2022), which provides the vertical and horizontal distributions of organic carbon and total nitrogen stocks at depths of 0–30 cm, 30–50 cm, 50–100 cm, 100–200 cm, and 200–300 cm at 300-m pixel resolution. This dataset was resampled to 0.5° × 0.5° grid cells for model input. The maximum soil depth was set to 13 m (Tao et al., 2019; Liu et al., 2022).
For depths beyond 300 cm, it was assumed that carbon and nitrogen stocks followed the distribution in the 200-300 cm layer. Based on the mineral nitrogen to total nitrogen ratios reported by Marushchak et al. (2021) and Beermann et al. (2017), it was estimated that 98% of total nitrogen was organic, which was added to the soil organic nitrogen pool for mineralization. It was also assumed that 1.8% of total nitrogen is NH + and 0.2% is NO -, given the significantly higher NH +concentrations in permafrost than NO - (Hansen & Elberling, 2023; Marushchak et al., 2021) and allocated these proportions to the soil NH + and NO - pools accordingly.
Model Calibration and Validation
520 observations at 47 natural ecosystem sites were used from the northern high latitudes in this study. The observations were obtained through requests from authors or digitized from figures in cited publications. To facilitate meaningful comparisons, all these observations were aggregated into monthly emission data. N2O flux measurements taken over 5 months or more were selected for model calibration, while measurements from shorter campaigns were used for model validation. Model calibration was conducted using 338 (out of 520) observations from 24 sites across the northern high latitudes, including 6 wet tundra (WT)/peatland sites, 6 alpine tundra/dry tundra sites, and 12 boreal forest sites (Yuan et al., 2025, Table S1 in Supporting Information S1, Figure 2). Model validation was performed with the remaining 182 out of 520 observations from different locations or time periods, including10 alpine tundra/dry tundra sites, 7 WT/peatland sites, and 6 boreal forest sites (Yuan et al., 2025, Table S1 in Supporting Information S1, Figure 2). Data of soil density and pH were obtained from the same publications or relevant publications associated with the same site, or from the global soil bulk density map (GLOBAL SOIL DATA TASK, 2000) and Global Database of Soil Properties (Carter and Scholes, 2000). Meteorological data used as the model forcing, including monthly air temperature, water vapor pressure, precipitation, and cloudiness, were collected from the literature or the Climate Research Unit (CRU TS v. 4.05) (Harris et al., 2020).
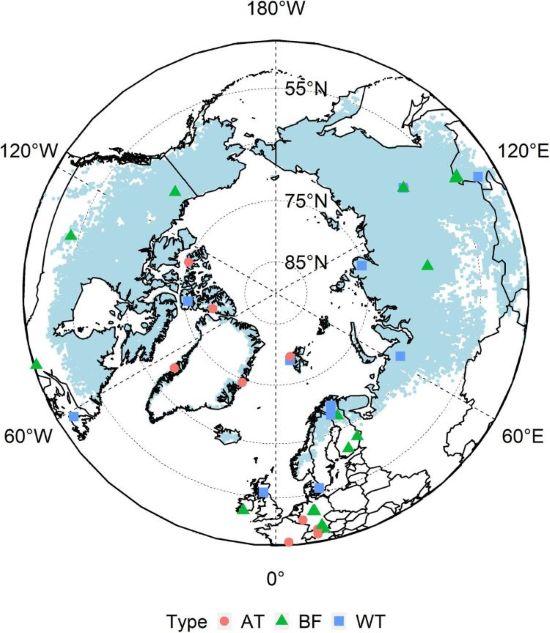
Figure 2. Locations of observation sites used in this study: 6 wet tundra (WT)/peatland sites, 6 alpine tundra/dry tundra sites (AT), and 12 boreal forest sites (BF). Four alpine tundra sites on the Tibetan Plateau, located south of 45°N, are not shown on this map. The blue area represents the permafrost region with more than 0% coverage, as estimated by Obu (2021), and is used in this study. Model validation was performed with the remaining 182 out of 520 observations from different locations or time periods, including 10 alpine tundra/dry tundra sites, 7 WT/peatland sites, and 6 boreal forest sites (image from Yuan et al, 2025).
PEST (V17.2 for Linux) was used for calibration (https://pesthomepage.org) of optimal nitrification and denitrification parameters for major natural ecosystem types in the region (Table 1 in Yuan et al., 2025). Calibration for each site was conducted individually, and each site was given the same weight. The parameters were obtained through an iterative optimization method based on the Gauss-Marquardt-Levenberg (GML) gradient search algorithm, where the parameters were adjusted to minimize the sum of squared weighted residuals between the simulated and observed N2O emissions at each site. Some observations were measured on an hourly basis and included sporadic high-emission events that were not sustained over a full month. Aggregating these hourly measurements into monthly data could therefore overestimate monthly emissions. Less weight was assigned to these high-emission events in the calibration process to minimize this but still display the raw observation data in comparison (Figure 3a in Yuan et al., 2025).
Regional Extrapolation
To obtain spatiotemporally explicit estimations of N2O emissions at the regional scale, the data of land cover, soils, and climate from various sources were used at a spatial resolution of 0.5° × 0.5° to drive TEM. Monthly climate forcing data were used including those derived from CRU TS v. 4.05 data (Harris et al., 2020) during 1969–2019. Data on soil density and pH were obtained from the global soil bulk density map (GLOBAL SOIL DATA TASK, 2000) and the Global Database of Soil Properties (Carter and Scholes, 2000). The permafrost region with coverage greater than 0%, as estimated by Obu (2021), and the northern permafrost region soil carbon and nitrogen horizontal and vertical distribution dataset from Palmtag et al. (2022) were used. These data were resampled to a 0.5° × 0.5° resolution for simulations under the permafrost thawing scenario (28,009 grid cells (0.5° × 0.5°) in the Northern high latitudes), N deposition effects were simulated during 1984-2016. The regional N deposition data from 1984 to 1986, 1994 to 1996, 2004 to 2006, and 2014 to 2016 was sourced from re-gridded model results from GEOS-Chem (Ackerman et al., 2018), with gaps between modeled years filled with the average values between two adjacent time periods. It was assumed that half of the inorganic N deposition was NH4+. The first-year climate data for model spin-up for at least 150 years was used to achieve a steady state for the state and flux variables for each grid cell. The regional extrapolation was conducted under three scenarios: base, permafrost thawing, and deposition. In the base scenario, parameter values were set to the mean, mean + SE, mean-SE, median, Q1, and Q3. Since simulations using the mean and median values closely align throughout the period (Yuan et al., 2025; Figure S1 in Supporting Information S1), only mean values were used in the permafrost thawing and deposition scenarios.
Refer to Yuan et al. (2025) for additional details.
Data Access
These data are available through the Oak Ridge National Laboratory (ORNL) Distributed Active Archive Center (DAAC).
Impacts of Permafrost Degradation on Nitrous Oxide Emissions
Contact for Data Center Access Information:
- E-mail: uso@daac.ornl.gov
- Telephone: +1 (865) 241-3952
References
Ackerman, D.E., Chen, X., and Millet, D.B. 2018. Global nitrogen deposition (2°×2.5° grid resolution) simulated with GEOS-Chem for 1984-1986, 1994-1996, 2004-2006, and 2014-2016. Data Repository for the University of Minnesota (DRUM). https://doi.org/10.13020/D6KX2R
Beermann, F., M. Langer, S. Wetterich, J. Strauss, J. Boike, C. Fiencke, L. Schirrmeister, E.-M. Pfeiffer, and L. Kutzbach. 2017. Permafrost thaw and liberation of inorganic nitrogen in eastern Siberia. Permafrost and Periglacial Processes 28:605–618. https://doi.org/10.1002/ppp.1958
Carter, A.J., and R.J. Scholes. 2000. SoilData v2.0: Generating a Global Database of soil Properties. CSIR Environmentek, Pretoria, South Africa.
GLOBAL SOIL DATA TASK. 2000. Global gridded surfaces of Selected Soil Characteristics (IGBP-DIS). ORNL Distributed Active Archive Center. https://doi.org/10.3334/ORNLDAAC/569
Hansen, H.F. E., and B. Elberling. 2023. Spatial distribution of bioavailable inorganic nitrogen from thawing permafrost. Global Biogeochemical Cycles 37:e2022GB007589. https://doi.org/10.1029/2022GB007589
Harris, I., T.J. Osborn, P. Jones, and D. Lister. 2020. Version 4 of the CRU TS monthly high-resolution gridded multivariate climate dataset. Scientific Data 7:109. https://doi.org/10.1038/s41597-020-0453-3
Liu, L., Q. Zhuang, D. Zhao, D. Zheng, D. Kou, and Y. Yang. 2022. Permafrost degradation diminishes terrestrial ecosystem carbon sequestration capacity on the Qinghai-Tibetan Plateau. Global Biogeochemical Cycles 36:e2021GB007068. https://doi.org/10.1029/2021GB007068
Marushchak, M.E., J. Kerttula, K. Diáková, A. Faguet, J. Gil, G. Grosse, C. Knoblauch, N. Lashchinskiy, P.J. Martikainen, A. Morgenstern, M. Nykamb, J.G. Ronkainen, H.M. P. Siljanen, L. van Delden, C. Voigt, N. Zimov, S. Zimov, and C. Biasi. 2021. Thawing Yedoma permafrost is a neglected nitrous oxide source. Nature Communications 12:7107. https://doi.org/10.1038/s41467-021-27386-2
McGuire, A.D., J.M. Melillo, D.W. Kicklighter, Y. Pan, X. Xiao, J. Helfrich, B. Moore, C.J. Vorosmarty, and A.L. Schloss. 1997. Equilibrium responses of global net primary production and carbon storage to doubled atmospheric carbon dioxide: Sensitivity to changes in vegetation nitrogen concentration. Global Biogeochemical Cycles 11:173–189. https://doi.org/10.1029/97GB00059
Melillo, J.M., A.D. McGuire, D.W. Kicklighter, B. Moore, C.J. Vorosmarty, and A.L. Schloss. 1993. Global climate change and terrestrial net primary production. Nature 363:234–240. https://doi.org/10.1038/363234a0
Obu, J. 2021. How much of the Earth’s surface is underlain by permafrost? Journal of Geophysical Research: Earth Surface 126:e2021JF006123. https://doi.org/10.1029/2021JF006123
Palmtag, J., J. Obu, P. Kuhry, A. Richter, M.B. Siewert, N. Weiss, S. Westermann, and G. Hugelius. 2022. A high spatial resolution soil carbon and nitrogen dataset for the northern permafrost region based on circumpolar land cover upscaling. Earth System Science Data 14:4095–4110. https://doi.org/10.5194/essd-14-4095-2022
Tao, J., R.D. Koster, R.H. Reichle, B.A. Forman, Y. Xue, R.H. Chen, and M. Moghaddam. 2019. Permafrost variability over the Northern Hemisphere based on the MERRA-2 reanalysis. The Cryosphere 13:2087–2110. https://doi.org/10.5194/tc-13-2087-2019
Yuan, Y., Q. Zhuang, B. Zhao, and N. Shurpali. 2025. Impacts of permafrost degradation on N2O emissions from natural terrestrial ecosystems in northern high latitudes: a process-based biogeochemistry model analysis. Global Biogeochemical Cycles 39:e2024GB008439. https://doi.org/10.1029/2024GB008439
Yu, T., and Q. Zhuang. 2019. Quantifying global N2O emissions from natural ecosystem soils using trait-based biogeochemistry models. Biogeosciences 16:207–222. https://doi.org/10.5194/bg-16-207-2019
Zhuang, Q., A.D. McGuire, J.M. Melillo, J.S. Clein, R.J. Dargaville, D.W. Kicklighter, R.B. Myneni, J. Dong, V.E. Romanovsky, J. Harden, and J.E. Hobbie. 2003. Carbon cycling in extratropical terrestrial ecosystems of the Northern Hemisphere during the 20th century: a modeling analysis of the influences of soil thermal dynamics. Tellus B 55:751-776. https://doi.org/10.3402/tellusb.v55i3.16368
Zhuang, Q., V.E. Romanovsky, and A.D. McGuire. 2001. Incorporation of a permafrost model into a large-scale ecosystem model: Evaluation of temporal and spatial scaling issues in simulating soil thermal dynamics. Journal of Geophysical Research: Atmospheres 106:33649-33670. https://doi.org/10.1029/2001JD900151