Documentation Revision Date: 2022-04-20
Dataset Version: 1
Summary
McGuire et al. (2016, 2018) describe the simulation inputs, protocols, and model output in detail.
The dataset includes a netCDF file defining the geographic domains covered in this study. The monthly averages appear in separate files resulting in 10,336 netCDF files from 14 models organized in 75 TAR/GZIP archives.
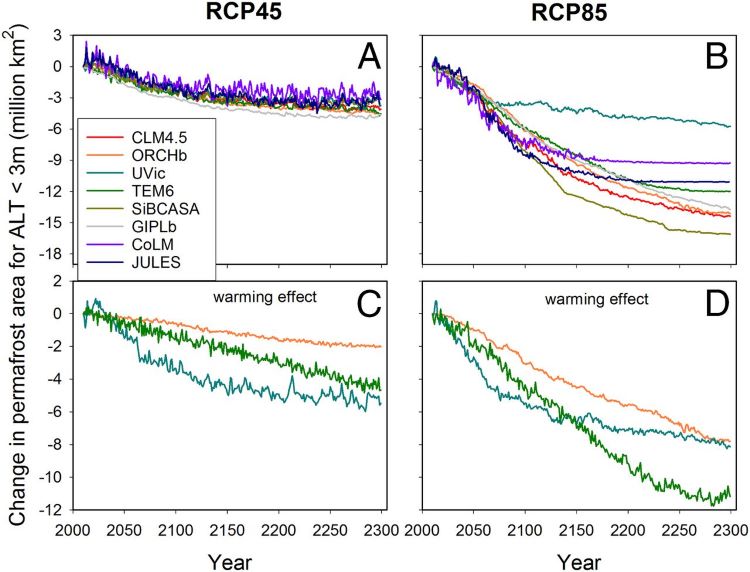
Figure 1. Changes in simulated permafrost dynamics. Simulated cumulative changes in (A and B) permafrost area for active layer thickness (ALT) less than 3 m from 2010-2299 and (C and D) the sensitivity of simulated changes in permafrost area to changes in mean annual air temperature for RCP4.5 (left column) and RCP8.5 (right column) model projections. Source: McGuire et al. (2018; Fig. 2)
Citation
McGuire, D.A., D.M. Lawrence, C.D. Koven, J.S. Clein, E. Burke, G.S. Chen, E. Jafarov, A.H. MacDougall, S. Marchenko, D.J. Nicolsky, S. Peng, A. Rinke, P. Ciais, I. Gouttevin, D.J. Hayes, D. Ji, G. Krinner, J.C. Moore, V.E. Romanovsky, C. Schädel, K. Schaefer, and Q. Zhuang. 2022. Projections of Permafrost Thaw and Carbon Release for RCP 4.5 and 8.5, 1901-2299. ORNL DAAC, Oak Ridge, Tennessee, USA. https://doi.org/10.3334/ORNLDAAC/1872
Table of Contents
- Dataset Overview
- Data Characteristics
- Application and Derivation
- Quality Assessment
- Data Acquisition, Materials, and Methods
- Data Access
- References
Dataset Overview
This dataset consists of an ensemble of model projections from 1901 to 2299 for the northern hemisphere permafrost domain. The model projections include monthly average values for a common set of diagnostic outputs at a spatial resolution of 0.5 x 0.5 degrees latitude and longitude. The model simulations resulted from a synthesis effort organized by the Permafrost Carbon Network to evaluate the impacts of climate change on the carbon cycle in permafrost regions in the high northern latitudes. The model teams used different historical input weather data, but most used driver data developed by the Climate Research Unit - National Centers for Environmental Prediction (CRUNCEP) as modified for the Multiscale Terrestrial Model Intercomparison Project (MsTMIP). The teams scaled the driver data for the projections using output from global climate models from the fifth Coupled Model Intercomparison Project (CMIP5). The synthesis evaluated the terrestrial carbon cycle in the modern era and projected future emissions of carbon under two climate warming scenarios: Representative Concentration Pathways 4.5 and 8.5 (RCP45 and RCP85) from CMIP5. RCP45 represents emissions resulting in a global climate close to the target climate in the Paris Accord. RCP85 represents unconstrained greenhouse gas emissions. McGuire et al. (2016, 2018) describe the simulation inputs, protocols, and model output in detail.
Project: Arctic-Boreal Vulnerability Experiment
The Arctic-Boreal Vulnerability Experiment (ABoVE) is a NASA Terrestrial Ecology Program field campaign being conducted in Alaska and western Canada, for 8 to 10 years, starting in 2015. Research for ABoVE links field-based, process-level studies with geospatial data products derived from airborne and satellite sensors, providing a foundation for improving the analysis, and modeling capabilities needed to understand and predict ecosystem responses to, and societal implications of, climate change in the Arctic and Boreal regions.
Related Publications
Huntzinger, DN; Schwalm, C; Michalak, AM; Schaefer, K; King, AW; Wei, Y; Jacobson, A; Liu, S; Cook, RB; Post, WM; Berthier, G; Hayes, D; Huang, M; Ito, A; Lei, H; Lu, C; Mao, J; Peng, CH; Peng, S; Poulter, B; Riccuito, D; Shi, X; Tian, H; Wang, W; Zeng, N; Zhao, F; Zhu, Q (2013), The North American Carbon Program Multi-Scale Synthesis and Terrestrial Model Intercomparison Project - Part 1: Overview and experimental design, Geoscientific Model Devel., 6(6), Pages: 2121-2133. https://doi.org/10.5194/gmd-6-2121-2013
McGuire, A.D., C. Koven, D.M. Lawrence, J.S. Clein, J. Xia, C. Beer, E. Burke, G. Chen, X. Chen, C. Delire, E. Jafarov, A.H. MacDougall, S. Marchenko, D. Nicolsky, S. Peng, A. Rinke, K. Saito, W. Zhang, R. Alkama, T.J. Bohn, P. Ciais, B. Decharme, A. Ekici, I. Gouttevin, T. Hajima, D.J. Hayes, D. Ji, G. Krinner, D.P. Lettenmaier, Y. Luo, P.A. Miller, J.C. Moore, V. Romanovsky, C. Schädel, K. Schaefer, E.A.G. Schuur, B. Smith, T. Sueyoshi, and Q. Zhuang. 2016. Variability in the sensitivity among model simulations of permafrost and carbon dynamics in the permafrost region between 1960 and 2009. Global Biogeochemical Cycles 30:1015-1037. https://doi.org/10.1002/2016GB005405.
McGuire, A.D., D.M. Lawrence, C. Koven, C. Koven, J.S. Clein, E. Burke, G. Chen, E. Jafarov, A.H. MacDougall, S. Marchenko, D. Nicolsky, S. Peng, A. Rinke, P. Ciais, I. Gouttevin, D.J. Hayes, D. Ji, G. Krinner, J.C. Moore, V. Romanovsky, C. Schädel, K. Schaefer, E.A.G. Schuur, and Q. Zhuang. 2018. Dependence of the evolution of carbon dynamics in the northern permafrost region on the trajectory of climate change. PNAS 115:3882-3887. https://doi.org/10.1073/pnas.1719903115.
Peng, S., P. Ciais, G. Krinner, T. Wang, I. Gouttevin, A. D. McGuire, D. Lawrence, E. Burke, X. Chen, B. Decharme, C. Koven, A. MacDougall, A. Rinke, K. Saito, W. Zhang, R. Alkama, T. J. Bohn, C. Delire, T. Hajima, D. Ji, D. P. Lettenmaier, P. A. Miller, J. C. Moore, B. Smith, and T. Sueyoshi. 2016. Simulated high-latitude soil thermal dynamics during the past 4 decades. The Cryosphere 10:179–192. https://doi.org/10.5194/tc-10-179-2016.
Wei, Y, S Liu, DN Huntzinger, AM Michalak, N Viovy, WM Post, CR Schwalm, K Schaefer, AR Jacobson, C Lu, H Tian, DM Ricciuto, RB Cook, J Mao, and X Shi (2014), The North American Carbon Program Multi-scale Synthesis and Terrestrial Model Intercomparison Project – Part 2: Environmental driver data, Geosci. Model Dev., 7, 2875–2893. https://doi.org/10.5194/gmd-7-2875-2014.
Related Datasets
Fisher, J.B. 2019. ABoVE: Multi-model Uncertainty of Carbon Stocks and Fluxes across ABoVE Domain, 2003. ORNL DAAC, Oak Ridge, Tennessee, USA. https://doi.org/10.3334/ORNLDAAC/1652
Huntzinger, D.N., C.R. Schwalm, Y. Wei, R.B. Cook, A.M. Michalak, K. Schaefer, A.R. Jacobson, M.A. Arain, P. Ciais, J.B. Fisher, D.J. Hayes, M. Huang, S. Huang, A. Ito, A.K. Jain, H. Lei, C. Lu, F. Maignan, J. Mao, N.C. Parazoo, C. Peng, S. Peng, B. Poulter, D.M. Ricciuto, H. Tian, X. Shi, W. Wang, N. Zeng, F. Zhao, Q. Zhu, J. Yang, and B. Tao. 2018. NACP MsTMIP: Global 0.5-degree Model Outputs in Standard Format, Version 1.0. ORNL DAAC, Oak Ridge, Tennessee, USA. https://doi.org/10.3334/ORNLDAAC/1225.
Minions, C., S. Natali, J.D. Watts, S. Ludwig, and D. Risk. 2019. ABoVE: Year-Round Soil CO2 Efflux in Alaskan Ecosystems, Version 2. ORNL DAAC, Oak Ridge, Tennessee, USA. https://doi.org/10.3334/ORNLDAAC/1762.
Wei, Y., Shishi Liu, D.N. Huntzinger, A.M. Michalak, N. Viovy, W.M. Post, C.R. Schwalm, K. Schaefer, A.R. Jacobson, C. Lu, H. Tian, D.M. Ricciuto, R.B. Cook, J. Mao, and X. Shi. 2014. NACP MsTMIP: Global and North American Driver Data for Multi-Model Intercomparison. ORNL DAAC, Oak Ridge, Tennessee, USA. https://doi.org/10.3334/ORNLDAAC/1220
Acknowledgments
This project received financial support from NASA's Terrestrial Ecology (grants: NNX13AM25G, NNX14A154G, NNX16AH36A, NNX17AC59A, NNX10AR63G, NNX11A008A, NNX11AJ35G, NNX11AR16G, JPL-1717544) and Land-Cover Land-Use Change (NNX14AD90G) programs.
Data Characteristics
Spatial Coverage: Permafrost regions of the Northern Hemisphere; entire ABoVE domain
Spatial Resolution: 0.5 degrees
Temporal Coverage: 1901-01-01 to 2300-12-31
Temporal Resolution: monthly
Study Area: Latitude and longitude are given in decimal degrees.
| Site | Westernmost Longitude | Easternmost Longitude | Northernmost Latitude | Southernmost Latitude |
|---|---|---|---|---|
| Global | -180 | 180 | 90 | -90 |
User Note: Most data granules have a circumpolar spatial coverage in the Northern Hemisphere between 25–90 degrees latitude, but some extend coverage into the Southern Hemisphere
Data File Information
There are 10,336 data files in netCDF (*.nc4) format included in this dataset. The models and associated simulation experiments are organized into 75 compressed archives. Also included are two companion files, one compressed archive that contains files in text (*.txt) format and one file in Portable Document Format (*.pdf).
The archives are named Raaa_bbbb.tar.gz, where aaaa is the simulation experiment name and bbbb is the model name. For example, the archive named R01_CABLE.tar.gz contains data files for the CABLE model output used to run the R01 simulation experiment.
Table 1. File names and descriptions.
| File Name | Description |
|---|---|
| Data Files | |
| Raaa_bbbb.tar.gz | files for a single model and simulation experiment; there is an archive for each combination of model and simulation experiment (Table 1) |
| Domain_0.5x0.5.nc4 | the geographic domains covered in this study |
| Companion Files | |
| readme_models.zip | a set of text files describing configurations of selected models |
| PermafrostThaw_CarbonEmissions.pdf | a PDF copy of this user guide |
Data File Details
The data files contain variables measuring atmosphere CO2 concentration, downwelling longwave radiation, downwelling shortwave radiation, precipitation, surface air absolute humidity, surface air pressure, surface air temperature, surface wind speed, absorbed fraction of PAR, latent heat flux, longwave albedo, longwave net flux, sensible heat flux, shortwave albedo, shortwave net flux, vegetation temperature, autotrophic respiration, dissolved organic carbon flux, fire carbon flux, gross primary productivity, ground carbon flux, heterotrophic respiration, methane flux, net ecosystem exchange, net primary productivity, total respiration, aboveground biomass, carbon pools, total live biomass, total soil carbon, soil moisture, soil saturation fraction, soil temperature, evaporation, snow density, snow depth, snowfall rate, snow water equivalent, subsurface runoff, surface runoff. Units are included in variable attributes.
Table 2. Models and simulation experiments included in this dataset. There is a separate archive for each combination of model and simulation experiment (Table 2). McGuire et al. (2016) provides detailed of these models and supporting references.
| Model | Number of Files | Simulation Experiments | |||||||||||||
|---|---|---|---|---|---|---|---|---|---|---|---|---|---|---|---|
| R01 | R02 | R03 | R04 | R05 | R06 | R2010 | R2011 | R2012 | R2013 | R2020 | R2021 | R2022 | R2023 | ||
| CABLE | 49 | x | |||||||||||||
| CLM45 | 772 | x | x | x | x | x | x | ||||||||
| CoLM | 634 | x | x | x | |||||||||||
| ISBA | 193 | x | x | x | x | ||||||||||
| JULES | 1386 | x | x | x | x | x | x | x | x | x | x | x | x | ||
| LPJ_GUESS | 880 | x | x | x | x | x | x | ||||||||
| MIROCESM | 50 | x | |||||||||||||
| ORCHIDEE-MICT | 112 | x | |||||||||||||
| ORCHIDEEv1 | 2633 | x | x | x | x | x | x | x | x | x | x | x | x | x | x |
| ORCHIDEEv2 | 306 | x | x | x | x | x | x | ||||||||
| SIBCASA | 62 | x | x | x | |||||||||||
| TEM604 | 680 | x | x | ||||||||||||
| UVic | 2520 | x | x | x | x | x | x | x | x | x | x | x | x | ||
| UW-VIC a | 58 | x | x | x | |||||||||||
| Domain_0.5x0.5 b | 1 | ||||||||||||||
| Total | 10,336 | ||||||||||||||
a In addtion to files named R*_UW-VIC.tar.gz, soil temperature simulations for R01–R04 are in the file R01-R04-SoilTemp_UW-VIC.tar.gz.
b Single file holding the spatial distribution of permafrost domains.
Table 3. Simulation experiments included in this dataset.
| Abbreviation | Name | Description | Publication |
|---|---|---|---|
| R01 | Reference Run | A simulation for 1960–2009 with variability in all temporal drivers. | McGuire et al. (2016) |
| R02 | Constant Temp | A simulation driven by detrended temperature for 1960–2009 with all other temporal driving datasets unaltered. | McGuire et al. (2016) |
| R03 | Constant CO2 | A simulation driven by constant CO2 for 1960–2009 (using 1960 level of CO2) with all other temporal driving datasets unaltered. | McGuire et al. (2016) |
| R04 | Constant Temp & Precip | A simulation driven by detrended temperature and detrended precipitation for 1960–2009 with all other temporal driving datasets unaltered. | McGuire et al. (2016) |
| R05 | Constant Temp & Long Wave | A simulation driven by detrended temperature and detrended long wave radiation for 1960–2009 with all other driving datasets unaltered. | Peng et al. (2016) |
| R06 | Constant Temp, Precip & Long Wave | A simulation driven by detrended temperature, detrended precipitation, and detrended long wave radiation for 1960–2009 with all other driving datasets unaltered. | Peng et al. (2016) |
| R2010 | RCP 4.5 | A best estimate simulation for 1960–2299 with variable CO2, climate, land use, etc. from CCSM4 anomalies for the RCP 4.5 scenario. | McGuire et al. (2018) |
| R2011 | RCP 4.5 Constant Temp | A simulation based on the RCP 4.5 projections but driven by detrended temperature (and detrended long wave radiation if necessary) for 1960–2299 with all other driving datasets unaltered. | McGuire et al. (2018) |
| R2012 | RCP 4.5 Constant CO2 | A simulation based on the RCP 4.5 projections but driven by constant CO2 for 1960–2299 (using 1960 level of CO2) with all other driving datasets unaltered. | McGuire et al. (2018) |
| R2013 | RCP 4.5 Constant Temp & Precip | A simulation based on the RCP 4.5 projections but driven by detrended temperature and precipitation (and detrended long wave radiation if necessary) for 1960–2299 with all other driving datasets unaltered. | McGuire et al. (2018) |
| R2020 | RCP 8.5 | A best estimate simulation for 1960–2299 with variable CO2, climate, land use, etc. from CCSM4 anomalies for the RCP 8.5 scenario. | McGuire et al. (2018) |
| R2021 | RCP 8.5 Constant Temp | A simulation based on the RCP 8.5 projections but driven by detrended temperature (and detrended long wave radiation if necessary) for 1960–2299 with all other driving datasets unaltered. | McGuire et al. (2018) |
| R2022 | RCP 8.5 Constant CO2 | A simulation based on the RCP 8.5 projections but driven by constant CO2 for 1960–2299 (using 1960 level of CO2) with all other driving datasets unaltered. | McGuire et al. (2018) |
| R2023 | RCP 8.5 Constant Temp & Precip | A simulation based on the RCP 8.5 projections but driven by detrended temperature and precipitation (and detrended long wave radiation if necessary) for 1960–2299 with all other driving datasets unaltered. | McGuire et al. (2018) |
Application and Derivation
Regional and global-scale biogeochemical models that coupled thaw depth with soil carbon exposure evaluate the influence of climate change on future carbon storage in the northern permafrost region. Results indicate the northern permafrost region could act as a net sink for carbon under aggressive climate mitigation pathways. Under less aggressive pathways, the region would likely act as a source of soil carbon to the atmosphere, with substantial losses not after 2100. These results suggest that effective mitigation efforts during the remainder of this century could attenuate the negative consequences of the permafrost carbon–climate feedback (McGuire et al. 2018).
Quality Assessment
Sensitivity analyses for simulation experiments identify important drivers of carbon fluxes and compare the models. McGuire et al. (2016) examined predicted of loss of permafrost due to warming climate and found large differences in the predictions of various models. These authors recommended simulations of permafrost and carbon fluxes use a standardized structure across land-surface models.
McGuire et al. (2018) found both net primary production (NPP) and heterotrophic respiration (HR) were highly sensitive to atmospheric temperatures but not precipitation. Decomposition of soil organic matter, the greatest component of HR, increased with temperature but less so for temperature increases above 8.5 degrees C. Moreover, these sensitivities varied among models.
Peng et al. (2016) focused on the dynamics of permafrost soil temperature, examining variation among related to model structure and the choice of input parameters values. The authors found little correlation between atmospheric and soil temperatures across models. Long-wave solar radiation had greater effects than short-wave downward radiation.
Data Acquisition, Materials, and Methods
The model simulations resulted from a synthesis effort organized by the Permafrost Carbon Network to evaluate the impacts of climate change on the carbon cycle in permafrost regions in the high northern latitudes. The synthesis evaluated the terrestrial carbon cycle in the modern era and projected future emissions of carbon under two climate warming scenarios: Representative Concentration Pathways 4.5 and 8.5 (RCP45 and RCP85) from the Fifth Coupled Model Intercomparison Project (CMIP5) (Taylor et al. 2012). RCP45 represents emissions resulting in a global climate close to the target climate in the Paris Accord. RCP85 represents unconstrained greenhouse gas emissions.
The simulation experiments emphasized carbon dynamics and soil thermodynamics. The spatial domain was the Northern Hemisphere permafrost land region, including boreal regions of North America, Europe, Asia as well as the high mountainous regions of these continents (Brown et al. 2002, Zhang et al. 2008). The target temporal coverage was 1960 to 2300, but the date ranges vary among simulation experiments and models. Simulation protocols included a spin-up period to resolve artifacts of initial conditions prior to starting the simulation run.
McGuire et al. (2016, 2018) and Peng et al. (2016) describe the models, simulation inputs, simulation protocols, and model output in detail.
Data Access
These data are available through the Oak Ridge National Laboratory (ORNL) Distributed Active Archive Center (DAAC).
Projections of Permafrost Thaw and Carbon Release for RCP 4.5 and 8.5, 1901-2299
Contact for Data Center Access Information:
- E-mail: uso@daac.ornl.gov
- Telephone: +1 (865) 241-3952
References
Brown, J., O. Ferrians, J.A. Heginbottom, and E. Melnikov. 2002. Circum-Arctic Map of Permafrost and Ground-Ice Conditions, Version 2. Boulder, Colorado USA. NSIDC: National Snow and Ice Data Center. https://doi.org/10.7265/skbg-kf16.
Huntzinger, D.N., C. Schwalm, A.M. Michalak, K. Schaefer, A.W. King, Y. Wei, A. Jacobson, S. Liu, R.B. Cook, W.M. Post, G. Berthier, D. Hayes, M. Huang, A. Ito, H. Lei, C. Lu, J. Mao, C.H. Peng, S. Peng, B. Poulter, D. Riccuito, X. Shi, H. Tian, W. Wang, N. Zeng, F. Zhao, and Q. Zhu. 2013. The North American Carbon Program Multi-Scale Synthesis and Terrestrial Model Intercomparison Project – Part 1: Overview and experimental design, Geoscientific Model Development 6:2121–2133. https://doi.org/10.5194/gmd-6-2121-2013.
McGuire, A.D., C. Koven, D.M. Lawrence, J.S. Clein, J. Xia, C. Beer, E. Burke, G. Chen, X. Chen, C. Delire, E. Jafarov, A.H. MacDougall, S. Marchenko, D. Nicolsky, S. Peng, A. Rinke, K. Saito, W. Zhang, R. Alkama, T.J. Bohn, P. Ciais, B. Decharme, A. Ekici, I. Gouttevin, T. Hajima, D.J. Hayes, D. Ji, G. Krinner, D.P. Lettenmaier, Y. Luo, P.A. Miller, J.C. Moore, V. Romanovsky, C. Schädel, K. Schaefer, E.A.G. Schuur, B. Smith, T. Sueyoshi, and Q. Zhuang. 2016. Variability in the sensitivity among model simulations of permafrost and carbon dynamics in the permafrost region between 1960 and 2009. Global Biogeochemical Cycles 30:1015-1037. http://doi.org/10.1002/2016GB005405.
McGuire, A.D., D.M. Lawrence, C. Koven, C. Koven, J.S. Clein, E. Burke, G. Chen, E. Jafarov, A.H. MacDougall, S. Marchenko, D. Nicolsky, S. Peng, A. Rinke, P. Ciais, I. Gouttevin, D.J. Hayes, D. Ji, G. Krinner, J.C. Moore, V. Romanovsky, C. Schädel, K. Schaefer, E.A.G. Schuur, and Q. Zhuang. 2018. Dependence of the evolution of carbon dynamics in the northern permafrost region on the trajectory of climate change. PNAS 115:3882-3887. http://doi.org/10.1073/pnas.1719903115.
Peng, S., P. Ciais, G. Krinner, T. Wang, I. Gouttevin, A. D. McGuire, D. Lawrence, E. Burke, X. Chen, B. Decharme, C. Koven, A. MacDougall, A. Rinke, K. Saito, W. Zhang, R. Alkama, T. J. Bohn, C. Delire, T. Hajima, D. Ji, D. P. Lettenmaier, P. A. Miller, J. C. Moore, B. Smith, and T. Sueyoshi. 2016. Simulated high-latitude soil thermal dynamics during the past 4 decades. The Cryosphere 10:179–192. https://doi.org/10.5194/tc-10-179-2016.
Taylor, K.E., R.J. Stouffer, and G.A. Meehl. 2012. An overview of CMIP5 and the experiment design. Bulletin of the American Meteorological Society 93:485-498. https://doi.org/10.1175/BAMS-D-11-00094.1.
Zhang, T., R.G. Barry, K. Knowles, J.A. Heginbottom, and J. Brown. 2008. Statistics and characteristics of permafrost and ground-ice distribution in the Northern Hemisphere. Polar Geography 31:47-68. https://doi.org/10.1080/10889370802175895.