Documentation Revision Date: 2026-02-05
Dataset Version: 1
Summary
This dataset includes 14 data files: ten in comma-separated values format (*.csv), three in cloud-optimized GeoTIFF (*.tif) format, and JPEG images in one compressed (*.zip) file.
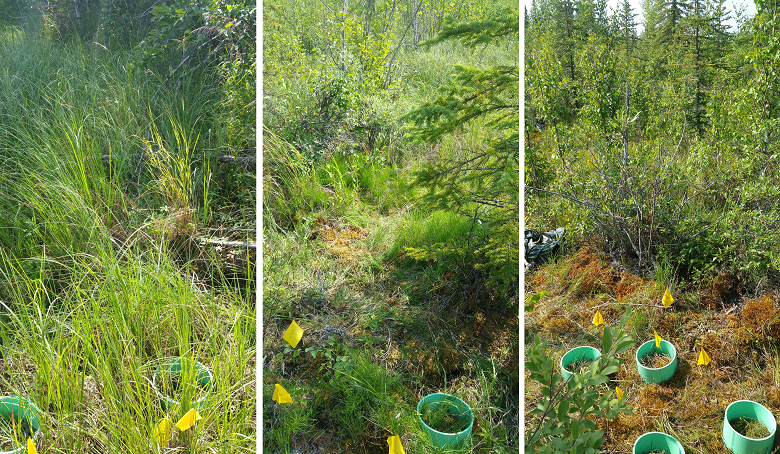
Figure 1. Examples of flux sample locations across the study area. Photographs are included in the dataset, and are from site 2 ("20210715_160144_west_facing.jpg"), site 3 ("20210716_133333_east_facing.jpg"), and site 4 ("20210716_134946_west_facing.jpg").
Citation
Farina, M.K., W. Christian, J.D. Watts, T. Mcdermott, R. Hatzenpichler, G. Larue, S. Powell, H. Webb, N. Barnes, and K. Okano. 2026. ABoVE: Land Cover, Methane Flux, and Environmental Data, Big Trail Lake, Fairbanks AK. ORNL DAAC, Oak Ridge, Tennessee, USA. https://doi.org/10.3334/ORNLDAAC/2393
Table of Contents
- Dataset Overview
- Data Characteristics
- Application and Derivation
- Quality Assessment
- Data Acquisition, Materials, and Methods
- Data Access
- References
Dataset Overview
This dataset provides field data and gridded land cover and terrain data for an area north of Big Trail Lake, an active thermokarst lake in Goldstream Valley (near Fairbanks, Alaska, USA). Field samples were collected at 56 locations across the study area in June 2021 and August 2022. Field data include chamber-based methane (CH4) and carbon dioxide (CO2) flux, soil moisture, soil temperature, soil pH, vegetation communities, meteorological data, and soil samples. The soil samples were used to conduct SIMPER microbial community analysis and soil chemical analyses and to quantify methanogen and methanotroph relative abundance. Land cover classifications (10 cm spatial resolution) were derived from supervised random forest classifications using RedEdge-MX and multiSPEC-4C multispectral drone imagery, normalized difference vegetation index (NDVI), and USGS 3D Elevation Program (3DEP) digital surface model (DSM) data. RedEdge-MX drone imagery was collected in July 2021 and multiSPEC-4C drone imagery was collected in August 2019. Gridded microtopography and slope estimates were derived at 1 m spatial resolution using USGS 3DEP digital terrain model (DTM) data.
Project: Arctic-Boreal Vulnerability Experiment (ABoVE)
The Arctic-Boreal Vulnerability Experiment (ABoVE) is a NASA Terrestrial Ecology Program field campaign being conducted in Alaska and western Canada, for 8 to 10 years, starting in 2015. Research for ABoVE links field-based, process-level studies with geospatial data products derived from airborne and satellite sensors, providing a foundation for improving the analysis, and modeling capabilities needed to understand and predict ecosystem responses to, and societal implications of, climate change in the Arctic and Boreal regions.
Related Publication:
Farina, M., W. Christian, N. Hasson, T. McDermott, S. Powell, R. Hatzenpichler, H. Webb, G. LaRue, K. Okano, E. Sproles, and J. Watts. 2025. Methane emission hotspots in a boreal forest-fen mosaic potentially linked to deep taliks. Environmental Research Letters 20:104029. https://doi.org/10.1088/1748-9326/adff9a
Related Data:
Barnes, N., H. Webb, M.K. Farina, S. Powell, and J.D. Watts. 2021. Multispectral Imagery, NDVI, and Terrain Models, Big Trail Lake, Fairbanks, AK, 2019. ORNL DAAC, Oak Ridge, Tennessee, USA. https://doi.org/10.3334/ORNLDAAC/1834
- The multiSPEC4C imagery and NDVI data used to produce the land cover classification.
Data Characteristics
Spatial Coverage: Goldstream Valley near Fairbanks, Alaska, US
Spatial Resolution:
- DTM_DSM_Microtopography_Slope_1m.tif: 1 m
- Land_Classification_Inputs_10cm.tif and Land_Classification_Outputs_10cm.tif: 10 cm
- Field samples: point locations
Temporal Coverage: 2017-05-28 to 2022-08-23
Temporal Resolution: Flux samples were collected 1-2 times during the July 2021 and August 2022 field surveys. Drone imagery was collected twice, on 2019-08-04 (multiSPEC-4C) and in July 2021 (RedEdge-MX). Meteorological variables were collected hourly from 2021-07-07 to 2021-07-27. Six soil loggers collected soil temperature data half-hourly from 2021-07-10 to 2021-07-28.
Study Areas: Latitude and longitude are given in decimal degrees.
| Site | Westernmost Longitude | Easternmost Longitude | Northernmost Latitude | Southernmost Latitude |
|---|---|---|---|---|
| Goldstream Valley, Alaska, US | -147.82 | -147.82 | 64.92 | 64.92 |
Data File Information
This dataset includes 14 data files: ten in comma-separated values format (*.csv), three in cloud-optimized GeoTIFF (*.tif) format, and JPEG images in one compressed (*.zip) file.
Missing numeric data are indicated by -9999 and missing text data are represented by N/A.
GeoTIFF Files
This dataset contains three cloud-optimized GeoTIFF (*.tif) files:
- DTM_DSM_Microtopography_Slope_1m.tif contains four bands of lidar-derived or estimated elevation characteristics over the study area at one meter resolution. Projection: UTM zone 6N (EPSG: 32606). Map units: meters.
- Band 1 (USGS_3DEP_2017_Fairbanks_Lidar_DTM_aggregated): Digital terrain model (DTM) showing the orthometric elevation of the underlying terrain of the earth’s surface in meters. Data are from USGS 3DEP DTM (USGS, 2017). DTM data were aggregated from 0.5 m resolution to 1 m resolution using bilinear resampling.
- Band 2 (USGS_3DEP_2017_Fairbanks_Lidar_DSM_aggregated): Digital surface model (DSM) showing orthometric elevation values of landscape features on the earth's surface in meters. Data are from USGS 3DEP DSM (USGS, 2017). DSM data were aggregated from 0.5 m resolution to 1 m resolution using bilinear resampling.
- Band 3 (Microtopography_meters): Gridded estimates of microtopography (vertical units of meters), derived from USGS 3DEP DTM data.
- Band 4 (Slope_8pixel_neighborhood_degrees): Gridded estimates of slope (degrees) calculated from USGS 3DEP DTM data using 8-pixel neighborhoods.
- Land_Classification_Inputs_10cm.tif contains 12 bands of land classification inputs used to produce land cover gridded outputs (Land_Classification_Outputs_10cm.tif) at 10 cm resolution. Projection: WGS 84 (EPSG: 4326). Map units: decimal degrees
- Band 1 (Blue_REMX): Blue band from drone RedEdge-MX sensor.
- Band 2 (Green_REMX): Green band from drone RedEdge-MX sensor.
- Band 3 (Red_REMX): Red band from drone RedEdge-MX sensor.
- Band 4 (RedEdge_REMX): Red-edge band from drone RedEdge-MX sensor.
- Band 5 (NIR_REMX): Near-infrared (NIR) band from drone RedEdge-MX sensor.
- Band 6 (DSM_REMX): Digital surface model (DSM; ellipsoidal elevation in meters) from drone RedEdge-MX sensor.
- Band 7 (Green_MS4C): Green band from drone multiSPEC-4C sensor (resampled to match pixel grid of RedEdge-MX imagery).
- Band 8 (Red_MS4C): Red band from drone multiSPEC-4C sensor (resampled to match pixel grid of RedEdge-MX imagery).
- Band 9 (NIR_MS4C): Near-infrared (NIR) band from drone multiSPEC-4C sensor (resampled to match pixel grid of RedEdge-MX imagery).
- Band 10 (DSM_MS4C): Digital surface model (DSM; orthometric elevation in meters) from drone multiSPEC-4C sensor (resampled to match pixel grid of RedEdge-MX imagery).
- Band 11 (DTM_MS4C): Digital terrain model (DTM; orthometric elevation in meters) from drone multiSPEC-4C sensor (resampled to match pixel grid of RedEdge-MX imagery).
- Band 12 (USGS_3DEP_DSM_resampled): USGS 3DEP digital surface model (DSM; orthometric elevation in meters), resampled to match pixel grid of RedEdge-MX imagery.
- Land_Classification_Outputs_10cm.tif contains three bands of land cover classifications derived using supervised random forest classification at 10 cm resolution. Land cover classifications are represented by integer values where 1=Graminoid; 2=Moss; 3=Shadow; 4=Water; and 5=Woody. Projection: WGS 84 (EPSG: 4326). Map units: decimal degrees.
- Band 1 (Combined_landcover_prediction): The combined land cover classification from the models using RedEdgeMX and multiSPEC4C multispectral drone imagery.
- Band 2 (Predicted_landcover_using_RedEdgeMX_imagery): Land cover classification based on RedEdge-MX multispectral drone imagery.
- Band 3 (Predicted_landcover_using_multiSPEC4C_imagery): Land cover classification based on multiSPEC-4C multispectral drone imagery.
CSV Files
This dataset contains 10 comma-separated values (CSV) files:
- Table_1_Chamber_Fluxes_Insitu_Data_July_2021.csv: In situ observations from the July 2021 field survey for 56 unique sample locations, including mean CH4 flux (collected using a LI-COR Smart Chamber), soil moisture, soil temperature, soil pH, air temperature, and vegetation class. Table 1 also includes modeled microtopography and slope for each sample location, derived from USGS 3DEP DTM data. Flux estimates were adjusted based on the percentage of chamber headspace volume filled by vegetation, which was estimated using visual assessment.
- Table_2_Detailed_Chamber_Flux_Estimates_July_2021_August_2022.csv: Contains more detailed information on the chamber-based methane (CH4) and carbon dioxide (CO2) flux estimates (including GPP estimates) from field surveys conducted in July 2021 and August 2022. Table 2 reports flux estimates from individual replicates, whereas Table 1 reports the mean CH4 flux per sample location. Table 2 also reports the percentage of chamber headspace volume filled by vegetation (visually estimated), the original flux estimates, and the adjusted flux estimates after accounting for the vegetation volume.
- Table_3_Methanogen_Methanotroph_Relative_Abundance.csv: Relative abundance observations of methanogens and methanotrophs at for four soil depths (0-12.5 cm, 12.5-25 cm, 25-37.5 cm, 37.5 - 50 cm).
- Table_4_Soil_Sample_Chemical_Analysis.csv: Contains soil chemical analyses that were conducted on soil samples from 17 locations at various depths.
- Table_5_Simper_Microbial_Community_Analysis.csv: SIMPER microbial community analysis results for each amplicon sequence variant (ASV). SIMPER analysis was used to determine which ASVs contribute to compositional differences between the microbial communities from sites in the intermediate CH4 flux category and microbial communities from sites in the other CH4 flux categories (i.e., negative, low, high, and very high CH4 flux categories).
- Table_6_Qiime2_taxonomy_output.csv: The raw output from Qiime2 which includes the total number of reads assigned to each ASV in each sample. The header rows of the file are structured such that row 1 contains the Sample_ID, row 2 contains the sample depth in cm (depth_cm), row 3 is blank, and row 4 contains the soil sample ID number (#OTU ID). In the subsequent rows, column 1 contains a description of the operational taxonomic unit (OTU), and the other columns contain the total count of reads assigned to each ASV in each soil sample.
- Table_7_Hourly_Meteorology_Weather_Sensor.csv: Meteorology data from weather station at hourly resolution from 2021-07-07 to 2021-07-27. The weather station was located at 64.91984738, -147.81891737, at a height of 3 m.
- Table_8_Halfhourly_Soil_Temperature_Logger_Data.csv: Contains soil temperature data at half-hourly resolution 2021-07-10 to 2021-07-28.
- Table_9_Training_Testing_Data_RedEdgeMX_Classification.csv: Training and testing datasets used to calibrate and validate the supervised random forest land cover classification based on RedEdge-MX multispectral drone imagery.
- Table_10_Training_Testing_Data_multiSPEC4C_Classification.csv: Training and testing data used to calibrate and validate the supervised random forest land cover classification based on RedEdge-MX multispectral drone imagery.
Table 1. Data dictionary for Table_1_Chamber_Fluxes_Insitu_Data_July_2021.csv
| Variable | Units | Description |
|---|---|---|
| Sample_ID | - | Sample location ID (56 unique IDs) |
| Site_ID | - | Site ID (15 unique IDs) |
| Latitude | degrees north | Sample location latitude in decimal degrees |
| Longitude | degrees east | Sample location longitude in decimal degrees |
| Vegetation_class | - | Vegetation class of sample: 1. Moss, sedge, field horsetail; 2. Sedge, grass, moss; 3. Moss, field horsetail, grass, sedge; 4. Variegated horsetail, moss, sedge; 5. Grass, sedge, moss; 6. Field horsetail, moss, grass, sedge; 7. Moss, field horsetail; 8. Dwarf shrub, moss, field horsetail, grass, sedge; 9. Moss. |
| Vegetation_details | Vegetation details at individual sample locations. | |
| Mean_CH4_flux | mg m-2 d-1 | Mean CH4 flux across three repetitions |
| CH4_flux_category | - | CH4 flux category (VH=Very High; High=High; Int=Intermediate; Low=Low; Neg=Negative) |
| VWC_6cm |
percent |
Soil volumetric water content at 6 cm depth |
| VWC_12cm | percent | Soil volumetric water content at 12 cm depth |
| VWC_20cm | percent | Soil volumetric water content at 20 cm depth |
| SoilT_5cm | degrees C | Soil temperature at 5 cm depth |
| SoilT_10cm | degrees C | Soil temperature at 10 cm depth |
| Soil_pH_3cm | - | Soil pH at 2.5 cm depth |
| Soil_pH_6cm | - | Soil pH at 6.4 cm depth |
| AirT_3m | degrees C | Air temperature from weather station (3m height) |
| Microtopography | m | Modeled mircotopography at sample location |
| Local_slope | degrees | Local slope at sample location |
| HydroSenseII_Period_microsec_6cmDepth | microseconds | Sampling period increment for the HydroSense II soil moisture probe at 6 cm depth |
| HydroSenseII_Period_microsec_12cmDepth | microseconds | Sampling period increment for the HydroSense II soil moisture probe at 12 cm depth |
| HydroSenseII_Period_microsec_20cmDepth | microseconds | Sampling period increment for the HydroSense II soil moisture probe at 20 cm depth |
Table 2. Data dictionary for Table_2_Detailed_Chamber_Flux_Estimates_July_2021_August_2022.csv
| Variable | Units | Description |
|---|---|---|
| Sample_ID | - | ID of sample location (56 unique sample locations). An asterisk (*) indicates flux samples that were collected during August 2022 in exactly the same locations as the July 2021 samples. Double asterisks (**) indicates flux samples that were collected during August 2022 in approximately the same locations as the July 2021 samples. |
| Chamber | - | LI-COR 8200-01S Smart Chamber (SC); Polycarbonate chamber with opaque cover (PC_cover); Polycarbonate chamber without opaque cover (PC_no_cover) |
| Rep | 1 | Repetition (1-3) |
| Date | YYYY-MM-DD | Date of flux sampling. |
| Time_AKDT | hh:mm:ss | Time of flux sampling (Alaska Daylight Time). |
| Orig_CH4_flux | nmol m-2 s-1 | CH4 flux before adjusting for chamber headspace volume filled by vegetation. |
| Orig_CO2_flux | umol m-2 s-1 | CO2 flux before adjusting for chamber headspace volume filled by vegetation. |
| Veg_vol | percent | Estimated percent headspace volume filled by vegetation. |
| Adj_CH4_flux | nmol m-2 s-1 | CH4 flux after adjusting for chamber headspace volume filled by vegetation. |
| Adj_CO2_flux | umol m-2 s-1 | CO2 flux after adjusting for chamber headspace volume filled by vegetation. |
| GPP | umol m-2 s-1 | Gross Primary Productivity. |
Table 3. Data dictionary for Table_3_Methanogen_Methanotroph_Relative_Abundance.csv
| Variable | Units | Description |
|---|---|---|
| Sample_ID | - | Sample location ID (56 unique IDs) |
| Depth_cm | cm | Soil sample depth |
| Methanogen_Rel_Abundance | percent | Methanogen relative abundance |
| Methanotroph_Rel_Abundance | percent | Methanotroph relative abundance |
Table 4. Data dictionary for Table_4_Soil_Sample_Chemical_Analysis.csv
| Variable | Units | Description |
|---|---|---|
| Sample_ID | - | Sample location ID (56 unique IDs) |
| Depth_cm | cm | Soil sample depth |
| pH | 1 | Soil pH |
| OM | percent | Organic matter |
| EC | mmhos cm-1 | Electrical conductivity |
| Nitrate_N | ppm | Nitrate-nitrogen concentration |
| NH4_N | ppm | Ammonium-nitrogen concentration |
| P_Olsen | ppm | Phosphorus (Olsen test) concentration |
| K | ppm | Potassium concentration |
| Ca | ppm | Calcium concentration |
| Mg | ppm | Magnesium concentration |
| Na | ppm | Sodium concentration |
| S | ppm | Sulfate-sulfur concentration |
| CEC | meq (100 g)-1 | Cation exchange capacity in milliequivalents per 100 grams of soil |
| K_base_sat | percent | Base saturation K |
| Ca_base_sat | percent | Base saturation Ca |
| Mg_base_sat | percent | Base saturation Mg |
| Na_base_sat | percent | Base saturation Na |
| CCE | percent | Calcium carbonate equivalent |
Table 5. Data dictionary for Table_5_Simper_Microbial_Community_Analysis.csv
| Variable | Units | Description |
|---|---|---|
| SIMPER_Order | - | Simper Order |
| ASV | - | Amplicon sequence variant (ASV) |
| More_abundant_in_Intermediate_CH4_flux_samples | - | Was the ASV more abundant in Intermediate CH4 flux samples? (yes/no) |
| Domain | - | Domain |
| Phyla | - | Phyla |
| Class | - | Class |
| Order | - | Order |
| Family | - | Family |
| Genus | - | Genus |
| Cumulative_Sum | 1 | The cumulative contribution of each ASV to the difference between two groups (samples from the intermediate CH4 flux category, and samples from all other CH4 flux categories). The column is ordered with the highest contributors at the top.Thus the cumulative sum in the first row is the contribution from the 1st most distinguishing organism, the second row is the sum of rows 1 and 2, and so on. Units = proportion. |
| p_value | 1 | Permutation-based p-value. The probability of getting a larger or equal average contribution for each ASV if the grouping factor (CH4 flux category) was randomly permuted |
Table 6. Data dictionary for Table_6_Qiime2_taxonomy_output
| Variable | Units | Description |
|---|---|---|
| Sample_ID | - | Sample location ID (56 unique IDs) |
| Depth_cm | cm | Soil sample depth (cm) |
| OTUID | - | Soil sample ID number. Note that AK64 , AK65, AK66, AK67 are DNA extraction blanks and PCRB1, PCRB1D, PCRB1Z, PCRB5, PCRB5Z are PCR blanks |
Table 7. Data dictionary for Table_7_hourly_meteorology_weather_sensor.csv
| Variable | Units | Description |
|---|---|---|
| Date_time_AKDT | YYYY-MM-DD hh:mm:ss | Local date and time (Alaska Daylight Time, UTC−08:00) |
| RECORD | - | Record number |
| BattV_Avg | V | Battery voltage (Avg) |
| BattV_Max | V | Battery voltage (Max) |
| BattV_Min | V | Battery voltage (Min) |
| BattV | V | Battery voltage (Smp - the current/instantaneous value at the time of measurement) |
| BattV_Std | V | Battery voltage (Std) |
| PTemp_C_Avg | degrees C | Average Wiring Panel Temperature of the Campbell Scientific CR300 data logger (Avg) |
| PTemp_C_Max | degrees C | Average Wiring Panel Temperature of the Campbell Scientific CR300 data logger (Max) |
| PTemp_C_Min | degrees C | Average Wiring Panel Temperature of the Campbell Scientific CR300 data logger (Min) |
| PTemp_C | degrees C | Average Wiring Panel Temperature of the Campbell Scientific CR300 data logger (Smp - the current/instantaneous value at the time of measurement) |
| PTemp_C_Std | degrees C | Average Wiring Panel Temperature of the Campbell Scientific CR300 data logger (Std) |
| SlrFD_W_Avg | W m-2 | Solar lux density (Avg) |
| SlrFD_W_Max | W m-2 | Solar flux density (Max) |
| SlrFD_W_Min | W m-2 | Solar flux density (Min) |
| SlrFD_W | W m-2 | Solar flux density (Smp - the current/instantaneous value at the time of measurement) |
| SlrFD_W_Std | W m-2 | Solar flux density (Std) |
| Rain_mm_Tot | mm | Total rainfall (Tot) |
| Strikes_Tot | 1 | Count of lightning strikes (Tot) |
| Dist_km_Avg | km | Distance to lightning strikes (Avg) |
| Dist_km_Max | km | Distance to lightning strikes (Max) |
| Dist_km_Min | km | Distance to lightning strikes (Min) |
| Dist_km | km | Distance to lightning strikes (Smp - the current/instantaneous value at the time of measurement) |
| Dist_km_Std | km | Distance to lightning strikes (Std) |
| WS_ms_Avg | m s-1 | Wind speed (Avg) |
| WS_ms_Max | m s-1 | Wind speed (Max) |
| WS_ms_Min | m s-1 | Wind speed (Min) |
| WS_ms | m s-1 | Wind speed (Smp - the current/instantaneous value at the time of measurement) |
| WS_ms_Std | m s-1 | Wind speed (Std) |
| WS_ms_S_WVT | m s-1 | Mean wind speed (WVc – wind vector calculation) |
| WindDir_D1_WVT | degrees | Unit vector mean wind direction (WVc – wind vector calculation) |
| WindDir_SD1_WVT | degrees | Standard deviation of wind direction (WVc – wind vector calculation) |
| WindDir | degrees | Wind direction (Smp) |
| MaxWS_ms_Avg | m s-1 | Max wind speed (Avg) |
| MaxWS_ms_Max | m s-1 | Max wind speed (Max) |
| MaxWS_ms_Min | m s-1 | Max wind speed (Min) |
| MaxWS_ms | m s-1 | Max wind speed (Smp - the current/instantaneous value at the time of measurement) |
| MaxWS_ms_Std | m s-1 | Max wind speed (Std) |
| AirT_C_Avg | degrees C | Air temperature (Avg) |
| AirT_C_Max | degrees C | Air temperature (Max) |
| AirT_C_Min | degrees C | Air temperature (Min) |
| AirT_C | degrees C | Air temperature (Smp - the current/instantaneous value at the time of measurement) |
| AirT_C_Std | degrees C | Air temperature (Std) |
| VP_mbar_Avg | mbar | Vapor pressure (Avg) |
| VP_mbar_Max | mbar | Vapor pressure (Max) |
| VP_mbar_Min | mbar | Vapor pressure (Min) |
| VP_mbar | mbar | Vapor pressure (Smp - the current/instantaneous value at the time of measurement) |
| VP_mbar_Std | mbar | Vapor pressure (Std) |
| BP_mbar_Avg | mbar | Barometric pressure (Avg) |
| BP_mbar_Max | mbar | Barometric pressure (Max) |
| BP_mbar_Min | mbar | Barometric pressure (Min) |
| BP_mbar | mbar | Barometric pressure (Smp - the current/instantaneous value at the time of measurement) |
| BP_mbar_Std | mbar | Barmetric pressure (Std) |
| RH_Max | percent | Relative humidity (Max) |
| RH_Min | percent | Relative humidity (Min) |
| RH | percent | Relative humidity (Smp - the current/instantaneous value at the time of measurement) |
| RHT_C_Avg | degrees C | Temperature reading from the relative humidity & temperature sensor (Avg) |
| RHT_C_Max | degrees C | Temperature reading from the relative humidity & temperature sensor (Max) |
| RHT_C_Min | degrees C | Temperature reading from the relative humidity & temperature sensor (Min) |
| RHT_C | degrees C | Temperature reading from the relative humidity & temperature sensor (Smp - the current/instantaneous value at the time of measurement) |
| RHT_C_Std | degrees C | Temperature reading from the relative humidity & temperature sensor (Std) |
| TiltNS_deg_Avg | degrees | North/South orientation of the ClimaVue instrument (Avg) |
| TiltNS_deg_Max | degrees | North/South orientation of the ClimaVue instrument Tilt (Max) |
| TiltNS_deg_Min | degrees | North/South orientation of the ClimaVue instrument Tilt (Min) |
| TiltNS_deg | degrees | North/South orientation of the ClimaVue instrument Tilt (Smp - the current/instantaneous value at the time of measurement) |
| TiltNS_deg_Std | degrees | North/South orientation of the ClimaVue instrument Tilt (Std) |
| TiltWE_deg_Avg | degrees | West/East orientation of the ClimaVue instrument Tilt (Avg) |
| TiltWE_deg_Max | degrees | West/East orientation of the ClimaVue instrument Tilt (Max) |
| TiltWE_deg_Min | degrees | TWest/East orientation of the ClimaVue instrument Tilt (Min) |
| TiltWE_deg | degrees | West/East orientation of the ClimaVue instrument Tilt (Smp - the current/instantaneous value at the time of measurement) |
| TiltWE_deg_Std | degrees | West/East orientation of the ClimaVue instrument Tilt (Std) |
| SlrTF_MJ_Tot | MJ m-2 | Total solar radiation over the measurement interval |
| CVMeta | Data logger ID | |
| Invalid_Wind_Avg | 1 | Count of invalid wind measurements (Avg). |
| Invalid_Wind_Max | 1 | Count of invalid wind measurements (Max). |
| Invalid_Wind_Min | 1 | Count of invalid wind measurements (Min). |
| Invalid_Wind | 1 | Count of invalid wind measurements (Smp - the current/instantaneous value at the time of measurement). |
| Invalid_Wind_Std | 1 | Count of invalid wind measurements (Std). |
| Invalid_Wind_Tot | 1 | Count of invalid wind measurements (Tot). |
Table 8. Data dictionary for Table_8_Halfhourly_Soil_Temperature_Logger_Data.csv
| Variable | Units | Description | Logger Latitude | Logger Longitude |
|---|---|---|---|---|
| Date_time_AKDT | YYYY-MM-DD hh:mm:ss | Date and time (Alaska Daylight Time) | ||
| SoilT_C_logger1 | degrees C | Soil temperature logger-1 | 64.92185221 | -147.8203832 |
| SoilT_C_logger2 | degrees C | Soil temperature logger-2 | 64.92252362 | -147.8204773 |
| SoilT_C_logger3 | degrees C | Soil temperature logger-3 | 64.9219876 | -147.8192036 |
| SoilT_C_logger4 | degrees C | Soil temperature logger-4 | 64.92197142 | -147.8212274 |
| SoilT_C_logger5 | degrees C | Soil temperature logger-5 | 64.92243131 | -147.8210107 |
| SoilT_C_logger6 | degrees C | Soil temperature logger-6 | 64.9223092 | -147.8198968 |
Table 9. Data dictionary for Table_9_Training_Testing_Data_RedEdgeMX_Classification.csv
| Variable | Units | Description |
|---|---|---|
| Latitude | degrees north | Latitude of training/testing point in decimal degrees. |
| Longitude | degrees east | Longitude of training/testing point in decimal degrees. |
| train_test | - | Indicates training or testing point. |
| Class | - | Ground-truth based on visual assessment of high-resolution drone imagery (1=Graminoid; 2=Moss; 3=Shadow; 4=Water; 5=Woody). |
| remx_blue | 1 | RedEdge-MX blue band; brightness value as a digital number. |
| remx_green | 1 | RedEdge-MX green band; brightness value. |
| remx_red | 1 | RedEdge-MX red band; brightness value.. |
| remx_rededge | 1 | RedEdge-MX rededge band; brightness value. |
| remx_NIR | 1 | RedEdge-MX near-infrared (NIR) band; brightness value. |
| remx_NDVI | 1 | Normalized Difference Vegetation Index (NDVI) calculated from RedEdge-MX imagery. |
| USGS_DSM | m | USGS 3DEP digital surface model (DSM; orthometric elevation) |
Table 10. Data dictionary for Table_10_Training_Testing_Data_multiSPEC4C_Classification.csv
| Variable | Units | Description |
|---|---|---|
| Latitude | degrees north | Latitude of training/testing point in decimal degrees. |
| Longitude | degrees east | Longitude of training/testing point in decimal degrees. |
| train_test | - | Indicates training or testing point. |
| Class | - | Ground-truth based on visual assessment of high-resolution drone imagery (1=Graminoid; 2=Moss; 3=Shadow; 4=Water; 5=Woody). |
| ms4c_NIR | 1 | multiSPEC-4C green band; reflectance |
| ms4c_red | 1 | multiSPEC-4C red band; reflectance. |
| ms4c_green | 1 | multiSPEC-4C near-infrared (NIR) band; reflectance. |
| ms4c_NDVI | 1 | Normalized Difference Vegetation Index (NDVI) calculated from multiSPEC-4C imagery. |
| USGS_DSM | m | USGS 3DEP digital surface model (DSM; orthometric elevation) |
Compressed Zip File
The dataset contains one compressed file, Sample_Location_Photos_July_2021.zip. Enclosed are 326 photos in JPEG (*jpg) format that were taken at soil sampling locations in 2021. There are 15 subdirectories, one for each Site_ID. The JPEG files are named YYYYMMDD_hhmmss_ Sample_ID.jpg, where YYYYMMDD_hhmmss is the timestamp and Sample_ID is the sample location ID.
Application and Derivation
This dataset provides point-based field data and high-resolution multispectral drone imagery (spatial resolution ~10 cm) over a boreal forest-fen mosaic ecosystem. Most variables were collected (or modeled) over multiple points in space (single time point), which may offer insight on the spatial relationships between carbon fluxes and driver variables (e.g., spatial relationships between CH4 flux and soil moisture, or between CH4 flux and soil microbial community composition). The microbial community analyses provide information about soil microbial communities across space and by soil depth. The weather station and soil temperature loggers provide continuous time series data from single point locations.
Please see Farina et al. (2025) for additional details.
Quality Assessment
LI-COR Smart Chamber flux estimates from July 2021 field survey:
During the July 2021 field survey, flux data were collected with the LI-COR Smart Chamber at 56 sample locations, with three replicates per location (totaling 168 samples). Methane and CO2 fluxes were computed using exponential or linear fits of the concentration data over time using the LI-COR SoilFluxPro software (version 4.2.1), and flux estimate quality was evaluated based on the resulting R2 values. Three of the 168 samples had poor model fits with either the CH4 or CO2 concentration data and were removed from the dataset. Among the remaining 165 CH4 flux estimates, 115 were fitted with exponential models, and 50 were fitted with linear models. Most of these fitted models (96% of models) had R2 values greater than 0.9, and the remaining 4% of fitted models had R2 values between 0.77 and 0.87. Among the 165 CO2 flux estimates (i.e., ecosystem respiration), 158 samples were fitted with exponential models, and seven were fitted with linear models, and all R2 values ranged from 0.94 to 0.99.
Polycarbonate chamber flux estimates from July 2021 field survey:
During the July 2021 field survey, flux data were also collected with a clear polycarbonate chamber at 10 sample locations, including three replicates with the opaque vinyl cover and three replicates without the cover. Methane and CO2 fluxes were computed using linear fits of the concentration data over time using the FluxCalR R package (Zhao 2019). Among the model fits, the mean R2 values were 0.81 and 0.76 for CH4 fluxes with and without the cover, respectively, and 0.85 and 0.64 for CO2 fluxes with and without the cover.
Smart Chamber flux estimates from August 2022 field survey:
Smart Chamber carbon fluxes were also collected at a subset of sample locations during a field survey in August 2022. Methane and CO2 fluxes were computed using exponential or linear fits of the concentration data over time using the LI-COR SoilFluxPro software (version 4.2.1). Among the CH4 fluxes, 9 were fitted with exponential models, 10 were fitted with linear models, and all R2 values ranged from 0.94 to 0.99. Among the CO2 fluxes, 16 were fitted with exponential models, three were fitted with linear models, and all R2 values ranged from 0.97 to 0.99.
Soil moisture measurements:
Across the 56 sampling locations, the Hydrosense II measurements of period (τ) ranged 2.339 – 3.832 μs for the 20 cm rod inserted vertically; 1.273 – 2.402 μs for the 12 cm rod inserted vertically; and 1.172 – 2.367 μs for the 12 cm rod inserted at a 30° angle. These measurements fell within valid ranges of τ. For the 20 cm rod, the valid range of τ is 1.38 μs (in air) to 3.89 μs (in water); for the 12 cm rod, τ ranges from approximately 1.0 μs (in air) to 2.47 μs (in water) (Campbell Scientific). The Hydrosense II probe has a volumetric water content resolution <0.05% and a typical water content accuracy within 3% (Campbell Scientific).
Other in situ measurements:
Latitude and longitude data were collected for the sample locations using Emlid Reach RS2 GNSS base and rover receivers (Emlid Tech), with Post-Processed Kinematic (PPK) corrections applied to the coordinates. The HI98331 soil temperature probe has a soil temperature accuracy of ±1°C, and the HI981030 Soil pH tester has an accuracy of ±0.05 pH (Hanna Instruments). Within the ClimaVUE-50 weather sensor: air temperature is accurate within ±0.6°C of measurement; relative humidity is accurate within ±3%; barometric pressure is accurate within ±1 mbar; vapor pressure is accurate within ±2 mbar below 40°C; wind speed is accurate within 0.3 m s-1 or 3% (whichever is greater); wind direction is accurate within ±5°; solar radiation is accurate within ±5%; precipitation is accurate within ±5%; sensor tilt is accurate within ±1°; and lightning strikes have >25% detection accuracy at <10 km distance (Campbell Scientific). The six soil temperature data loggers (UA-002-08 HOBO Pendant Temperature/Light 8K Data Logger) have a temperature accuracy of ±0.53°C and a time accuracy of ±1 minute per month at 25°C (Onset Computer Corporation).
Land cover classifications
Each land cover classification (using multiSPEC-4C bands or using RedEdge-MX bands) was calibrated using a dataset of 90 observations (20 graminoid, 10 moss, 20 woody vegetation, 20 shadow, 20 surface water), and validated using an independent dataset of 90 observations. The training and testing datasets were generated using visual assessment of the high-resolution imagery in QGIS mapping software (QGIS, 2024). The classification model based on RedEdge-MX imagery and 3DEP DSM had an overall accuracy of 0.89 (95% confidence interval 0.79–0.94) based on the independent test dataset, and the classification based on multiSPEC-4C imagery and 3DEP DSM had an accuracy of 0.93 (95% confidence interval 0.86–0.98) based on the independent test data.
Please see Farina et al. (2025) for additional details.
Data Acquisition, Materials, and Methods
GeoTIFF files
The USGS 3DEP DTM and DSM rasters (tile ID 4520; 0.5 m spatial resolution; USGS, 2017) were georeferenced to spatially align with the RedEdge-MX drone imagery (~10 cm spatial resolution; collected July 2021) as precisely as possible. Georeferencing was done using a third-degree polynomial transformation algorithm and nearest neighbor resampling. The georeferenced DTM raster was aggregated to 1 m spatial resolution and projected to the WGS 84 / UTM Zone 6N coordinate reference system (EPSG:32606) using bilinear resampling. The 1-m resolution raster was used for subsequent modeling. The local mean DTM elevation was calculated for a 31-m x 31-m moving window, and per-grid cell microtopography was calculated as the local mean subtracted from the 1-m DTM values (following methods by Rodenhizer et al., 2022). Gridded slope estimates were calculated from the 1-m DTM data using 8-pixel neighborhoods.
USGS 3DEP DTM data was smoothed by calculating the moving window (31 m x 31 m) mean value, and per-grid cell microtopography was calculated as the local mean subtracted from the original DTM. However, the optimal degree of smoothing (i.e., moving window size) is uncertain. The 31-m window size was selected because the resulting smoothed DTM seemed to capture the broad scale elevation gradient in the study area, but a larger or smaller window size could have a substantial impact on modeled microtopography (Erdbrügger et al., 2021).
The multiSPEC-4C imagery is described in more detail by Barnes et al. (2021).
Land cover classes (graminoid, moss, woody vegetation, shadow, and surface water) were mapped across the study area using supervised random forest classification informed by the drone multispectral imagery, NDVI inputs, and USGS 3DEP DSM data. Separate random forest classification models were calibrated and validated using the multiSPEC-4C imagery collected in August 2019 and the RedEdge-MX imagery collected in July 2021. In the multiSPEC-4C classification, predictor variables included the green, red, near-infrared (NIR), and NDVI layers from the multiSPEC-4C sensor, and 3DEP DSM. In the RedEdge-MX classification, predictor variables included the blue, green, red, red edge, NIR, and NDVI layers from the RedEdge-MX sensor, and 3DEP DSM. The supervised random forest classifications were run using the randomForest package in R (Liaw and Wiener, 2002).
The two resulting classifications were combined to minimize the number of pixels classified as shadow. Because the RedEdge-MX imagery was collected during the same field survey as the chamber flux and in situ data collection (July 2021), land cover predictions from the RedEdge-MX classification were selected as the baseline. Pixels that were predicted as shadow by the RedEdge-MX classification, and predicted as non-shadow by the multiSPEC-4C classification, were assigned the multiSPEC-4C prediction in the combined classification.
CSV Files
Table 1 (Table_1_Chamber_Fluxes_Insitu_Data_July_2021.csv): During the July 2021 field survey, in situ CH4 flux was collected at 56 sample locations using a LI-COR Smart Chamber. Table 1 reports the flux estimates averaged for three replicates at each sample location. A Hydrosense II sensor with 20 cm and 12 cm probes was used to sample soil moisture (Campbell Scientific). To measure soil moisture at 20 cm and 12 cm depths, the 20 cm and 12 cm probes were inserted into the ground vertically. To measure soil moisture at 6 cm depth, the 12 cm probe was inserted into the ground at a 30° angle. These measurements fell within valid ranges of τ. For the 20 cm rod, the valid range of τ is 1.38 μs (in air) to 3.89 μs (in water); for the 12 cm rod, τ ranges from approximately 1.0 μs (in air) to 2.47 μs (in water) (Campbell Scientific). To estimate soil moisture as volumetric water content (VWC), the Hydrosense II measurements of period (τ) were converted to percent VWC using a calibration equation developed for organic boreal soils. The Soil Type A equation developed by Bourgeau-Chavez and Loboda (2018) was used for non-burned, organic soils. After calibration to percent VWC, the soil moisture values ranged from 29.0% to 88.2% (20 cm depth), 24.8% to 54.6% (12 cm depth), and 14.8% to 54.6% (6 cm depth). The VWC estimates vary by choice of calibration equation. For example, if the Soil Type D equation had been selected (for similarly unburned organic soils, with at least 20 cm of upper duff), then the soil moisture values would have ranged 38.0% to 79.3% (20 cm depth), 22.9% to 62.4% (12 cm depth), and 13.0% to 62.4% (6 cm depth). At each sample location, soil temperature at 5 cm and 10 cm depth, and soil pH at 2.5 cm and 6.4 cm depth, were collected using HI98331 and HI981030 GroLine soil probes (Hanna Instruments). The HI981030 soil pH probe was calibrated using pH 4.01 and 7.01 calibration buffer solutions. Table 1 includes air temperature at the time of each sample collection measured by the stationary weather sensor (see Table 7). Table 1 also includes modeled microtopography (m) and slope (degrees), derived from USGS 3DEP DTM, and extracted from the gridded datasets for each flux sample location.
Table 2 (Table_2_Detailed_Chamber_Flux_Estimates_July_2021_August_2022): Table 2 reports more detailed information on the in situ flux data collection during the July 2021 and August 2022 field surveys, including CH4 and CO2 flux estimates for individual replicates. For each flux estimate replicate, the original flux estimate, the estimated chamber headspace occupied by vegetation (percent volume), and the adjusted flux estimate, which accounts for the vegetation volume, are reported. The percent volume of chamber headspace filled by vegetation was estimated visually. Methane and CO2 flux data were collected with either a LI-COR 8200-01S Smart Chamber (SC); Polycarbonate chamber (clear plastic) with opaque cover (PC_cover); or Polycarbonate chamber without opaque cover (PC_no_cover). Carbon dioxide flux estimates from the polycarbonate chamber without the opaque cover represent net ecosystem exchange (NEE), whereas CO2 flux estimates with the opaque cover represent ecosystem respiration (Reco). Gross primary productivity (GPP) was estimated as Reco - NEE. If the estimated GPP was a negative value, then the GPP was set to zero. During the August 2022 field survey, CH4 flux estimates were collected with the LI-COR Smart Chamber at a subset of sample locations.
Table 3 (Table_3_Methanogen_Methanotroph_Relative_Abundance.csv): At a subset of sample locations (n=17), soil samples were collected at four depths (0-12.5 cm, 12.5-25 cm, 25-37.5 cm, 37.5 - 50 cm). The soil samples were analyzed in a laboratory for methanogen and methanotroph relative abundance.
Table 4 (Table_4_Soil_Sample_Chemical_Analysis.csv): At a subset of sample locations (n=17), soil samples were collected at four depths (0-12.5 cm, 12.5-25 cm, 25-37.5 cm, 37.5 - 50 cm). Table 4 reports the results of chemical analyses conducted on the soil samples (Agvise Laboratories). Measured variables include: 1.) general soil properties including pH, percent organic matter (OM), soluble salts (electrical conductivity, EC 1:1), sodium concentration (Na); 2.) macronutrient concentrations including nitrate-nitrogen, ammonium-nitrogen (NH4), phosphorous (P; Olsen method), potassium (K), calcium (Ca), magnesium (Mg), and sulfate-sulfur (S); and 3.) base saturation (K, Ca, Mg, Na).
Table 5 (Table_5_Simper_Microbial_Community_Analysis.csv): SIMPER microbial community analysis was used to determine which amplicon sequence variants (ASVs) contribute to compositional differences between the microbial communities from sites in the intermediate CH4 flux category and microbial communities from sites in all other CH4 flux categories (negative, low, high, or very high). In other words, it identified which ASVs differentiated the intermediate CH4 flux samples from the samples in the other CH4 flux categories.
Table 7 (Table_7_Hourly_Meteorology_Weather_Sensor.csv): Hourly meteorological data were collected in July 2021 (2021-07-07 to 2021-07-27) from a weather station located at 64.91985 latitude, -147.8189 longitude (3 m height; 300 m distance from the flux sample locations). Meteorological data were collected with a Campbell Scientific ClimaVue50 digital weather sensor, which collected measurements at a 5 second resolution. Values in the data file are summarized in hourly increments.
Table 8 (Table_8_Halfhourly_Soil_Temperature_Logger_Data.csv): During the July 2021 field survey, soil temperature data loggers were inserted in the soil (1-3 cm below the surface) at six locations, and they recorded continuous, half-hourly soil temperature throughout the field survey. The Table 8 data dictionary reports the coordinates of each logger.
Please see Farina et al. (2025) for additional details
Data Access
These data are available through the Oak Ridge National Laboratory (ORNL) Distributed Active Archive Center (DAAC).
ABoVE: Land Cover, Methane Flux, and Environmental Data, Big Trail Lake, Fairbanks AK
Contact for Data Center Access Information:
- E-mail: uso@daac.ornl.gov
- Telephone: +1 (865) 241-3952
References
Barnes, N., H. Webb, M.K. Farina, S. Powell, and J.D. Watts. 2021. Multispectral Imagery, NDVI, and Terrain Models, Big Trail Lake, Fairbanks, AK, 2019. ORNL DAAC, Oak Ridge, Tennessee, USA. https://doi.org/10.3334/ORNLDAAC/1834
Bourgeau-Chavez, L.L., Bosse, K.R., Poley, A.F., Battaglia, M.J. 2024. ABoVE: Soil Moisture and ALT Field Collection Protocols and Probe Calibration. ORNL DAAC, Oak Ridge, Tennessee, USA. https://doi.org/10.3334/ORNLDAAC/2373
Erdbrügger, J., I. van Meerveld, K. Bishop, and J. Seibert. 2021. Effect of DEM-smoothing and -aggregation on topographically-based flow directions and catchment boundaries. Journal of Hydrology 602:126717. https://doi.org/10.1016/j.jhydrol.2021.126717
Farina, M., W. Christian, N. Hasson, T. McDermott, S. Powell, R. Hatzenpichler, H. Webb, G. LaRue, K. Okano, E. Sproles, and J. Watts. 2025. Methane emission hotspots in a boreal forest-fen mosaic potentially linked to deep taliks. Environmental Research Letters 20:104029. https://doi.org/10.1088/1748-9326/adff9a
Liaw, Andy, and Matthew Wiener. 2002. Classification and regression by randomForest. R News 2:18-22. https://journal.r-project.org/articles/RN-2002-022/RN-2002-022.pdf
QGIS. 2024. QGIS Geographic Information System. Open Source Geospatial Foundation Project. http://qgis.org
Rodenhizer, H., Belshe, F., Celis, G., Ledman, J., Mauritz, M., Goetz, S., Sankey, T. and Schuur, E.A., 2022. Abrupt permafrost thaw accelerates carbon dioxide and methane release at a tussock tundra site. Arctic, Antarctic, and Alpine Research 54:443-464. https://doi.org/10.1080/15230430.2022.2118639
U.S. Geological Survey (USGS). 2017. 2017 USGS 3DEP Lidar: Fairbanks, AK (QL1 & QL2) from 2010-06-15 to 2010-08-15. NOAA National Centers for Environmental Information, https://www.fisheries.noaa.gov/inport/item/55358
Zhao, J. 2019. FluxCalR: a R package for calculating CO2 and CH4 fluxes from static chambers. Journal of Open Source Software 4:1751. https://doi.org/10.21105/joss.01751