Documentation Revision Date: 2026-04-22
Dataset Version: 1
Summary
This dataset has 3,940 data files which includes 3,878 files in cloud-optimized GeoTiff format, 31 files in Parquet format, 30 files in comma-separated values format, and one geopackage file.
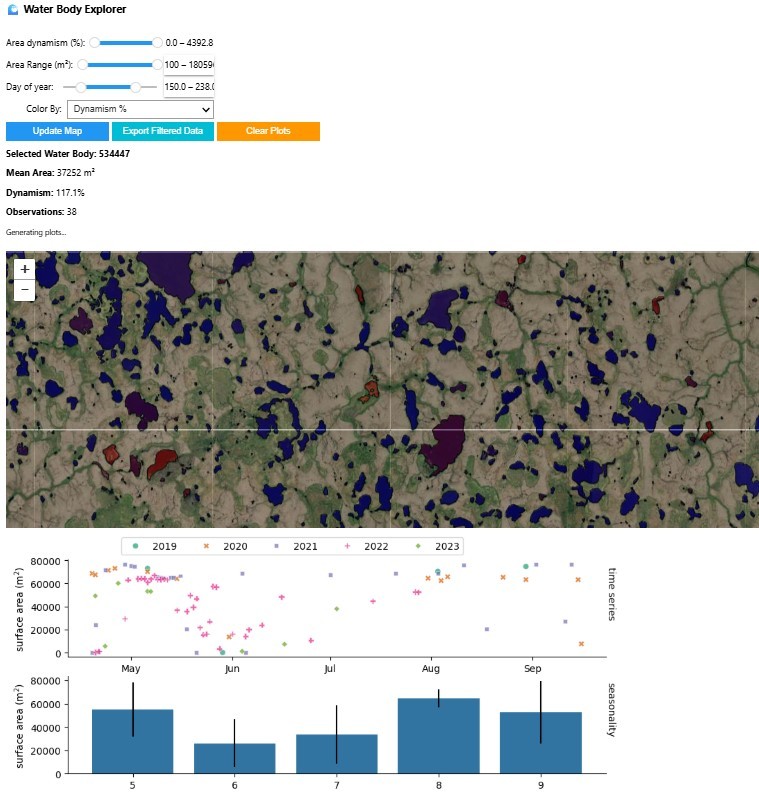
Figure 1. Screenshot from interactive water body explorer Jupyter Notebook, available at https://github.com/amullen01/dl-water-bodies.
Citation
Mullen, A., J.D. Watts, E. Levenson, J.A. Caraballo-Vega, C.S. Spradlin, and M.L. Carroll. 2026. Lakes, Ponds, and Partial Inundation in the Yukon Kuskokwim Delta, AK, 2019-2023. ORNL DAAC, Oak Ridge, Tennessee, USA. https://doi.org/10.3334/ORNLDAAC/2450
Table of Contents
- Dataset Overview
- Data Characteristics
- Application and Derivation
- Quality Assessment
- Data Acquisition, Materials, and Methods
- Data Access
- References
Dataset Overview
This dataset provides high resolution (3 m) maps delineating open water and partial inundation in the Yukon-Kuskokwim Delta (YKD), Alaska, and a database that tracks rapid changes in surface area for individual lakes and ponds over 2019-2023. The dataset was built using daily PlanetScope imagery, allowing for tracking changes in surface water extent at high spatial and temporal resolutions. Two types of maps were produced; (1) open water lakes and ponds and (2) partial inundation, defined as areas that partially contain water (e.g. emergent vegetation, flooded vegetation, or saturated soil). Open water lakes and ponds were mapped using a convolutional neural network, and partial inundation was classified using a pixel-based thresholding approach. For both map categories, monthly climatological composites for the snow and ice-free period are provided. For open water lake and pond maps, monthly composites are provided as well. An accompanying database includes the geometry and surface area time series for each mapped water body.
Project: Arctic-Boreal Vulnerability Experiment
The Arctic-Boreal Vulnerability Experiment (ABoVE) is a NASA Terrestrial Ecology Program field campaign being conducted in Alaska and western Canada, for 8 to 10 years, starting in 2015. Research for ABoVE links field-based, process-level studies with geospatial data products derived from airborne and satellite sensors, providing a foundation for improving the analysis, and modeling capabilities needed to understand and predict ecosystem responses to, and societal implications of, climate change in the Arctic and Boreal regions.
Related Dataset
Mullen, A., J.D. Watts, B.M. Rogers, M.L. Carroll, J.A. Caraballo-Vega, J. Noomah, Z.W. Williams, J.K.Y. Hung, and S. Natali. 2022. ABoVE: Lake and Pond Extents in Alaskan Boreal and Tundra Subregions, 2019-2021. ORNL DAAC, Oak Ridge, Tennessee, USA. https://doi.org/10.3334/ORNLDAAC/2134
Related Publication
Mullen, A. J.D. Watts, B.M. Rogers, M.L. Carroll, C.D. Elder, J. Noomah, Z. Williams, A. Bredder, E. Rickenbaugh, J.A. Caraballo-Vega, E. Levenson, S.W. Cooley, S. Potter, Y. Yang, G. Fiske, C.E. Miller, S.M. Natali, J.K.Y. Hung and T.A. Douglass. 2023. Using high-resolution satellite imagery and deep learning to track dynamic seasonality in small water bodies. Geophysical Research Letters 50:e2022GL102327. https://doi.org/10.1029/2022GL102327
Acknowledgements
This project was funded by the NASA ABoVE program (grant 80NSSC21K1161). Resources supporting this work were provided by the NASA High-End Computing (HEC) Program through the NASA Center for Climate Simulation (NCCS) at Goddard Space Flight Center. Additional support was provided by the Gordan and Betty Moore Foundation (grant 8414).
Data Characteristics
Spatial Coverage: Alaska, U.S.
Spatial Resolution: 3 m
Temporal Coverage: months of May to September in 2019 to 2023
Temporal Resolution: 3-year composites (all regions), monthly and monthly climatological composites (May-September, boreal forest regions)
Study Area: Latitude and longitude are given in decimal degrees.
| Site | Westernmost Longitude | Easternmost Longitude | Northernmost Latitude | Southernmost Latitude |
|---|---|---|---|---|
| Alaska | -168.0235 | -157.1986 | 63.4794 | 58.4219 |
Data File Information
This dataset has 3,940 data files which includes 3,878 files in cloud-optimized GeoTIFF (.tif) format, 31 water body tracking files in Parquet (.parquet) format, 30 files in comma-separated values (CSV, .csv) format, and one geopackage file (.gpkg).
GeoTIFFs
For open water lakes and ponds, the GeoTIFF naming conventions are ...
- monthly composites: <above_tile_id>_<month><year>_lp.tif
- monthly climatological composites: {above_tile_id}_{month}_lp.tif
For partial inundation, the GeoTIFF naming convention is <above_tile_id>_<month>_fw_NIR.tif.
where
- <above_tile_id> is the ABoVE C tile ID
- <month> is the two digit month of the year
- <year> is the four digit year for monthly composites
- "lp" indicates lakes and ponds
- "fw_NIR" indicates fractional water based automatic thresholding using the NIR band
GeoTIFF characteristics:
- Coordinate system: Canada Albers Equal Area Conic, ESRI:102001, NAD83 datum,
PROJ4: '+proj=aea +lat_0=40 +lon_0=-96 +lat_1=50 +lat_2=70 +x_0=0 +y_0=0 +datum=NAD83 +units=m +no_defs' - Data type = UInt8
- Nodata value = 255
- Pixel values for lakes and ponds: 0=not lake or pond, 1 = lake or pond
- Pixel values for partial inundation: 0: dry land, 1: >0% and <25% inundation, 2: >=25% and <50%, 3: >=50% and <75%, 4: >=75% and <100% inundation, 5 = open water
Parquet, geopackage, and CSV files
The water body tracking data are held in 30 Parquet (.parquet) files named <year>-<month>-measurements.parquet.
The files water_bodies_catalog.parquet and water_bodies_catalog.gpkg contain all water body geometries (polygons with centroids) and their unique ids. The coordinate reference system is ESRI:102001 - Canada_Albers_Equal_Area_Conic.
The 30 CSV files contain measurement date, water body id, surface area, and pixel count for most days in each month for May-October in years 2019-2023. The naming convention is <year>-<month>-measurements.csv.
The repository: https://github.com/amullen01/dl-water-bodies contains the code files used to generate the open water lake and pond maps. The repository also contains an interactive Jupyter Notebook (dl-water-bodies/water_body_explorer/water_body_explorer.ipynb) that allows users to browse the tracking database on an interactive map (Figure 1). This explorer tool allows for filtering of the water body dataset, querying individual water bodies to plot their time series and seasonality, and exporting filtered data as .csv.
Note that the files distributed with this dataset were renamed by year and month which differs from the names in the code.
Application and Derivation
This dataset can be used for a variety of applications including waterfowl habitat modeling, greenhouse gas cycling, and climate adaptation.
Quality Assessment
Error and uncertainty of the partial inundation product have not been quantitatively assessed. The algorithm commonly mistakes dark pixels due to shading from trees and topography for partially inundated areas, and performance is variable in developed areas. Additionally, the initial masking step restricted partial inundation mapping to areas within 60 m of pixels detected as open or partial water in Dynamic Surface Water Extent v1.0 product (DSWx; OPERA, 2024). While this masking step considerably reduced the false-positive detection rate, any areas containing surface water not detected by DSWx were therefore not mapped in the PlanetScope-based product.
Data Acquisition, Materials, and Methods
This dataset provides high resolution (3 m) maps delineating open water and partial inundation in the Yukon-Kuskokwim Delta (YKD), Alaska, and a database that tracks rapid changes in surface area for individual lakes and ponds over 2019-2023.
Open water lakes and ponds
Open water lake and pond detection followed the method from Mullen et al. (2022) and Mullen et al. (2023). A convolutional neural network (U-net) was used to map lakes and ponds in daily PlanetScope surface reflectance imagery (3 m). The U-net was selected for its ability to detect small ponds, discriminate lakes and ponds from rivers, and robustness against noise in the surface reflectance data. The YKD region was processed using the ABoVE Standard Reference Grid (Loboda et al., 2017) at the C-level. Within each ABoVE C tile, daily 4-band (blue, green, red, near-infrared) PlanetScope surface reflectance was composited to produce daily images with full coverage of the tile. For each PlanetScope image, the U-net detected lakes and ponds >100 m2. The model achieved an intersection-over-union (IOU) score of 0.91, based on 419 images (each 256 x 256 pixels) held out from training. Ground-based validation of 53 manually surveyed open water body shorelines showed IOU score declined sharply for water body surface areas <0.001 km2. For more details on the open water methodology, see Mullen et al. (2022) and Mullen et al. (2023).
Monthly and monthly climatological composites were generated by averaging the daily lake and pond maps within May-September, 2019-2025. Pixels with water present in >40% of images in each composite were given a value of 1. Monthly climatological composites were manually cleaned to remove false-positive lake and pond detections, which most commonly occurred in rivers and tree- or terrain-shaded areas.
Individual daily water maps were used to build a surface area tracking database, which includes all ponds present in the manually QA/QC’d monthly climatological composites. Each water body in the composites was assigned a unique identifier, and the database stores its geometry along with surface area measurements for each PlanetScope acquisition date.
Partial inundation
Partial inundation was mapped at the pixel-level using PlanetScope imagery and an automated Otsu thresholding algorithm. To mitigate false-positive partial inundation detections, PlanetScope imagery first was masked to only include areas within 60 m of pixels containing open water or partial inundation in the Dynamic Surface Water Extent v1.0 product (DSWx; 30 m; OPERA, 2024). The DSWx mask was created using the union of pixels classified as open water or partial inundation for every available DSWx image from the 2023 snow and ice-free period (Figure 2). Next, PlanetScope images were masked to exclude clouds and snow using each image’s accompanying UDM2 mask (Planet Team, 2022).
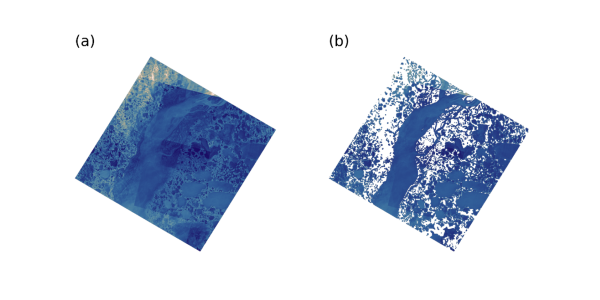
Figure 2: (a) Planetscope composite image for an ABoVE C tile (b) PlanetScope image masked to include pixels within 60 m of open water or partial inundation in the Dynamic Surface Water Extent v1.0 product (DSWx).
Initially, the partial inundation process was performed using the normalized-difference water index of each image, but it was determined that using only the near-infrared (NIR) band was more effective at capturing partial inundation. In the masked PlanetScope imagery, the NIR band contained two prominent histogram peaks: 1) a lower peak representing open water pixels, and 2) a higher peak containing pixels covering dry land. The Otsu algorithm (Otsu, 1979) was used to automatically detect the boundaries of these two peaks, and NIR reflectance values between the two peaks were assumed to contain a mix of water and non-water (Figure 3). The NIR reflectance range between the two histogram peaks was divided equally into four parts to quantify inundation fractions, which were mapped to integer values: <25% (1), 25%-50% (2), 50%-75% (3), and >75% (4). NIR values less than the open water threshold were given a value of 5, and values greater than the dry land threshold were given a value of zero.
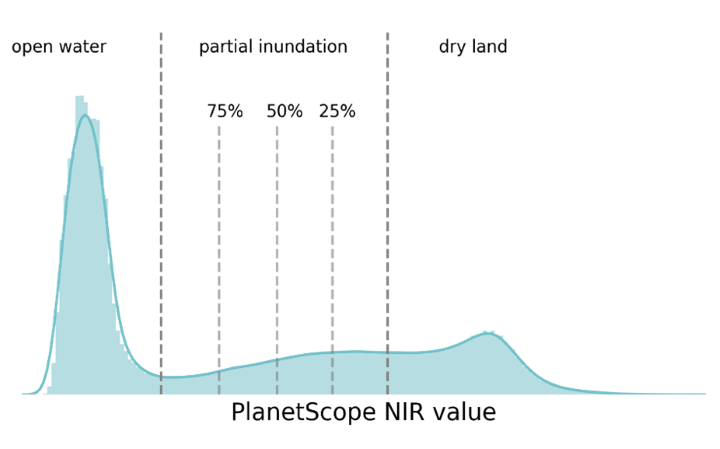
Figure 3: Histogram of PlanetScope near-infrared surface reflectance in masked image. Reflectance values between the open water and dry land peaks are attributed an open water fraction based on their position between the peaks.
Within each ABoVE tile, partial inundation maps for 2019-2023 were averaged by month to produce monthly climatological composites. Monthly climatological partial inundation composites were generated for June, July, and August.
Data Access
These data are available through the Oak Ridge National Laboratory (ORNL) Distributed Active Archive Center (DAAC).
Lakes, Ponds, and Partial Inundation in the Yukon Kuskokwim Delta, AK, 2019-2023
Contact for Data Center Access Information:
- E-mail: uso@daac.ornl.gov
- Telephone: +1 (865) 241-3952
References
Loboda, T. V., E.E. Hoy, and M.L. Carroll. 2017. ABoVE: Study Domain and Standard Reference Grids, Version 2 (Version 2.1). ORNL Distributed Active Archive Center. https://doi.org/10.3334/ORNLDAAC/1527
Mullen, A., J.D. Watts, B.M. Rogers, M.L. Carroll, J.A. Caraballo-Vega, J. Noomah, Z.W. Williams, J.K.Y. Hung, and S. Natali. 2022. ABoVE: Lake and Pond Extents in Alaskan Boreal and Tundra Subregions, 2019-2021. ORNL DAAC, Oak Ridge, Tennessee, USA. https://doi.org/10.3334/ORNLDAAC/2134
Mullen, A.L., J.D. Watts, B.M. Rogers, M.L. Carroll, C.D. Elder, J. Noomah, Z. Williams, J.A. Caraballo-Vega, A. Bredder, E. Rickenbaugh, E. Levenson, S.W. Cooley, J.K.Y. Hung, G Fiske, S. Potter, Y. Yang, C.E. Miller, S.M. Natali, T.A. Douglas, and E.D. Kyziva. 2023. Using high-resolution satellite imagery and deep learning to track dynamic seasonality in small water bodies. Geophysical Research Letters 50:e2022GL102327. https://doi.org/10.1029/2022GL102327
Planet Team. 2022, September 8. Usable data mask (UDM 2). Retrieved September 10, 2022, https://developers.planet.com/docs/data/udm-2/
OPERA. 2024. OPERA Dynamic Surface Water Extent from Sentinel-1 Version 1 [Data set]. NASA Physical Oceanography Distributed Active Archive Center. https://doi.org/10.5067/OPDSWS1-L3V1
Otsu, N. 1979. A threshold selection method from Gray-Level Histograms. IEEE Transactions on Systems, Man, and Cybernetics 9:62-66. https://doi.org/10.1109/TSMC.1979.4310076