Documentation Revision Date: 2026-05-21
Dataset Version: 1
Summary
This dataset includes 7,802 files: 3,901 cloud-optimized GeoTIFFs and 3,901 files in parquet format.
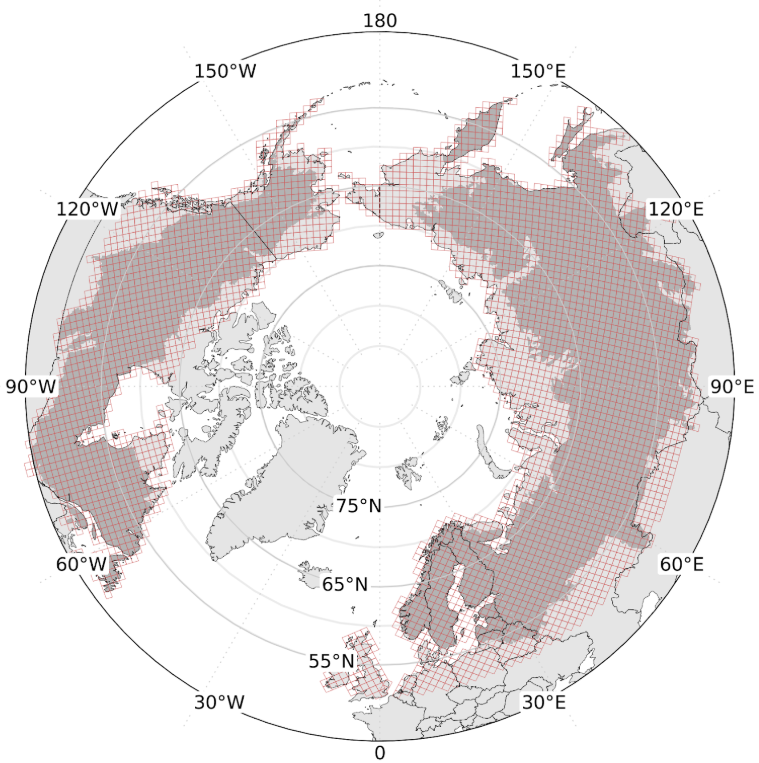
Figure 1. Vegetation height for circumpolar boreal and transitional forests and shrublands were mapped with a set of 3901 90-km x 90-km extents that serve as a tiling reference system for the dataset. This southern limit of this ICESat-2 and HLS derived dataset is nominally 51.6 degrees N, which corresponds to the northern observational limit of the vegetation structure estimates from NASA's Global Ecosystem Dynamics Investigation (GEDI) Lidar.
Citation
Montesano, P.M., A. Zarringhalam, N. Thomas, A. Neuenschwander, A. Mandel, D. Minor, E. Guenther, S. Hancock, T. Feng, S. Shah, and L. Duncanson. 2026. Vegetation Height in High Latitude Forests from ICESat-2 and HLS, 2020. ORNL DAAC, Oak Ridge, Tennessee, USA. https://doi.org/10.3334/ORNLDAAC/2438
Table of Contents
- Dataset Overview
- Data Characteristics
- Application and Derivation
- Quality Assessment
- Data Acquisition, Materials, and Methods
- Data Access
- References
Dataset Overview
This dataset provides predictions of vegetation height for high northern latitude forests at a 30-m spatial resolution for 2020. Prediction of vegetation height used machine learning modeling with random forest by relating NASA's ICESat-2 30-m ATL08 lidar samples to data from Harmonized Landsat/Sentinel-2 (HLS) and the Copernicus GLO30 DEM for each of 3,901 90-km x 90-km tiles. The height predictions cover the extent of high latitude boreal and transitional forests, and shrublands, down to 51.6°N. This extent is guided by the European Space Agency (ESA) WorldCover v1.0 2020 dataset, includes the moss/lichen land cover associated with sparse forests and shrublands at the boreal’s cold edge, and extends south down to 51.6°N. The southern limit of these ICESat-2 and HLS-derived maps coincides with the northern observational limit of NASA’s Global Ecosystems Dynamics Lidar (GEDI).
Models of vegetation height used spectral and topographic covariates associated with ICESat-2 30m observations. Non-vegetated areas (e.g. built-up, water, rock, ice) were masked out. HLS data were used to compute a suite of vegetation indices, including NDVI, NDWI, NBR, NBR2, TCW, TCG and, combined with the topographic covariates from GLO30 DEM, were used to predict 30-m vegetation height for each tile.
Mapping woody vegetation height is essential for understanding, monitoring, and managing forest carbon stocks and fluxes. This dataset is designed both for circumpolar boreal-wide mapping and for filling the northern spatial data gap from the GEDI mission. Estimates of mean vegetation height with standard deviation are provided in cloud-optimized GeoTIFF (COG) format. Observations of ATL08 (30 m segments) used for model training data are included in parquet file formats.
Project: Arctic-Boreal Vulnerability Experiment
The Arctic-Boreal Vulnerability Experiment (ABoVE) is a NASA Terrestrial Ecology Program field campaign being conducted in Alaska and western Canada, for 8 to 10 years, starting in 2015. Research for ABoVE links field-based, process-level studies with geospatial data products derived from airborne and satellite sensors, providing a foundation for improving the analysis, and modeling capabilities needed to understand and predict ecosystem responses to, and societal implications of, climate change in the Arctic and Boreal regions.
Related Publications
Duncanson, L., P. M. Montesano, A. Neuenschwander, A. Zarringhalam, N. Thomas, D. M. Minor, M. A. Wulder, J. C. White, E. Guenther, T. Feng, V. Leitold, S. Hancock, J. Armston, S. Puliti, A. I. Mandel, S. Shah, C. Silva, M. Purslow, J. Bruening, J. Breidenbach, E. Næsset, S. Saarela, N. Hunka, J. R. Kellner, S. P. Healey, D. Schepaschenko, J. Wallerman, C. S. R. Neigh, N. Carvalhais, and R. Dubayah. 2026. Global and boreal estimates of woody aboveground biomass for 2020: Filling GEDI’S northern data gap with ICESat-2 and harmonized Landsat Sentinel-2. Remote Sensing of Environment 340:115406. https://doi.org/10.1016/j.rse.2026.115406
Feng, T., L. Duncanson, P. Montesano, S. Hancock, D. Minor, E. Guenther, and A. Neuenschwander. 2023. A systematic evaluation of multi-resolution ICESat-2 ATL08 terrain and canopy heights in boreal forests. Remote Sensing of Environment 291:112570. https://doi.org/10.1016/j.rse.2023.113570
Neuenschwander, A., L. Duncanson, P. Montesano, D. Minor, E. Guenther, S. Hancock, M.A. Wulder, J.C. White, M. Purslow, N. Thomas, A. Mandel, T. Feng, J. Armston, J.R. Kellner, H.E. Anderson, L. Boschetti, P. Fekety, A. Hudak, J. Pisek, N. Sanchez-Lopez, and K. Sterenczak. 2024. Towards global spaceborne lidar biomass: Developing and applying boreal forest biomass models for ICESat-2 laser altimetry data. Science of Remote Sensing 10:100150. https://doi.org/10.1016/j.srs.2024.100150
Related Dataset
Duncanson, L., P.M. Montesano, A. Zarringhalam, A. Neuenschwander, J. Armston, T. Feng, E. Guenther, S. Hancock, S.P. Healey, J.R. Kellner, V. Leitold, A. Mandel, D. Minor, M. Purslow, S. Saarela, S. Shah, C.E. Silva, N. Thomas, J.C. White, M.A. Wulder, H.E. Andersen, L. Boschetti, P.A. Fekety, A.T. Hudak, K. Sterenczak, N. Sanchez-Lopez, and J. Wallerman. 2025. Circumpolar Boreal Forest Aboveground Biomass Density, V3. ORNL DAAC, Oak Ridge, Tennessee, USA. https://doi.org/10.3334/ORNLDAAC/2437
- This dataset holds estimates of aboveground biomass density for 2020 and covers the same circumpolar boreal domain. It includes a geopackage file holding polygons of the 90-km x 90-km tiles that organize the vegetation height data.
Acknowledgement
This work was funded by the NASA ABoVE Project (grants 80NSSC23K0325 and 80NSSC23K0976).
Data Characteristics
Spatial Coverage: Boreal forest zone of northern hemisphere and locations >43.7519 degrees latitude harboring boreal forests.
Spatial Resolution: 30-m in 90-km x 90-km tiles
Temporal Resolution: One-time estimates
Temporal Coverage: 2020
Study Area: Latitude and longitude are given in decimal degrees.
| Site | Westernmost Longitude | Easternmost Longitude | Northernmost Latitude | Southernmost Latitude |
|---|---|---|---|---|
| Boreal forests of northern hemisphere | -179.9990 | 179.8220 | 78.5313 | 43.7519 |
Data File Information
This dataset includes 7,802 files: 3,901 cloud-optimized GeoTIFFs (*.tif) holding predictions of vegetation height (mean and standard deviation), and 3901 parquet files containing vegetation height training observations from ATL08.
The GeoTIFFs hold estimates of mean vegetation height with standard deviation.
The file naming convention is boreal_ht_2020_<datetime>_<tile_num>.tif, where
- <datetime> = date and time of data generation on NASA-ESA Multi-Mission Algorithm and Analysis Platform (MAAP)
- <tile_num> = tile index number. A geopackage holding the tile polygons is available in Duncanson et al. (2025).
GeoTIFF details:
- Coordinate system: custom Albers Equal Area projection defined as ...
proj4 = "+proj=aea +lat_0= 40 +lon_0= 180 +lat_1=50 +lat_2=70 +x_0= 0 +y_0=0 +ellps=GRS80 +towgs84=0,0,0,0,0,0,0 +units=m +no_defs" - Spatial resolution: 30-m grid cells
- Extent: 90 km x 90 km (3000 x 3000 grid cells)
- Data Type: Float32
- Two bands: (1) estimated mean vegetation height (“mean_ht”), (2) standard deviation of estimate (“std_ht”)
- Pixel values: vegetation height in meters
- No data value: -9999
The parquet files contain the values of vegetation height (RH_*) from ICESat-2 30-m lidar samples used to train the random forest models (Table 1). For vegetation height, only the RH_98 metric was used for model training.
The file naming convention is boreal_ht_2020_<datetime>_<tile_num>_train.parquet.
Example file names:
boreal_ht_2020_202501131736787391_0000013.tif
boreal_ht_2020_202508201755722336_0002996_train.parquet
Table 1. Variables in the ATL08 (30 m segment) vegetation height training parquet files. Only the RH_98 height metric was used for vegetation height model training.
| Variable | Units | Description |
|---|---|---|
| lon | degrees east | Longitude of ICESat-2 30 m segment centroid in decimal degrees. |
| lat | degrees north | Latitude of ICESat-2 30 m segment centroid in decimal degrees. |
| AGB | Mg ha-1 | ICEsat-2 estimate of aboveground biomass (AGB) density of woody vegetation in Mg ha-1 (not relevant for height modeling) |
| SE | Mg ha-1 | Standard error of OLS model between field AGBD and ICESat-2 heights in Mg ha-1 (not relevant for height modeling) |
| RH_<XY> | m | ICESat-2 ATL08 RH metrics (with RH metrics ranging from RH_25, RH_50, RH_60, RH_70, RH_75, RH_80, RH_85, RH_90, RH_95, and RH_98). Ten separate variables. |
| segment_landcover | - | ICESat-2 footprint level classification of landcover class |
| model_id | - | The biomass OLS model_id used to create the AGB and SE columns (not relevant for height modeling) |
Note: The AGB estimates mentioned in Table 1 are available in the related dataset Duncanson et al. (2025).
Application and Derivation
These data are designed both for circumpolar boreal-wide mapping and filling the northern spatial data gap from NASA's Global Ecosystem Dynamics Investigation (GEDI) mission. Mapping vegetation height is essential for understanding, monitoring, and managing forest carbon stocks and fluxes.
Quality Assessment
The product consists of a set of 90-km x 90-km tiles (Figure 1), and each tile has a set of random forest models relating ICESat-2 ATL08 observations to covariate gridded values. Pixel-level standard deviation (SD) was produced by bootstrapping (n=250) of height predictions with a dynamic stopping criterion. Specifically, sampling continued until the bootstrap estimate of the SD of tile-mean height did not deviate by more than 5% over the past 10 iterations. The pixel-level SD is calculated as the SD of the set of pixel predictions from these iterations.
Data Acquisition, Materials, and Methods
This dataset provides predictions of mean vegetation height for high northern latitude forests at a 30-m spatial resolution. Predictions were included for forests, shrubs, and grass extents in which woody vegetation is present, as well as moss/lichen land cover features associated with the full woody structure gradient according to the ESA WorldCover v100 2020 dataset (Zanaga et al., 2021). The decision to include these pixels considered the broad domain of this study, where areas from the far north down to southern portions featured this classification, but represented very different apparent land uses. In northern portions, this classification occurs frequently across tundra extents (eg, the Brooks Range), whereas in the south it appears at sites of recent forest clearing.
Prediction of vegetation height used machine learning modeling with random forest by relating NASA's ICESat-2 30-m ATL08 lidar samples to wall-to wall gridded covariate stacks from Harmonized Landsat/Sentinel-2 (HLS) and the Copernicus GLO30 DEM. Non-vegetated areas (e.g. built-up, water, rock, ice) were masked out. The HLS composites and ICESat-2 data were collected from 2020 acquisitions resulting in a map reflecting 2020 conditions. ICESat-2 data were filtered to include only strong beams, growing seasons (June through September), solar elevations less than 5 degrees, snow free land (snow flag set to 1), and "msw_flag" equal to 0 (clear skies and no observed atmospheric scattering). ICESat-2's ATL08 data were summarized as point observations derived from classified photon data collected from 30-m along-track segments, improving correspondence with both the field plots and mapped pixels over the default ATL08 product. HLS data were used to create a greenest pixel composite of growing season multispectral data, which was then used to compute a suite of vegetation indices, including NDVI, NDWI, NBR, NBR2, TCW, TCG. These were then used, in combination with the topographic covariates from the Copernicus GLO30 product to predict mean 30-m vegetation height and mean aboveground biomass density (AGBD) for each of the 90-km x 90-km tiles. The AGBD data are not included in this dataset and are available in Duncanson et al. (2025).
Tile-based prediction employed a tile-window approach, whereby one Random Forest (RF) model was fit per tile90 for each iteration. The combination of all quality-filtered ICESat-2 vegetation height predictions within a center tile90, as well as its immediate neighbor tiles (typically 8 tiles, i.e., a 3 x 3 tile90 grid, except for tiles at the edge of the domain) were used to build a per-tile database of 'local' candidate training observations (ICESat-2cand_train_boreal). Additionally, a set of complementary boreal-wide candidate training observations were compiled that provided broad domain-wide context to tile90-specific local models that did not have a sufficient (n>10,000) number of local observations. Each tile90 set of ICESat-2cand_train_boreal were high-graded to only include correspondences of ATL08 30 m and HLS whose observation dates matched precisely (0 days of difference in ICESat-2 and HLS observations). A maximum of 10 samples from each tile90 were provided to this boreal-wide set, yielding n=10,377 high-graded candidate training observations. To finalize each tile90 set of training observations, ICESat-2cand_train_boreal was combined with a random sample of boreal-wide candidate training observations. If sufficient (n>10,000) local observations were not available, a random sample of boreal-wide observations were used to increase the training sample to at least 10,000, typically necessary for highest latitude and domain edge tiles where fewer local observations resulted from filtering for collections on land during limited night and low sun elevation angle periods during the growing season in and near the Arctic.
Each tile90 had 250 RF model fits, each iteratively sampling from the model coefficients and a random sample of at least 10,000 training points from the local database, with the same global training dataset included in each model to reduce tile edge effects. These RF models produced a set of 250 30-m vegetation height maps per tile90. Mean and uncertainty (standard deviation) in vegetation height (m) were estimated at the pixel-level from these 250 RF model estimates.
This product was generated on the NASA-ESA Multi-Mission Algorithm and Analysis Platform (MAAP), an open science platform. The data catalogued at the ORNL DAAC is a boreal subset of a larger set of tiles catalogued at https://stac-browser.maap-project.org/collections/icesat2-boreal-v3.1-ht.
This product represents an internal version 3.1 of the research represented by Duncanson et al. (2026) and documented in a repository at https://github.com/lauraduncanson/ICESat-2_ABoVE. The key features associated with this version are: (1) The number of bootstrapping iterations is set at 250 iterations per 90-km tile and used to calculate a per-pixel mean and standard deviation. (2) This version sets to zero the ATL08 RH metrics that coincide with shrub, herbaceous, and bare/sparse classes (ESA WorldCover 10 m 2020 v100) in the training set where the slope exceeds 15 degrees while moss/lichen class RH metrics are set to zero regardless of slope. (3) The model predicted value bias correction factor was updated to offset systematic under- and over-prediction.
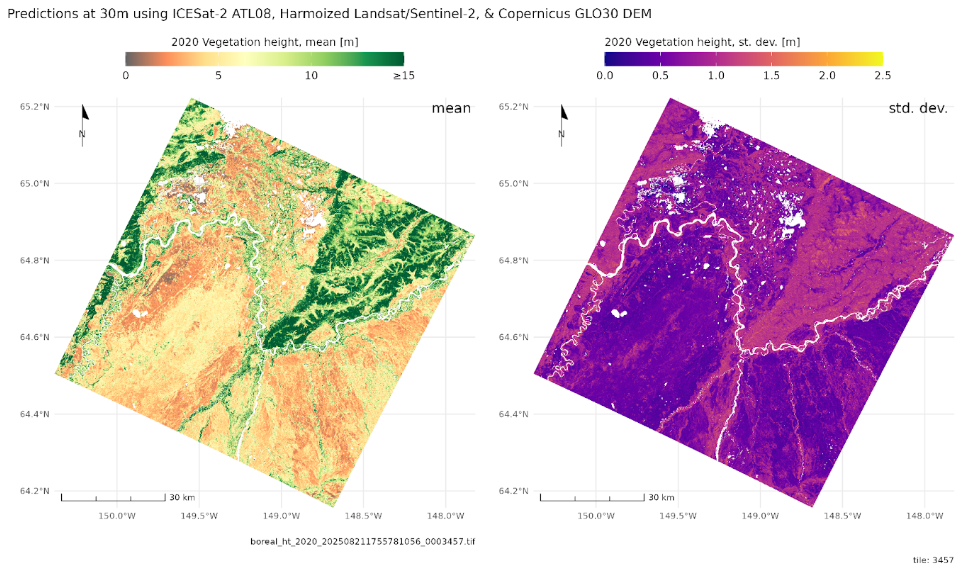
Figure 2. Example predictions of mean (left) and standard deviation (right) of vegetation height for a 90-km x 90-km tile in Alaska, shown with 30-m grid resolution. Predictions were derived from ICESat-2 ATL08 30m, Harmonized Landsat/Sentinel-2, and topographic covariates from Copernicus GLO30 DEM.
Data Access
These data are available through the Oak Ridge National Laboratory (ORNL) Distributed Active Archive Center (DAAC).
Vegetation Height in High Latitude Forests from ICESat-2 and HLS, 2020
Contact for Data Center Access Information:
- E-mail: uso@daac.ornl.gov
- Telephone: +1 (865) 241-3952
References
Copernicus WorldDEM-30 DLR e.V. 2010-2014 and Airbus Defence and Space GmbH 2014-2018 provided under COPERNICUS by the European Union and ESA. https://doi.org/10.5270/ESA-c5d3d65
Duncanson, L., P.M. Montesano, A. Neuenschwander, N. Thomas, A. Mandel, D. Minor, E. Guenther, S. Hancock, T. Feng, A. Barciauskas, G.W. Chang, S. Shah, and B.P. Satorius. 2023. Aboveground Biomass Density for High Latitude Forests from ICESat-2, 2020. ORNL DAAC, Oak Ridge, Tennessee, USA. https://doi.org/10.3334/ORNLDAAC/2186
Duncanson, L., P. M. Montesano, A. Neuenschwander, A. Zarringhalam, N. Thomas, D. M. Minor, M. A. Wulder, J. C. White, E. Guenther, T. Feng, V. Leitold, S. Hancock, J. Armston, S. Puliti, A. I. Mandel, S. Shah, C. Silva, M. Purslow, J. Bruening, J. Breidenbach, E. Næsset, S. Saarela, N. Hunka, J. R. Kellner, S. P. Healey, D. Schepaschenko, J. Wallerman, C. S. R. Neigh, N. Carvalhais, and R. Dubayah. 2026. Global and boreal estimates of woody aboveground biomass for 2020: Filling GEDI’S northern data gap with ICESat-2 and harmonized Landsat Sentinel-2. Remote Sensing of Environment 340:115406. https://doi.org/10.1016/j.rse.2026.115406
Duncanson, L., P.M. Montesano, A. Zarringhalam, A. Neuenschwander, J. Armston, T. Feng, E. Guenther, S. Hancock, S.P. Healey, J.R. Kellner, V. Leitold, A. Mandel, D. Minor, M. Purslow, S. Saarela, S. Shah, C.E. Silva, N. Thomas, J.C. White, M.A. Wulder, H.E. Andersen, L. Boschetti, P.A. Fekety, A.T. Hudak, K. Sterenczak, N. Sanchez-Lopez, and J. Wallerman. 2025. Circumpolar Boreal Forest Aboveground Biomass Density, V3. ORNL DAAC, Oak Ridge, Tennessee, USA. https://doi.org/10.3334/ORNLDAAC/2437
Feng, T., L. Duncanson, P. Montesano, S. Hancock, D. Minor, E. Guenther, and A. Neuenschwander. 2023. A systematic evaluation of multi-resolution ICESat-2 ATL08 terrain and canopy heights in boreal forests. Remote Sensing of Environment 291:112570. https://doi.org/10.1016/j.rse.2023.113570
Neuenschwander, A., L. Duncanson, P. Montesano, D. Minor, E. Guenther, S. Hancock, M.A. Wulder, J.C. White, M. Purslow, N. Thomas, A. Mandel, T. Feng, J. Armston, J.R. Kellner, H.E. Anderson, L. Boschetti, P. Fekety, A. Hudak, J. Pisek, N. Sanchez-Lopez, and K. Sterenczak. 2024. Towards global spaceborne lidar biomass: Developing and applying boreal forest biomass models for ICESat-2 laser altimetry data. Science of Remote Sensing 10:100150. https://doi.org/10.1016/j.srs.2024.100150
Zanaga, D., R. Van De Kerchove, W. De Keersmaecker, N. Souverijns, C. Brockmann, R. Quast, J. Wevers, A. Grosu, A. Paccini, S. Vergnaud, O. Cartus, M. Santoro, S. Fritz, I. Georgieva, M. Lesiv, S. Carter, M. Herold, L. Li, N.E. Tsendbazar, F. Ramoino, and O. Arino. 2021. ESA WorldCover 10 m 2020 v100. Zenodo. https://doi.org/10.5281/zenodo.5571936