Documentation Revision Date: 2026-04-10
Dataset Version: 3
Summary
There are 7,803 files in this dataset. The data products for woody aboveground biomass density (AGBD) include 3,901 cloud-optimized GeoTIFFs, 3,901 parquet files, and one spatial index file of the tile polygon extents in GeoPackage format. Each GeoTIFF file is a tile of 3000 x 3000 30-m pixels (except for 15 tiles that cross (and are thus cut by) the international dateline). There is no overlap between tiles, and they are gridded to a custom Albers Equal Area projection.
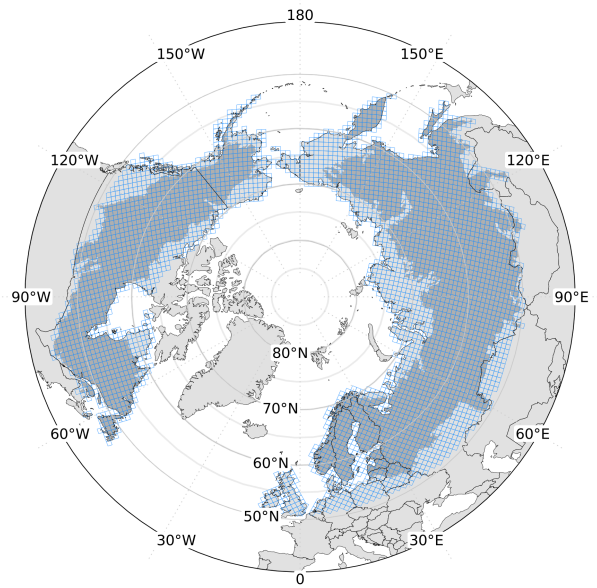
Figure 1. The set of 90-km2 tiles that serve as reference for the dataset that cover the circumpolar boreal domain + land area down through 51.6 degrees N.
Citation
Duncanson, L., P.M. Montesano, A. Zarringhalam, A. Neuenschwander, J. Armston, T. Feng, E. Guenther, S. Hancock, S.P. Healey, J.R. Kellner, V. Leitold, A. Mandel, D. Minor, M. Purslow, S. Saarela, S. Shah, C.E. Silva, N. Thomas, J.C. White, M.A. Wulder, H.E. Andersen, L. Boschetti, P.A. Fekety, A.T. Hudak, K. Sterenczak, N. Sanchez-Lopez, and J. Wallerman. 2025. Circumpolar Boreal Forest Aboveground Biomass Density, V3. ORNL DAAC, Oak Ridge, Tennessee, USA. https://doi.org/10.3334/ORNLDAAC/2437
Table of Contents
- Dataset Overview
- Data Characteristics
- Application and Derivation
- Quality Assessment
- Data Acquisition, Materials, and Methods
- Data Access
- References
- Dataset Revisions
Dataset Overview
This dataset provides predictions of woody aboveground biomass density (AGBD) for high northern latitude forests at 30-m spatial resolution for the year 2020, accounting for >30% of global forest area. The maps are essential for understanding patterns of forest structure, including the mass of forest vegetation, its carbon content, and its vertical and horizontal arrangement across managed and unmanaged landscapes. The maps help visualize these patterns, monitor forest conditions, and manage forest carbon stocks and their changes. Their information provides insights into the current conditions and shifts in a global biome that is shaped by natural processes that play out across decades to millennia, as well as human decisions, and whose status and functioning affects wildlife, the climate, economies, and the wellbeing of public and private sector stakeholders both within and outside of the north.
These maps were built with state-of-the-art earth observation datasets collected from space, including lidar observations from NASA’s ICESat-2 and imagery from NASA’s Harmonized Landsat/Sentinel-2 project. They are designed for circumpolar boreal-wide mapping from local to global scales and provide the northern component of global forest structure estimates, to which complementary estimates from NASA's Global Ecosystem Dynamics Investigation (GEDI) mission contribute temperate and tropical portions.
These maps are compiled on a platform built for geoscience algorithm development and data processing that uses Amazon Web Services. This platform (the Multi-mission Algorithm and Analysis Platform; www.maap-project.org) is the result of an international partnership between NASA and the European Space Agency to promote and support science that is accessible, reproducible, and well-documented.
For the ORNL DAAC, this is the 2nd release (Version 2) of this dataset. This dataset provides all updates from the release of Version 3.1 from the research team. A list of updates is in Section 8 below.
Project: Arctic-Boreal Vulnerability Experiment
The Arctic-Boreal Vulnerability Experiment (ABoVE) is a NASA Terrestrial Ecology Program field campaign being conducted in Alaska and western Canada, for 8 to 10 years, starting in 2015. Research for ABoVE links field-based, process-level studies with geospatial data products derived from airborne and satellite sensors, providing a foundation for improving the analysis, and modeling capabilities needed to understand and predict ecosystem responses to, and societal implications of, climate change in the Arctic and Boreal regions.
Related Publications
Duncanson, L., P. Montesano, A.L. Neuenschwander, A. Zarringhalam, N. Thomas, D. Minor, M.A. Wulder, J.C. White, E.J. Guenther, T. Feng, and V. Leitold. 2026. Global and Boreal Estimates of Woody Aboveground Biomass for 2020: Filling GEDI’s Northern Data Gap with ICESat-2 and Harmonized Landsat Sentinel. Remote Sensing of Environment (in press).
Feng, T., L. Duncanson, P. Montesano, S. Hancock, D. Minor, E. Guenther, and A. Neuenschwander. 2023. A systematic evaluation of multi-resolution ICESat-2 ATL08 terrain and canopy heights in boreal forests. Remote Sensing of Environment 291:112570. https://doi.org/10.1016/j.rse.2023.113570
Neuenschwander, A., L. Duncanson, P. Montesano, D. Minor, E. Guenther, S. Hancock, M.A. Wulder, J.C. White, M. Purslow, N. Thomas, A. Mandel, T. Feng, J. Armston, J.R. Kellner, H.E. Anderson, L. Boschetti, P. Fekety, A. Hudak, J. Pisek, N. Sanchez-Lopez, and K. Sterenczak. 2024. Towards global spaceborne lidar biomass: Developing and applying boreal forest biomass models for ICESat-2 laser altimetry data. Science of Remote Sensing 10:100150. https://doi.org/10.1016/j.srs.2024.100150
Acknowledgement
This work was supported by the NASA ABoVE program (grants 80NSSC23K0325, 80NSSC23K0976) and the NASA ICESat-2 Science Team (grant 80NSSC20K0965). This product was created on the NASA Multi-Mission Algorithm and Analysis Platform (MAAP) and the authors gratefully acknowledge support from the MAAP data and technical teams. JP was supported by the Estonian Research Council (grants PRG1405, SLTTO22345), and by Estonian Ministry of Education and Research, Centre of Excellence for Sustainable Land Use (grant TK232). Field and remote sensing data collection from Bialowieza Forest were supported by Project LIFE+ ForBioSensing (contract LIFE13ENV/PL/000048) and Poland’s National Fund for Environmental Protection and Water Management (contract 485/2014/WN10/OPNMLF/D). Several lidar data collections funded by NASA were used in this study, including from the NASA Carbon Monitoring System (grant number NNH13AW621 to W. Cohen at the USFS Service). Field and airborne lidar were also included from the National Ecological Observatory Network (NEON), a program sponsored by the U.S. National Science Foundation (NSF) and operated under cooperative agreement by Battelle.
Data Characteristics
Spatial Coverage: Boreal forest zone of northern hemisphere
Spatial Resolution: 30 m
Temporal Resolution: One-time measurements
Temporal Coverage: The data are predictions for the year 2020
Study Area: Latitude and longitude are given in decimal degrees.
| Site | Westernmost Longitude | Easternmost Longitude | Northernmost Latitude | Southernmost Latitude |
|---|---|---|---|---|
| Boreal forests of northern hemisphere | -179.999 | 179.822 | 78.531 | 43.752 |
Data File Information:
There are 7,803 files in this dataset. The data products for woody aboveground biomass density (AGBD) include 3,901 cloud-optimized GeoTIFFs, 3,901 parquet files, and one spatial index file of the tile polygon extents in GeoPackage format.
Each GeoTIFF file is a tile of 3000 x 3000 30-m pixels (except for 15 tiles that cross (and are thus cut by) the international dateline). There is no overlap between tiles, and they are gridded to a custom Albers Equal Area projection.
There is also one index file of the tile polygon extents: boreal_tiles_v004_ORNLDAAC.gpkg.
This file contains a vector map of tile polygons in GeoPackage format. The polygons are in geographic coordinates (longitude, latitude) and projected coordinates. The polygon attributes includes the tile index value ("tile_num"), an integer number equivalent to the <tile_num> component of the GeoTIFF filenames.
GeoTIFF Files
The naming convention for the GeoTIFF files: boreal_agb_<year>_<datetime>_<tile_num>.tif , where
- <year> = year of input data acquisition
- <datetime> = date and time of data generation on the NASA-ESA Multi-Mission Algorithm and Analysis Platform (MAAP)
- <tile_num> = tile index number corresponding to labeled polygons in the geopackage file.
Example file name: boreal_agb_2020_202508191755618676_0003637.tif
GeoTIFF characteristics:
- Coordinate system: custom Albers Equal Area projection defined as ...
proj4 = "+proj= aea +lat_0= 40 +lon_0= 180 +lat_1= 50 +lat_2= 70 +x_0= 0 +y_0= 0 +ellps= GRS80 +units=m +no_defs" - Spatial resolution: 30-m grid cells
- Extent: 90 km x 90 km (3000 x 3000 grid cells)
- Data Type: Float32
- Number of bands: two bands including (1) estimated mean and (2) standard deviation of the estimate
- Pixel values (units): aboveground biomass density is in Mg ha-1; vegetation height is in m
- No data value: -9999
Parquet Files
The parquet files are named boreal_agb_<year>_<datetime>_<tile_num>_train.parquet.
The AGBD parquet files contain the values of aboveground biomass density (Mg ha-1) used to train the random forests models and predictions from the ordinary least squares (OLS) regressions between field measurements and ICESat-2 30-m lidar samples.
The vegetation height parquet files are exactly the same and contain the values of canopy height (RH_98) from ICESat-2 30-m lidar samples used to train the random forest models.
Example file name: boreal_agb_2020_202508191755618676_0003637_train.parquet
Table 1. Variables in the AGBD and height parquet files
| Variable | Units | Description |
|---|---|---|
| lon | degrees east | Longitude of ICESat-2 30 m segment centroid in decimal degrees. |
| lat | degrees north | Latitude of ICESat-2 30 m segment centroid in decimal degrees. |
| AGB | Mg ha-1 | ICEsat-2 estimate of aboveground biomass (AGB) density of woody vegetation in Mg ha-1 |
| SE | Mg ha-1 | Standard error of OLS model between field AGBD and ICESat-2 heights in Mg ha-1 |
| RH_XY | 1 | ICESat-2 ATL08 RH metrics (with RH metrics ranging from RH_25, RH_50, RH_60, RH_70, RH_75, RH_80, RH_85, RH_90, RH_95, and RH_98) |
| segment_landcover | - | ICESat-2 footprint level classification of landcover class |
| model_id | - | The biomass OLS model_id used to create the AGB and SE columns |
Table 2. Mapping between model_id column of Table 1 and biomass OLS models
| model_id | Model file name |
|---|---|
| m1 | predict_DBT_US_fit_DBT_sqrt_sqrt_Snowdon_1.rds |
| m3 | predict_ENT_Eu_fit_ENT_sqrt_sqrt_Snowdon_8.rds |
| m8 | predict_world_coarse_fit_world_sqrt_sqrt_Snowdon_2.rds |
Application and Derivation
These data are essential for understanding patterns of forest structure, including the mass of forest vegetation, its carbon content, and its vertical and horizontal arrangement across managed and unmanaged landscapes. These maps help visualize these patterns, monitor forest conditions, and manage forest carbon stocks and their changes. Their information provides insights into the current conditions and shifts in a global biome that is shaped by natural processes that play out across decades to millennia, as well as human decisions, and whose status and functioning affects wildlife, the climate, economies, and the wellbeing of public and private sector stakeholders both within and outside of the north.
The compilation of these maps is a final value-added step made possible by decades of investment coupled with world-class expertise from the US Government into engineering, space, and earth science. With this long-term investment, NASA and its federal (USGS, NOAA), international, and private sector partners have conceived of, tested, built, launched, collected, calibrated, and processed data from, and maintained a constellation of, earth observation satellites that provide the fundamental measurements used to build these maps.
Quality Assessment
Uncertainty was estimated from bootstrapping the random forest model. Machine learning ensemble modeling produced mean and uncertainty AGDB maps that were estimated using an iterative bootstrapping procedure. This approach iteratively fit training data to predictors to produce a suite of 250 models and maps, which were then summarized to produce pixel-level mean and standard deviation (SD) estimates. The 250 models that were iteratively re-fit for each 90-km2 tile ensured that the variance of the 90-km2 AGBD total stabilized (less than 5% change in the variance of tile total AGBD). The pixel-level SD is calculated as the SD of the set of 250 pixel-level maps from these iterations.
Data Acquisition, Materials, and Methods
Modelling approach
The ATLAS instrument on the ICESat-2 satellite produces vegetation height and ground elevation datasets (ATL03, ATL08) along orbital tracks. These datasets were processed to provide the training data for these mapped products. A derived set of 30-segment ATL08 AGBD estimates was used to train an ensemble model to map AGBD. The same suite of 30-m grid-based contemporaneous multispectral observations and topographic variables were used as the input predictor variables for the AGBD model. The model was developed with local moving windows operating across a 3x3 set of 90-km2 tiles covering the circumpolar mapping domain.
The maps are the result of models linking segment-derived (point-based) ICESat-2 ATL08 observations and grid-based input predictor variables. AGBD is not a direct observation from ICESat-2, it was derived through a two step modelling procedure: (1) regression with ordinary least squares (OLS) to relate field plot measurements of AGBD to simulated ICESat-2 30 m ATL08 vegetation height measurements to predict ICESat-2 AGBD, and (2) machine learning modeling with random forest to extend predictions of ICESat-2 AGBD to wall-to-wall grids of 30-m pixels built from Harmonized Landsat/Sentinel-2 (HLS) and the Copernicus Global 30-m (GLO30) DEM. Per pixel uncertainties were estimated from bootstrapping both models.
Machine learning ensemble modeling produced mean and uncertainty AGDB maps that were estimated using an iterative bootstrapping procedure. This approach iteratively fit training data to predictors to produce a suite of 250 models and maps, which were then summarized to produce pixel-level mean and standard deviation (SD) estimates. The 250 models that were iteratively re-fit for each 90-km tile ensured that the variance of the 90-km AGBD total stabilized (less than 5% change in the variance of tile total AGBD). The pixel-level SD is calculated as the SD of the set of 250 pixel level maps from these iterations. This dataset features predictions for land covers that are associated with the full woody structure gradient according to the European Space Agency’s Worldcover v1.0 2020 dataset (Zanaga et al., 2021). This primarily includes forests, shrubs, and grass extents in which woody vegetation is present. Non-vegetated land covers (e.g. built up, water, rock, ice) were masked out of our predictions. Full methodological details for this product are available in Duncanson et al. (2026).
Input products
Spaceborne lidar and imagery from ICESat-2 ATL08 and HLS composites were contemporaneous from 2020 to produce a single-year 2020 map. ICESat-2 data were filtered to include only strong beams, growing seasons (June through September), solar elevations less than 5 degrees, snow free land (snow flag set to 1), and "msw_flag" equal to 0 (clear skies and no observed atmospheric scattering). ICESat-2's ATL08 product was resampled to a 30-m spatial resolution to better match both the field plots and mapped pixels, which involved reprocessing the nominal 100-m segments to 30-m segments. ICESat-2 observations for some low-stature vegetation land covers on slopes were converted to 0 height and AGBD values to mitigate uncertainties in the version of data used in the modeling.
HLS data (both the L30 and S30 products) were used to create a harmonized (HLSH30) greenest pixel composite using the maximum normalized difference vegetation index (NDVI) of growing season (July-August) multispectral data. This NDVI composite was then used to compute a suite of additional ‘greenest-pixel’ Landsat-class vegetation indices: NDWI, NBR, NBR2, TCW, TCG (https://www.usgs.gov/landsat-missions/landsat-surface-reflectance-derived-spectral-indices; Vermote et al., 2016). These were then used in combination with the fundamental raw six multispectral bands from HLS and a suite of topographic information (elevation, slope, topographic solar radiation index, topographic position index, and a binary slope mask indicating flat pixels) from the Copernicus GLO30 digital elevation model (DEM) product, to predict 30-m AGBD and vegetation height per 90-km2 tile. Estimates of mean AGBD and mean vegetation height with standard deviation are provided in cloud-optimized GeoTIFF (CoG) format.
Output products
The products consist of a set of raster grids and parquet files referenced to a set of 90-km2 tiles that cover the circumpolar boreal domain and south to 51.6°N (Figure 1). Each raster grid is a two-band file where the first and second band represent the mean and standard deviation pixel values that result from the bootstrapped prediction. The parquet files feature the centroid of each ICESat-2 ATL08 30 m segment observation, the RH metrics, landcover class, estimate of AGBD from OLS biomass models, biomass model_id (Table 2) and its SE. This dataset was used in a bootstrap subsampling fashion with subsamples of size 10k as training data in the prediction of each raster grid.
A polygon map of these 90-km2 data tiles is included as a GeoPackage file. This product was generated on the NASA-ESA Multi-Mission Algorithm and Analysis Platform (MAAP, https://scimaap.net), an open science platform. All code and input files are publicly available: https://github.com/lauraduncanson/icesat2_boreal.git.
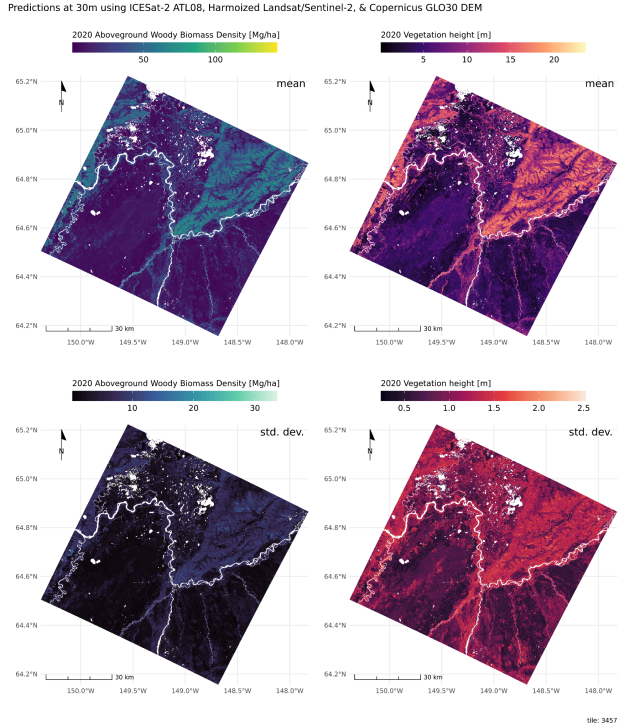
Figure 2. Example 90-km2 tile predictions at 30-m grid resolution of mean and standard deviation of aboveground woody biomass density (left column), mean and standard deviation of vegetation height (right column) derived from ICESat-2 ATL08 30m, Harmonized Landsat/sentinel-2, and Copernicus GLO30 topography for a tile in Alaska. The tiles are projected into a custom Albers equal area coordinate system and shown mapped onto a geographic coordinate system. Vegetation height estimates will be available in a related dataset.
Data Access
These data are available through the Oak Ridge National Laboratory (ORNL) Distributed Active Archive Center (DAAC).
Circumpolar Boreal Forest Aboveground Biomass Density, V3
Contact for Data Center Access Information:
- E-mail: uso@daac.ornl.gov
- Telephone: +1 (865) 241-3952
References
Copernicus WorldDEM-30 DLR e.V. 2010-2014 and Airbus Defence and Space GmbH 2014-2018 provided under COPERNICUS by the European Union and ESA. https://doi.org/10.5270/ESA-c5d3d65
Duncanson, L., P. Montesano, A.L. Neuenschwander, A. Zarringhalam, N. Thomas, D. Minor, M.A. Wulder, J.C. White, E.J. Guenther, T. Feng, and V. Leitold. 2026. Global and Boreal Estimates of Woody Aboveground Biomass for 2020: Filling GEDI’s Northern Data Gap with ICESat-2 and Harmonized Landsat Sentinel. Remote Sensing of Environment (in press).
Feng, T., L. Duncanson, P. Montesano, S. Hancock, D. Minor, E. Guenther, and A. Neuenschwander. 2023. A systematic evaluation of multi-resolution ICESat-2 ATL08 terrain and canopy heights in boreal forests. Remote Sensing of Environment 291:112570. https://doi.org/10.1016/j.rse.2023.113570
Neuenschwander, A., L. Duncanson, P. Montesano, D. Minor, E. Guenther, S. Hancock, M.A. Wulder, J.C. White, M. Purslow, N. Thomas, A. Mandel, T. Feng, J. Armston, J.R. Kellner, H.E. Anderson, L. Boschetti, P. Fekety, A. Hudak, J. Pisek, N. Sanchez-Lopez, and K. Sterenczak. 2024. Towards global spaceborne lidar biomass: Developing and applying boreal forest biomass models for ICESat-2 laser altimetry data. Science of Remote Sensing 10:100150. https://doi.org/10.1016/j.srs.2024.100150
Vermote, E., C. Justice, M. Claverie, and B. Franch. 2016. Preliminary analysis of the performance of the Landsat 8/OLI land surface reflectance product. Remote Sensing of Environment 185:46-56. https://doi-org.ornl.idm.oclc.org/10.1016/j.rse.2016.04.00
Zanaga, D., R. Van De Kerchove, W. De Keersmaecker, N. Souverijns, C. Brockmann, R. Quast, J. Wevers, A. Grosu, A. Paccini, S. Vergnaud, O. Cartus, M. Santoro, S. Fritz, I. Georgieva, M. Lesiv, S. Carter, M. Herold, L. Li, N.E. Tsendbazar, F. Ramoino, and O. Arino. 2021. ESA WorldCover 10 m 2020 v100. Zenodo. https://doi.org/10.5281/zenodo.5571936
Dataset Revisions
|
Version |
Release Date | Description |
|---|---|---|
| 3 | 2026-04-10 | Vegetation height estimates, formerly included in version 3, were removed and will be available in a future related dataset. |
| 3 | 2025-12-10 |
For the ORNL DAAC, this is 2nd release (Version 2) of this dataset. This dataset provides all updates from the release of Version 3.1 from the research team. This update includes...
|
| 2 | - | There is no published version 2 of this dataset. |
| 1 | 2023-08-23 | Original publication |