Documentation Revision Date: 2026-04-21
Dataset Version: 1
Summary
There are two data files in comma separated values format.
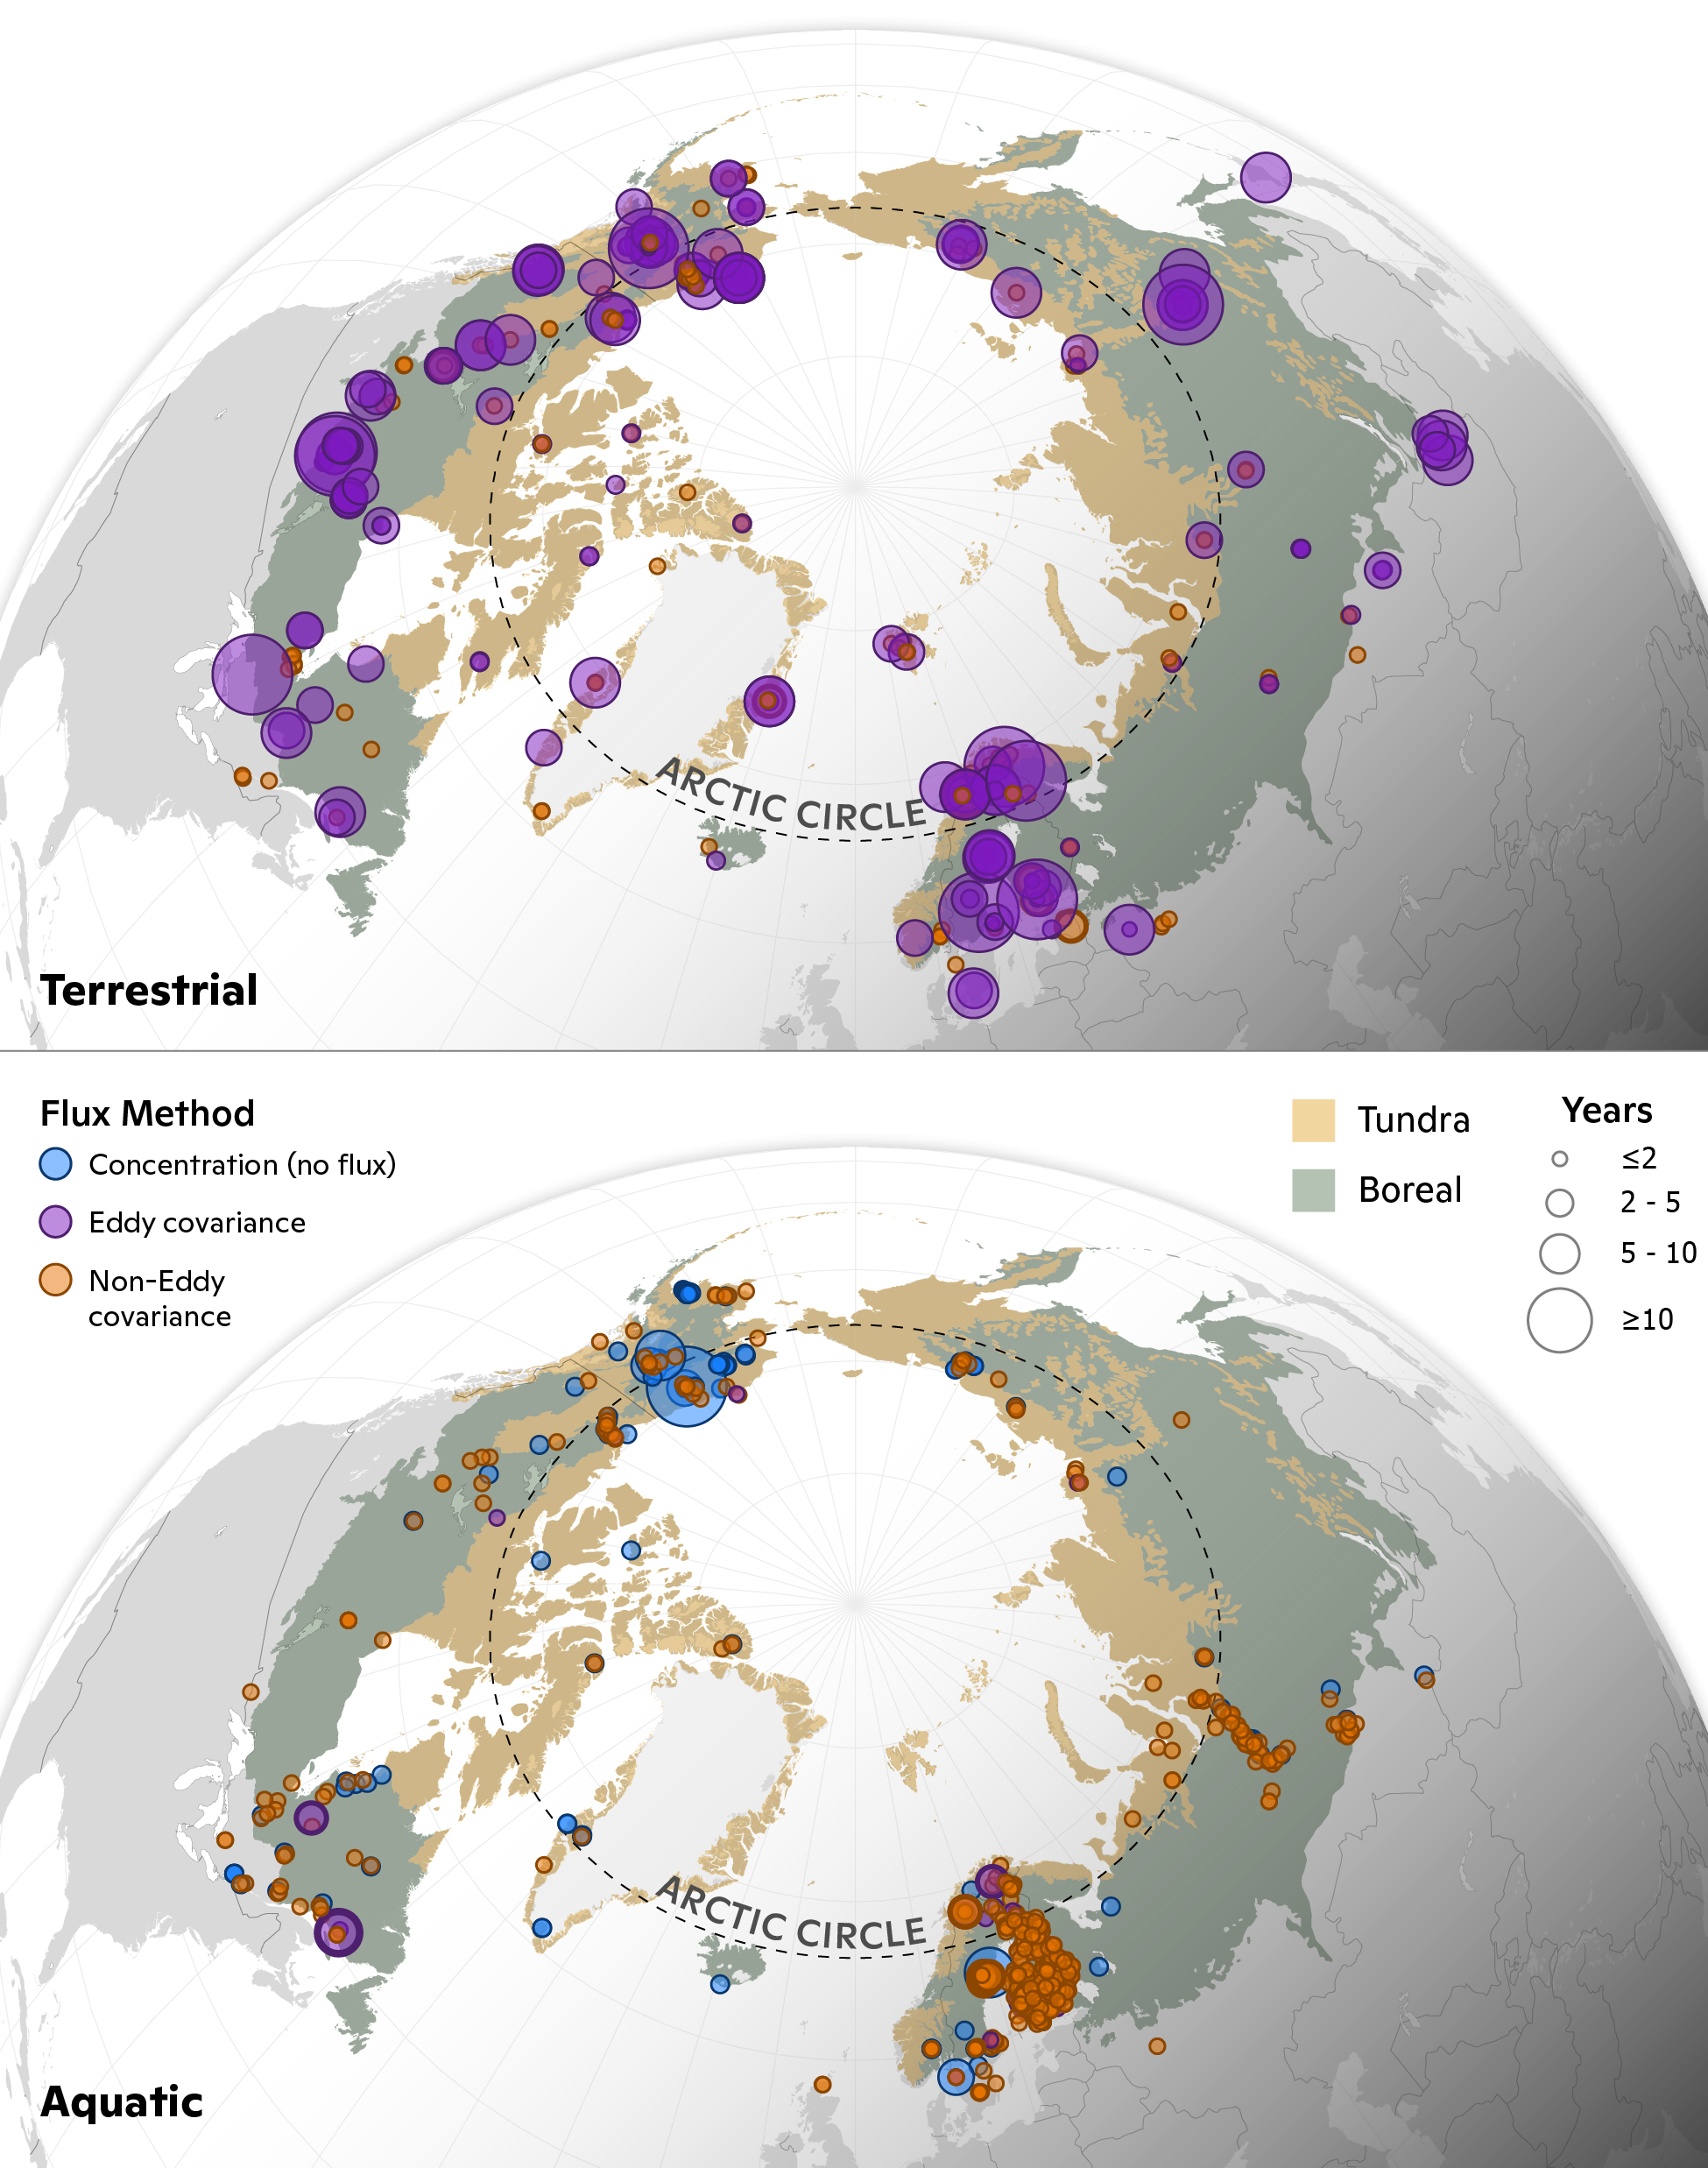
Figure 1. Numbers of site-months for terrestrial CO2 and CH4 flux sites, and aquatic CO2 and CH4 flux sites across the Arctic-boreal region. The number of months represented by circles refers to total, not necessarily consecutive.
Citation
Virkkala, A-M., I. Wargowsky, J. Vogt, M. Kuhn, S. Madaan, R. O'Keefe, T. Windholz, K.A. Arndt, B. Rogers, J.D. Watts, M. Goeckede, E.A.G. Schuur, G. Rocher-Ros, D. Bastviken, D. Olefeldt, K. Kent, K. Aalstad, K. Aho, J. Ala-Konni, H. Alcock, I. Althuizen, C.D. Arp, J. Asanuma, K. Attermeyer, M. Aurela, S. Balathandayuthabani, A. Barr, M. Barret, O. Batkhishig, C. Biasi, M.P. Bjorkman, T.A. Black, E. Blanc-Betes, P. Bodmer, J. Boike, A. Bolek, F. Bouchard, I. Bussmann, L. Cabrol, E. Canfora, S. Carey, K. Castro-Morales, N. Chae, A. Christen, T.R. Christensen, C.T. Christiansen, H. Chu, G. Clark, F. Clayer, P.M. Crill, C. Cunada, S.J. Davidson, J.F. Dean, S. Dengel, M. Detto, C. Dieleman, F. Domine, E. Dyukarev, C. Edgar, B. Elberling, C.A. Emmerton, S.E. Euskirchen, G. Falvo, T. Friborg, M. Garneau, M. Giamberini, M.V. Glagolev, M.A. Gonzalez-Meler, G. Granath, J. Gudmundsson, K. Happonen, Y. Harazono, L. Harris, J. Hashemi, N. Hasson, J. Heerah, L. Heffernan, M. Helbig, W. Helgason, M. Heliasz, G. Henry, G. Hensgens, T. Hiyama, M. Hock, D. Holl, B. Holmes, J. Holst, T. Holst, G. Hould-Gosselin, E. Humphreys, J.K.Y. Hung, J. Huotari, H. Ikawa, D.V. Ilyasov, M. Ishikawa, G. Iwahana, H. Iwata, M.A. Jackowicz-Korczynski, J. Jansen, J. Jarveoja, V.E. Jassey, R. Jensen, K. Jentzsch, R.G. Jespersen, C. Johannesson, C.P. Jones, A. Jonsson, J.Y. Jung, S. Juutinen, E.S. Kane, J. Karlsson, S. Karsanaev, K. Kasak, J. Kelly, K. Kempton, M. Klaus, G.W. Kling, N. Kljun, J. Knutson, H. Kobayashi, J. Kochendorfer, K. Kohonen, P. Kolari, M. Korkiakoski, A. Korrensalo, P. Kortelainen, E. Koster, K. Koster, A. Kotani, P. Krishnan, J. Kurbatova, L. Kutzbach, M.J. Kwon, E.D. Kyzivat, J. Lagroix, T. Langhorst, E. Lapshina, T. Larmola, K. Larsen, I. Laurion, J. Ledman, H. Lee, A.J. Leffler, L. Lesack, A. Lindroth, D. Lipson, A. Lohila, E. Lopez-Blanco, V.L. St. Louis, E. Lundin, M. Luoto, T. Machimura, M. Magnani, A. Malhotra, M. Maljanen, I. Mammarella, E. Mannisto, L.B. Marchesini, P. Marsh, P.J. Martkainen, M.E. Marushchak, M. Mastepanov, A. Mavrovic, T. Maximov, C. Minions, M. Montemayor, T. Morishita, P. Murphy, D.F. Nadeau, E. Nicholls, M.B. Nilsson, A. Niyazova, J. Norden, K.D. Noumonvi, H. Nykanen, W. Oechel, A. Ojala, T. Okadera, S. Pal, A.V. Panov, T. Papakyriakou, D. Papale, S.J. Park, F. Parmentier, G. Pastorello, M. Peacock, M. Peichl, R. Petrov, K.S. Pierre, N. Pirk, J. Plein, V. Preskienis, A. Prokushkin, J. Pumpanen, H.A. Rains, N. Rakos, A. Rasanen, H. Rautakoski, R. Rinnan, J. Rinne, A.V. Rocha, N.T. Roulet, A. Roy, A. Rutgersson, A.F. Sabrekov, T. Sachs, E. Sahlee, A. Salazar, H.O. Sawakuchi, C. Schulze, R. Seco, A. Sepulveda-Jauregui, S. Serikova, A. Serrone, H.M. Silvennoinen, S. Sjogersten, J. Skeeter, J. Snoalv, S. Sobek, O. Sonnentag, E.H. Stanley, M. Strack, L. Strom, P. Sullivan, R.C. Sullivan, A. Sytiuk, T. Tagesson, P. Taillardat, J. Talbot, S.E. Tank, M. Tenuta, I. Terenteva, F. Thalasso, A. Thiboult, H. Thorgeirsson, F.G. Tigreros, M. Torn, A. Townsend-Small, C. Treat, A. Tremblay, C. Trotta, E.-S. Tuittila, M. Turetsky, M. Ueyama, M. Umair, A. Vaha, L. van Delden, M. van Hardenbroek, A. Varlagin, R.K. Varner, E. Veretennikova, T. Vesala, T. Virtanen, C. Voigt, J.E. Vonk, R. Wagner, K. Walter Anthony, Q. Wang, M. Watanabe, H. Webb, J. M. Welker, A. Westergaard-Nielsen, S. Westermann, J.R. White, C. Wille, S.N. Williamson, S. Zolkos, D. Zona, and S.M. Natali. 2025. ABCFlux v2: Arctic-Boreal CO2 and CH4 In-situ Flux and Environmental Data. ORNL DAAC, Oak Ridge, Tennessee, USA. https://doi.org/10.3334/ORNLDAAC/2448
Table of Contents
- Dataset Overview
- Data Characteristics
- Application and Derivation
- Quality Assessment
- Data Acquisition, Materials, and Methods
- Data Access
- References
- Dataset Revisions
Dataset Overview
This dataset is a synthesis of terrestrial and freshwater CO2 and CH4 fluxes from the Arctic-Boreal region aggregated to monthly timesteps. The dataset, known as ABCFlux v2, includes 1,024 unique sites and spans 1984-2024 with the majority of observations occurring after 1999. ABCFlux v2 includes surface-atmosphere CO2 fluxes of net ecosystem exchange (NEE), gross primary production (GPP), and ecosystem respiration (Reco) alongside CH4 fluxes. For aquatic ecosystems, CH4 fluxes were split into diffusive and ebullitive flux pathways and included potential emissions from transient storage in the water column, alongside CO2 and CH4 concentrations dissolved in the surface water. Fluxes were measured through a variety of methods including chamber and eddy covariance techniques alongside bubble traps, ice-surveys, and concentration-based turbulence-driven modelling in aquatic ecosystems. Supporting variables include methodological metadata (e.g., gap-filling methods, number of chamber measurement days), environmental measurements (e.g., air, water, and soil temperatures), and site-level attributes (e.g., permafrost thaw status, disturbance history).
Compared with version 1, this v2 dataset includes additional variables to represent detailed descriptions of plant functional types, deep soil temperatures (<10 cm), and permafrost thaw presence or absence in the top two meters. Data pertaining to CH4 fluxes were also added that were not included in previous version. Data for aquatic and terrestrial sites are provided in separate files.
Project: Arctic-Boreal Vulnerability Experiment
The Arctic-Boreal Vulnerability Experiment (ABoVE) is a NASA Terrestrial Ecology Program field campaign being conducted in Alaska and western Canada, for 8 to 10 years, starting in 2015. Research for ABoVE links field-based, process-level studies with geospatial data products derived from airborne and satellite sensors, providing a foundation for improving the analysis, and modeling capabilities needed to understand and predict ecosystem responses to, and societal implications of, climate change in the Arctic and Boreal regions.
Related Publication
Virkkala, A-M., I. Wargowsky, J. Vogt, M. Kuhn,, et al. 2025. ABCFlux v2: Arctic–boreal CO2 and CH4 monthly flux observations and ancillary information across terrestrial and freshwater ecosystems, Earth System Science Data Discuss. [preprint], https://doi.org/10.5194/essd-2025-585
Related Dataset
Virkkala, A-M., S. Natali, B.M. Rogers, J.D. Watts, K. Savage, S.J. Connon, M.E. Mauritz-tozer, E.A.G. Schuur, D.L. Peter, C. Minions, J. Nojeim, R. Commane, C.A. Emmerton, M. Goeckede, M. Helbig, D. Holl, H. Iwata, H. Kobayashi, P. Kolari, E. Lopez-Blanco, M.E. Marushchak, M. Mastepanov, L. Merbold, M. Peichl, O. Sonnentag, T. Sachs, M. Ueyama, C. Voigt, M. Aurela, J. Boike, G. Celis, N. Chae, T. Christensen, S. Bret-Harte, S. Dengel, H. Dolman, C. Edgar, B. Elberling, S.E. Euskirchen, A. Grelle, J. Hatakka, E.R. Humphreys, J. Jarveoja, A. Kotani, L. Kutzbach, T. Laurila, A. Lohila, I. Mammarella, Y. Matsuura, G. Meyer, M.B. Nilsson, S.F. Oberbauer, S.J. Park, F.J.W. Parmentier, R. Petrov, A.S. Prokushkin, S. Zyrianov, C. Schulze, V.L. St.louis, E.S. Tuittila, J.P. Tuovinen, W. Quinton, A. Varlagin, D. Zona, and V.I. Zyryanov. 2021. The ABCflux Database: Arctic-Boreal CO2 Flux and Site Environmental Data, 1989-2020. ORNL DAAC, Oak Ridge, Tennessee, USA. https://doi.org/10.3334/ORNLDAAC/1934
- Version 1 of this dataset
Acknowledgments
This research was funded by the NASA Arctic-Boreal Vulnerability Experiment (ABoVE) and Carbon Cycle Science programs (grants 80NSSC22K1245, NNX17AE13G).
Data Characteristics
Spatial Coverage: Arctic boreal sites in Alaska, Canada, Estonia, Finland, Greenland, Iceland, Japan, Mongolia, Norway, Russia, Scotland, and Sweden.
ABoVE Reference Locations Domain
Core ABoVE State/Territory: Alaska and Canada
Grid cells (5 m): Ch079v093, Ch076v096, Ch024v013, Ch093v101, Ch048v021, Ch036v033, Ch089v059, Ch165v028, Ch039v032, Ch051v020, Ch053v017, Ch050v018, Ch048v020, Ch108v096, Ch108v095, Ch107v095, Ch105v093, Ch091v102, Ch050v007, Ch050v020, Ch052v019, Ch069v067, Ch099v023, Ch211v004, Ch041v032, Ch040v032, Ch051v019, Ch043v023, Ch042v030, Ch045v023, Ch040v028, Ch041v026, Ch047v022, Ch049v020, Ch052v018, Ch046v022, Ch094v102, Ch049v007, Ch156v057, Ch133v030, Ch011v017, Ch179v042, Ch164v110, Ch147v121, Ch048v019, Ch046v008, Ch040v029, Ch042v032, Ch092v099, Ch092v100, Ch091v101, Ch095v105, Ch069v059, Ch065v034, Ch083v090, Ch070v066, Ch064v035, Ch067v050, Ch159v102, Ch034v010, Ch078v095, Ch040v038, Ch040v037, Ch038v033, Ch042v015
Spatial Resolution: Point
Temporal Coverage: 1984-05-01 to 2024-12-31
Temporal Resolution: Monthly
Study Area: Latitude and longitude are given in decimal degrees.
| Region | Westernmost Longitude | Easternmost Longitude | Northernmost Latitude | Southernmost Latitude |
|---|---|---|---|---|
| Arctic boreal sites | -165.833 | 161.843 | 82.8226 | 43.323 |
Data File Information
There are two data files in comma separated values (.csv) format:
Arctic_Boreal_CO2_Flux_V2_Aquatic.csv
Arctic_Boreal_CO2_Flux_V2_Terrestrial.csv
Missing values are noted as -9999 or NA for numeric and string variables, respectively.
Table 1. Variables in both CSV files.
| Variable | Unit | Description |
|---|---|---|
| site_name | - | Site name as specified in data source (e.g., Hyytiälä) |
| site_reference | - | A more specific name used in data source, for example the name of the chamber plot (e.g. shrub) or the abbreviation used in eddy covariance data repositories (e.g. FI-Hyy). |
| data_contributor_or_author | - | Data contributor(s) or primary author(s) associated with data set or publication |
| - | Primary author email(s) | |
| extraction_source | - | Data source where data were extracted and compiled: publication, Fluxnet2015, Fluxnet-CH4, Icos, Euroflux, Ameriflux, User-contributed, BAWLD-CH4, ABCflux_V1 |
| citation | - | Citation for the data source: journal article, data citation, and/or other source (online repository link etc.). If the user contributed unpublished data, a journal article citation describing already published data can be added here. |
| country | - | Country of the study site |
| latitude | degrees north | Latitude of study site, as detailed as possible, in decimal degrees |
| longitude | degrees east | Longitude of study site, as detailed as possible, in decimal degrees |
| year | YYYY | Year in which data were recorded |
| month | MM | Measurement month |
| CH4_flux_total | g C m-2 month-1 | Monthly cumulative total CH4 flux for the entire measurement interval. Negative flux represents a net sink to the ecosystem. |
| CH4_flux_total_seasonal | g C m-2 season-1 | Cumulative CH4 total flux in a seasonal format (e.g. June 3rd to August 25th). This column is filled only if monthly data are not available. |
| tair | degrees C | Monthly mean air temperature |
| tair_height | m | Height of the air temperature measurement |
| precip | mm | Monthly cumulative precipitation mm |
| snow_depth | cm | Mean snow depth during the measurement interval |
| ppfd | µmol m-2 s-1 | Mean photosynthetically active radiation during measurement interval (in Photosynthetic Photon Flux Density, PPFD) |
| flux_method | - | Broad categories for how flux values were measured: EC, Chamber, Snow diffusion, Ebullition, Concentration, Concentration (no flux) |
| flux_method_detail | - | Details related to how flux values were measured. Specifies between manual vs. automated chambers, snow diffusion, open vs. closed-path eddy covariance, water sampling, ebullition trap, ice sampling |
| flux_method_description | - | Details related to measurement method, e.g. chamber size/volume and deployment time, tubing length, use of bubble shield or not, height of the tower and wind measurements. |
| gap_fill | - | Approach used to gap-fill the data |
| tower_corrections | - | Details related to processing corrections employed, including time, duration, and thresholds for u* and heat corrections |
| diurnal_coverage | - | Indicator whether data was collected during the day or during day and night: Day, Day and Night |
| instrumentation | - | Description of instrumentation used (e.g. type of greenhouse gas analyzer) |
| gap_fill_perc_CO2 | percent | Percent of eddy covariance or automated chamber CO2 (nee, CO2_flux) data that was gap-filled in the measurement interval (relative to standard measurement time step) |
| gap_fill_perc_CH4 | percent | Percent of eddy covariance or automated chamber CH4 data that was gap-filled in the measurement interval (relative to standard measurement time step) |
| chamber_nr_measurement_days_CO2 | d | Number of days with chamber measurement of CO2 within the measurement interval (month) |
| chamber_nr_measurement_days_CH4 | d | Number of days with chamber measurements of CH4 within the measurement interval (month) |
| CH4_flux_seasonal_interval | YYYY-MM-DD | The period for the seasonal CH4 flux estimate (e.g. 2012-06-09 to 2012-07-03). |
| expert_flag_CO2 | - | 0: no known issues, 1: terrestrial fluxes outside the 1st and 99th percentiles, aquatic lentic fluxes outside the 99th percentiles, 2: terrestrial non-eddy covariance growing season measurements with three or less measurement days in the month and no modeling used to gap fill, 3: terrestrial eddy covariance data with three or more consecutive months of 100% gapfilling, 4: site does not represent typical environmental conditions of the Arctic Boreal Zone |
| expert_flag_CH4 | - | 0: no known issues, 1: terrestrial fluxes greater than 30 g C m-2 month-1, aquatic lentic fluxes outside the 99th percentiles, 2: terrestrial non-eddy covariance growing season measurements with 3 or less measurement days in the month and no modeling used to gap fill, 3: terrestrial eddy covariance data with three or more consecutive months of 100% gapfilling, 4: site does not represent typical environmental conditions of the Arctic Boreal Zone |
| biome | - | Biome of the study site: Tundra, Boreal, Temperate |
| land_cover_eco | - | Dominant land cover class for the site following expert assignment and using class names of the ESA CCI land cover product (ESA, 2017; documentation; section 9.1, global classification, page 81): 40=Mosaic natural vegetation (tree, shrub, herbaceous cover) (>50%) / cropland (<50%); 60=Tree cover, broadleaved, deciduous; 70=Tree cover, needleleaved, evergreen; 80=Tree cover, needleleaved, deciduous; 90=Tree cover, mixed leaf type (broadleaved and needleleaved); 100=Mosaic tree and shrub (>50percent) / herbaceous cover (<50%); 110=Mosaic herbaceous cover (>50percent) / tree and shrub (<50%); 120=Shrubland; 121=Shrubland evergreen; 122=Shrubland deciduous; 130=Grassland; 140=Lichens and mosses; 150=Sparse vegetation (tree, shrub, herbaceous cover) (<15%); 151=Sparse tree (<15%); 152=Sparse shrub (<15%); 153=Sparse herbaceous cover (<15%); 160=Tree cover, flooded, fresh or brackish water; 170=Tree cover, flooded, saline water; 180=Shrub or herbaceous cover, flooded, fresh/saline/brakish water; 200=Bare areas; 210=Waterbodies |
| land_cover_plot | - | Dominant land cover class for plot using same codes as land_cover_eco |
| bawld_class | - | Dominant ecosystem class for the site following Boreal-Arctic Wetland-Lake Database (BAWLD) classes (Olefeldt et al., 2021): Bog, Fen, Marsh, Permafrost Bog, Wet Tundra, Dry Tundra, Moist Tundra, Boreal Forest, Rocklands, Large Lake, Midsize Glacial Lake, Small Glacial Lake, Midsize Peatland Lake, Small Peatland Lake, Midsize Yedoma Lake, Small Yedoma Lake, Large River, Small Organic-Rich River, Small Organic-Poor River |
| veg_detail | - | Detailed vegetation description from data source/contributor, incl. dominant species and a description of vegetation changes at the site. In an aquatic site, this should have information on both the terrestrial and aquatic plants. |
| permafrost | - | Reported presence or absence of permafrost: Yes, No |
| permafrost_thaw | - | Permafrost thaw present: Yes, No |
| thaw_category | - | Broad category for types of thaw : Active layer thickening with subsidence, Active layer thickening without subsidence, Active layer thickening with talik formation, Ice-wedge degradation, Thaw lake/pond expansion, Wetland collapse, Active layer detachment sliding, Retrogressive thaw slumping |
| thaw_dominant | - | Dominant type of thaw. If multiple categories were chosen in thaw_category, thaw_extent and thaw_severity primarily refer to the type of thaw listed here : Active layer thickening with subsidence, Active layer thickening without subsidence, Active layer thickening with talik formation, Ice-wedge degradation, Thaw lake/pond expansion, Wetland collapse, Active layer detachment sliding, Retrogressive thaw slumping |
| thaw_extent | - | Spatial extent of thaw within the site (i.e. tower footprint, chamber/sampling plot, drainage basin for aquatic ecosystems): 0-33%, 34-66%, 67-100% |
| thaw_severity | - | Severity of dominant type of thaw: Low: Change to the ecosystem that is temporary or does not have substantial impact on ecosystem identity or function, Moderate: Change to the ecosystem that is temporary but has a substantial impact on ecosystem function, High: Change to the ecosystem that is lasting with consequences for ecosystem identity and function |
| landform | - | Description of the geomorphological landforms associated with the site. E.g., polygonal features, palsas, cryoturbation, abrupt thaw features, drained lake basins. |
| disturbance | - | Description of the recent disturbance history of the site or list "No" if there are no disturbances. Note that the disturbance might have been caused due to natural reasons (e.g. fire) and/or due to anthropogenic influences (e.g. drained peatland, harvested forest). If several disturbances have occurred during the recent decades, these can all be listed here but please list the last dominant disturbance first. |
| disturbance_category | - | Broad categories for disturbances: Altered hydrology, Animal herbivory, Artificial pond, Beavers, Drained lake, Drainage, Erosion, Extreme weather, Fire, Forestry, Human paths, Insect herbivory, Land use change, None, Other, Peat mining, Reservoir, Roads, Seismic lines, Thaw, Tidal effects, Wastewater |
| disturb_dominant | - | Dominant disturbance of the site. If multiple categories are listed in disturbance category, disturb_extent and disturb_severity primarily refer to the disturbance listed here: Animal herbivory, Artificial pond, Beavers, Drained lake, Drainage, Erosion, Erosion/Thaw, Extreme weather, Fire, Forestry, Human paths, Insect herbivory, Land use change, None, Other, Reservoir, Roads, Seismic lines, Thaw, Wastewater |
| disturb_year | - | Year of last dominant disturbance: Numeric variable (year), 0 = annual (e.g., annual grazing, annual nutrient additions) |
| disturb_severity | - | Relative severity of last dominant disturbance: Low: Change to the ecosystem that is temporary or does not have substantial impact on ecosystem identity or function, Moderate: Change to the ecosystem that is temporary but has a substantial impact on ecosystem function, High: Change to the ecosystem that is lasting with consequences for ecosystem identity and function |
| disturb_extent | - | Spatial extent of the dominant disturbance within the site (i.e. tower footprint, chamber/sampling plot, drainage basin for aquatic ecosystems): 0-33%, 34-66%, 67-100% |
| site_activity | - | The current flux measurement activity status of the site (i.e., measurements conducted each year).: Active, Non-active |
| data_usage | - | Instruction of data usage: Tier1 = data are open and free for scientific and educational purposes, Tier2 = data producers must have opportunities to collaborate and consult with data users, Other (please specify) |
| data_version | - | Version number for data extracted from repositories or version number given by the data contributor based on their version tracking |
| notes | - | Additional information about record |
| id | - | Record ID number |
Table 2. Variables in Arctic_Boreal_CO2_Flux_V2_Aquatic.csv only.
| Variable | Unit | Description |
|---|---|---|
| CO2_flux | g C m-2 month-1 | Monthly cumulative CO2 flux for the entire measurement interval. Refers to aquatic fluxes only where fluxes are commonly not partitioned between photosynthesis and respiration. Negative flux represents a net sink. |
| CO2_flux_ebullition | g C m-2 month-1 | Monthly cumulative ebullitive CO2 flux for the entire measurement interval |
| CH4_flux_ebullition | g C m-2 month-1 | Monthly cumulative ebullitive CH4 flux for the entire measurement interval |
| CH4_flux_diffusion | g C m-2 month-1 | Monthly cumulative diffusive CH4 flux for the entire measurement interval |
| CH4_flux_storage | g C m-2 month-1 | Monthly cumulative storage CH4 flux for the entire measurement interval. Storage flux is a diffusion flux but can be measured separately and is separated here because of its non-continuous rapid burst emission nature. |
| CO2_flux_storage | g C m-2 month-1 | Monthly cumulative storage CO2 flux for the entire measurement interval. Storage flux is a diffusion flux but can be measured separately and is separated here because of its non-continuous rapid burst emission nature. |
| CO2_flux_seasonal | g C m-2 season-1 | Cumulative CO2 lux from freshwater systems in a seasonal format (e.g. June 3rd to August 25th). This column is filled only if monthly data are not available. Negative flux represents a net sink. |
| CH4_flux_ebullition_seasonal | g C m-2 season-1 | Cumulative CH4 flux from ebullition in a seasonal format (e.g. June 3rd to August 25th). This column is filled only if monthly data are not available. |
| CH4_flux_diffusion_seasonal | g C m-2 season-1 | Cumulative CH4 flux from diffusion in a seasonal format (e.g. June 3rd to August 25th). This column is filled only if monthly data are not available. |
| ebullition_nr_measurement_days_CO2 | d | Number of days with ebullition measurements of CO2 within the measurement interval (month) |
| ebullition_nr_measurement_days_CH4 | d | Number of days with ebullition measurements of CH4 within the measurement interval (month) |
| CO2_flux_seasonal_interval | YYYY-MM-DD | The period for the seasonal CO2 flux estimate (e.g. 2012-06-09 to 2012-07-03). |
| waterbody_type | - | Type of waterbody: Lentic (standing water) or Lotic (flowing water) |
| aquatic_site_sampling_location | - | The locations of the measurements within the waterbody: Edge, Center, Both |
| water_body_trophic_status | - | Trophic state classification describing the productivity of a lentic waterbody: Oligotrophic, Mesotrophic, Eutrophic |
| water_area | m2 | Area of lentic waterbody |
| water_depth | m | Mean, maximum or point-level depth of a lentic or lotic waterbody |
| water_depth_location | - | Description representing the location of the water depth measurement: Mean, Sampling location, Maximum |
| water_ph | 1 | Mean pH at water surface during the measurement interval |
| water_n | mg L-1 | Mean total nitrogen at water surface during the measurement interval |
| water_p | mg L-1 | Mean total phosphorus at water surface during the measurement interval |
| water_doc | mg L-1 | Mean dissolved organic carbon content at water surface during the measurement interval |
| water_iceon | YYYY-MM-DD | Ice-on date |
| water_iceoff | YYYY-MM-DD | Ice-off date |
| water_temperature | degrees C | Mean surface water temperature during the measurement interval |
| benthic_veg | - | Is benthic vegetation occurring at the site: Yes, No |
| emergent_veg | - | Details related to the emergent vegetation |
| sediment | - | Sediment type: Minerogenic, Organic, Peat, Yedoma, Unspecified |
| water_chlorophyll | mg L-1 | Mean concentration of chlorophyll at water surface during the measurement interval |
| water_do | mg L-1 | Mean dissolved oxygen at water surface during the measurement interval |
| water_CO2 | µmol L-1 | Mean dissolved CO2 concentration at water surface during the measurement interval |
| water_CH4 | µmol L-1 | Mean dissolved CH4 concentration at water surface during the measurement interval |
| water_turbidity | FNU | Mean turbidity of the water during the measurement interval: FNU (Formazin Nephelometric Unit) |
| water_conductivity | µS cm-1 | Mean electrical conductivity at water surface during the measurement interval |
| k600 | cm h-1 | Gas transfer velocity normalized to a Schmidt number of 600 |
| k600_equation | - | Equation used to determine gas transfer velocity (k600) |
| k600_method | - | Method used to determine gas transfer velocity (k600) |
| stream_discharge | m3 s-1 | Stream discharge of lotic waterbody |
| stream_velocity | m s-1 | Stream velocity of lotic waterbody |
| water_mixing_regime | - | Mixing regime of lentic waterbody to indicate the frequency of mixing throughout the year (once = monomictic, twice = dimictic, multiple times = polymictic): Monomictic, Dimictic, Polymictic |
| strahler_order | - | Strahler order of lotic waterbody to define stream size |
| fetch_screening | - | Indicator whether fetch screening was applied: Yes, No, Unknown |
| fetch_detail | - | Details about fetch screening |
| air_CO2 | ppmv | Mole fraction of CO2 in the air above water surface during the measurement interval |
| air_CH4 | ppbv | Mole fraction of CH4 in the air above water surface during the measurement interval |
| water_d13CH4 | 0.001 | Ratio of stable carbon isotopes of CH4 at water surface during the measurement interval in per mille |
| water_d13CO2 | 0.001 | Ratio of stable carbon isotopes of CO2 at water surface during the measurement interval in per mille |
| isotopic_analysis_detail | - | Details regarding the isotopic analysis, e.g. determined from dissolved gas or ebullition |
Table 3. Variables in Arctic_Boreal_CO2_Flux_V2_Terrestrial.csv only.
| Variable | Unit | Description |
|---|---|---|
| nee | g C m-2 month-1 | Monthly cumulative net ecosystem exchange (NEE) for the entire measurement interval in g C in CO2. Negative flux represents a net sink to the ecosystem. |
| gpp | g C m-2 month-1 | Monthly cumulative gross primary productivity (GPP) for the entire measurement interval in g C in CO2. Note: GPP is presented as positive (uptake) values. |
| reco | g C m-2 month-1 | Monthly cumulative Ecosystem respiration (Reco) for the entire measurement interval in g C in CO2 |
| nee_seasonal | g C m-2 season-1 | Cumulative NEE flux in a seasonal format (e.g. June 3rd to August 25th). This column is filled only if monthly data are not available. Negative flux represents a net sink. |
| tsoil_surface | degrees C | Monthly mean surface soil temperature in ca. 0-10 cm depth |
| tsoil_surface_depth | cm | Depth of the surface soil temperature measurement |
| tsoil_deep | degrees C | Monthly mean deeper soil temperature at > 10 cm depth |
| tsoil_deep_depth | cm | Depth of the deeper soil temperature measurement |
| soil_moisture | percent | Monthly mean surface soil moisture in ca. 0-10 cm depth in volumetric water content (VWC, percent) |
| moisture_depth | cm | Depth for the surface soil moisture measurement |
| thaw_depth | cm | Mean thaw depth during the measurement interval. Positive values represent depth below the soil surface. |
| alt | cm | Active layer thickness (maximum thaw depth). Thickness changes annually. Positive values represent depth below the soil surface. |
| water_table_depth | cm | Mean water table depth during the measurement interval; positive is below the surface, negative is above (inundated) |
| partition_method | - | Method used to partition NEE into GPP and RECO: Reichstein (night time=Reco partitioning), Lasslop (bulk/day-time partitioning), Reco_measured, GPP=Reco-NEE (primarily at chamber sites), Neural Network, Other |
| nee_seasonal_interval | YYYY-MM-DD | The period for the seasonal NEE estimate (e.g. 2012-06-09 to 2012-07-03). |
| expert_flag_gpp | - | 0: no known issues, 1: terrestrial fluxes outside the 1st and 99th percentiles |
| expert_flag_reco | - | 0: no known issues, 1: terrestrial fluxes outside the 1st and 99th percentiles |
| dec_shrub | - | Are deciduous shrubs absent, present, or dominant: Absent, Present, Dominant Examples of deciduous shrubs: Betula nana, Salix sp, Vaccinium uliginosum, Vaccinium myrtillus, Rubus chamaemorus |
| ev_shrub | - | Are evergreen shrubs absent, present, or dominant: Absent, Present, Dominant. Examples of evergreen shrubs: Empetrum sp, Cassiope sp, Loiseleuria sp, Vaccinium vitis-idaea, Rhododendron sp, Phyllodoce caerulea, and Dryas octopetala |
| sedge | - | Are sedges absent, present, or dominant: Absent, Present, Dominant |
| non_sedge_herbaceous | - | Are grasses, rushes and forbs absent, present, or dominant: Absent, Present, Dominant |
| ev_needle_tree | - | Are evergreen needleleaf trees absent, present, or dominant: Absent, Present, Dominant |
| dec_needle_tree | - | Are deciduous needleleaf trees absent, present, or dominant: Absent, Present, Dominant |
| dec_broad_tree | - | Are deciduous broadleaf trees absent, present, or dominant: Absent, Present, Dominant |
| sphagnum_cover | - | Are Sphagnum mosses absent, present, or dominant: Absent, Present, Dominant |
| other_moss_cover | - | Are other mosses (non-Sphagnum) mosses absent, present, or dominant: Absent, Present, Dominant |
| canopy_height | m | The height of the vegetation canopy |
| soil_moisture_class | - | General descriptor of site moisture: Wet = At least sometimes inundated or water table close to surface, Dry = well-drained, Moist = in between wet and dry |
| forest_age | y | Forest age since last disturbance (anthropogenic/natural) in years |
| soil_depth | cm | Soil organic layer depth |
| soil_ph | 1 | Surface soil pH in ca. 0-10 cm depth |
| soil_perc_c | percent | Surface soil C % in ca. 0-10 cm depth |
| soil_perc_n | percent | Surface soil N % in ca. 0-10 cm depth |
| c_stock | kg C m-2 | Soil organic carbon stock, ideally for the entire soil profile. |
| stock_depth | cm | Soil depth used in the stock calculation. |
| soil_type_detail | - | Soil type description |
| lai | m-2 m-2 | Leaf area index |
| ndvi | 1 | Normalized difference vegetation index |
Application and Derivation
ABCFlux v2 could be useful to empirical, remote sensing, and modeling studies to improve understanding of the regional and temporal variability in CO2 fluxes, and to better estimate the terrestrial Arctic Boreal Zone CO2 budget (Virkkala et al., 2021).
Quality Assessment
The data were screened and cleaned using expert judgement, informed by the gap-filled data percentage, quality flags and number of measurements days, if available. The primary approach was to visually assess the time series of meteorological variables and fluxes for each site as well as the overall magnitudes in flux and supporting environmental data. In general, quality control of all data was carried out in close cooperation with data providers.
Additional information is provided in Section 5 below.
Data Acquisition, Materials, and Methods
Sites and locations
Two attributes were used to differentiate between measurement locations: site_name and site_reference. The column site_name (e.g., Stordalen Mire) is considered a more general description of a site whereas site_reference (e.g., Stordalen Mire_Palsa Site_Chamber) is a more specific description of a plot/sub-site within a broader site and indicates the method of measurement. The distinction between site_name and site_reference is most evident among chamber studies where measurements may have been made across different types of vegetation or landscape characteristics within a single site (i.e., several site_references corresponding to a single site_name). A unique site_reference was assigned to each site, as long as it had a distinct land cover class, coordinates, or unique related environmental data. For eddy covariance tower measurements, the distinction between site_name and site_reference is less significant. Eddy covariance towers from the major flux repositories (e.g., Fluxnet, Ameriflux, ICOS) often have a FluxID assigned which was reflected in the "site_reference" of the data (e.g., Stordalen_SE-St1_tower). For user-contributed tower data that did not have a FluxID, site_reference is often the site_name along with a name specified by the data contributor with the addition of “_tower”. In instances where footprint analysis was applied to split tower data in addition to the ecosystem-level fluxes (sites Ranskalankorpi, Iskoras, Stordalen), the site_reference column specifies which ecosystem the flux comes from (e.g., Iskoras_NO-Isk_palsa_tower and Iskoras_NO-Isk_pond_tower). ABCFlux v2 comprises 1,024 individual site names and 4,884 individual site references. In order to not exaggerate the number of sites in this synthesis, the number of unique site_name is referenced unless otherwise specified.
Flux data for lentic waterbodies were aggregated to the waterbody level by averaging the observational data where several measurements were conducted within one waterbody. Therefore, spatial within-lake differences were not individually accounted for. However, the column aquatic_site_sampling_location provides information about the location within the waterbody where measurements were conducted and differentiates between the edge and the center of the waterbody, or both if measurements were conducted across the waterbody which can have implications for total flux calculations. It should be noted that the sampling location within the waterbody remained unknown (no location information was available) for 66% of the aquatic flux measurements, 22% were sampled from the center of the waterbody, 7% from both (center and edge), and 5% from the edge of the waterbody.
Where measurements were taken within a single campaign along a large lotic waterbody over several kilometers, the river was divided into sections and flux data were aggregated for each section separately. This spatial aggregation was handled on a case-by-case basis and in close collaboration with data contributors. In instances where this spatial aggregation was applied, the site_name represents the river name (e.g., Teno), and site_reference reflects the river section (e.g., Teno_Karigasniemi_chamber, where Teno river is the name of the river, and Karigasniemi the measurement location).
Terrestrial fluxes (Arctic_Boreal_CO2_Flux_V2_Terrestrial.csv)
For repository data, 48 eddy covariance site-level time series of CO2 and CH4 fluxes were encountered that had “flat lines” over several months of data (Figure 2, panel A), i.e., relatively constant flux values that did not vary month to month by more than 3 g C m-2 month-1. These “flat lines” often occurred at the beginning and end of time series and usually had a mean gap-fill percentage of 97%. Flux data were excluded if they were made up of three or more consecutive months with high gap-fill percentages (>75%).
Another issue that was identified during the quality check of the eddy covariance data submitted by data contributors, or extracted from general data repositories, pertained to the winter months (Dec-Feb). During this period, NEE was occasionally found to be exactly zero with a gap-fill percentage of 100%. Those data were excluded from the dataset as there should always be some variability due to measurement and data processing uncertainties, even during low-flux conditions.
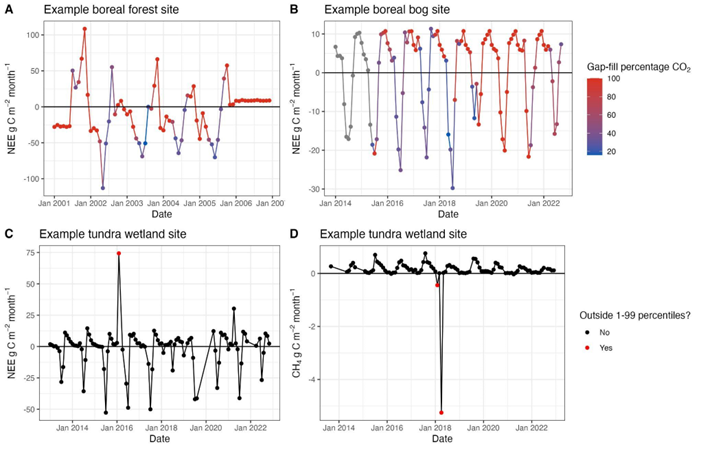
Figure 2. Example of situations encountered in data cleaning: (A) site time series with “flat lines” based on entirely gap-filled data, (B) heavy gap-filling across most winters and some years (grey points and lines indicate no gap-fill percentage was available), fluxes flagged as outside the 1th-99th percentiles and visually identified as outliers that were removed for (C) NEE and (D) CH4.
For 25% of CO2 and 69% of CH4 eddy covariance site-months (including data provided by data contributors and from flux repositories), there was no information about data quality and/or gap-filled data percentage. Consequently, the metadata could not be solely relied on for quality screening. Instead, the 1st and 99th percentiles for each combination of month and biome were calculated and used together with the visual assessment of time series, to identify data that either deviated from expected seasonal patterns or fell outside these percentile thresholds (Virkkala et al., 2025, in process, Supplementary Table 2). Data were removed if it was both outside of these percentiles and stood out visually (Figure 1, panels C and D). Primarily, months were excluded that were entirely gap-filled during winter and showed net CO2 uptake beyond the 99th percentile.
The visual inspection of time series also led to the removal of flux data from certain sites where one year in the dataset showed unrealistic patterns, such as potentially reversed signs. These datasets were often downloaded from general data repositories like the Arctic Data Center and attempts to resolve the issues by contacting data contributors or reviewing relevant publications from the site were unsuccessful. At some sites, flux time series followed a realistic seasonal pattern within the percentile thresholds despite some of the monthly fluxes being entirely gap-filled (often during a few months of the winter season, or due to, e.g., one year of missing data in a longer time series). Due to the limited amount of data in the Arctic-boreal region, these fluxes were kept in the dataset, and this is noted in the gap-filled data percentage column. In total, 26 sites were kept that included 90-100% gap-filled flux data during the peak winter months (Dec-Feb) across all the measured years because the seasonal dynamics and magnitudes matched those from other years of data from the same site or similar ecosystem types (Figure 1, panel B). Months were removed where the data repository had winter months that were 100% gap-filled and/or data contributors provided only growing season data and/or advised against including repository data.
Terrestrial non-eddy covariance (i.e. chamber and snow pack diffusion) fluxes were examined on a site by site basis. These fluxes were not removed, as the limited temporal coverage of these measurement methods made it difficult to interpret seasonal patterns from time series graphs. Additionally, converting these often temporally limited observations into monthly cumulative fluxes can yield values with considerable uncertainty; however, these data were retained given the overall scarcity of measurements in this region and the quality flags described in Table 1 should be consulted by data users.
For supporting environmental information, data were removed with unchanging values across three or more months as they likely represented a seasonal average and not monthly data. Soil temperature observations were removed that were above 40°C and below -40°C as these were the approximate temperature ranges seen in ABCFlux v1 and BAWLD-CH4; values outside of this range were assumed to be errors. The largest amount of cleaning was done for the water table depth to ensure that the sign of the data was aligned with the variable description for ABCFlux v2 (i.e., positive is below the soil surface, negative is above).
Freshwater fluxes (Arctic_Boreal_CO2_Flux_V2_Aquatic.csv)
The footprints of eddy covariance towers over waterbodies often include surrounding non-aquatic ecosystems. Therefore, a fetch screening is commonly applied by data contributors of sites with mixed footprints (e.g. Lake Villasjön in Sweden; Jammet et al., 2017) to separate flux contributions from aquatic and adjacent terrestrial ecosystems. The simplest approach to remove non-aquatic flux contributions was to apply a wind-directional fetch screening that excludes half-hourly fluxes from wind directions associated with land surfaces during data processing (also done in Golub et al., 2023). In ABCFlux v2, it is indicated whether fetch screening was applied and for which wind directions. Regardless of the type of approach used to filter out non-aquatic carbon fluxes for eddy covariance data, the number of data gaps tends to be larger than for terrestrial towers. Because of this, and the fact that most gap-filling approaches are tailored to terrestrial ecosystems, gap-filling for aquatic towers remains challenging. Both gap-filled and non-gap-filled aquatic tower data, and derived monthly cumulative fluxes based on the available data were included.
Within the process of quality screening, some variables were unified such as the gas transfer velocity, which can be used to estimate diffusive fluxes based on dissolved gas concentrations and hydraulic properties. The gas transfer velocity can be expressed as a magnitude independent of gas and temperature when normalized to a Schmidt number (Sc) of 600 (k600, i.e. normalized gas transfer velocity) for freshwater at 20 °C. Where gas transfer velocities for a specific gas species (kgas) were not normalized to a Schmidt number of 600, they were converted accordingly (k600 = (600/Sc)n * kgas; (Cole and Caraco, 1998), where n is determined by windspeed. Furthermore, dissolved CO2 and CH4 concentrations (or partial pressures) were converted from a range of given units (ppm, ppb, µatm, mol L-1, mmol L-1, nmol L-1, mmol m-3, mg L-1) to µmol L-1 following previous procedures from GRiMeDB (github code: https://github.com/lukeloken/GlobalRiverMethane).
Data Access
These data are available through the Oak Ridge National Laboratory (ORNL) Distributed Active Archive Center (DAAC).
ABCFlux v2: Arctic-Boreal CO2 and CH4 In-situ Flux and Environmental Data
Contact for Data Center Access Information:
- E-mail: uso@daac.ornl.gov
- Telephone: +1 (865) 241-3952
References
Cole, J.J., and N.F. Caraco.1998. Atmospheric exchange of carbon dioxide in a low wind oligotrophic lake measured by the addition of SF6. Limnology and Oceanography 43:647–656. https://doi.org/10.4319/lo.1998.43.4.0647
ESA. 2017. Land Cover CCI: Produce User Guide. Version 2.0. Document reference CCI-LC-PUGV2. ESA Climate Change Initiative - Land Cover (CCI-LC) project 2017. European Space Agency. Visualization interface: http://maps.elie.ucl.ac.be/CCI/viewer/index.html. Documentation: http://maps.elie.ucl.ac.be/CCI/viewer/download/ESACCI-LC-Ph2-PUGv2_2.0.pdf
Jammet, M., S. Dengel, E. Kettner, F.-J. W. Parmentier, M. Wik, P. Crill, and T. Friborg. 2017. Year-round CH4 and CO2 flux dynamics in two contrasting freshwater ecosystems of the subarctic. Biogeosciences 14:5189–5216. https://doi.org/10.5194/bg-14-5189-2017
Golub, M., N. Koupaei-Abyazani, T. Vesala, I. Mammarella, A. Ojala, G. Bohrer, G.A. Weyhenmeyer, P.D. Blanken, W. Eugster, F. Koebsch, J. Chen, K. Czajkowski, C. Deshmukh, F. Guérin, J. Heiskanen, E. Humphreys, A. Jonsson, J. Karlsson, G. Kling, X. Lee, H. Liu, A. Lohila, E. Lundin, T. Morin, E. Podgrajsek, M. Provenzale, A. Rutgersson, T. Sachs, E. Sahlée, D. Serça, C. Shao, C. Spence, I.B. Strachan, W. Xiao and A.R. Desai. 2023. Diel, seasonal, and inter-annual variation in carbon dioxide effluxes from lakes and reservoirs. Environmental Research Letters 18:034046. https://doi.org/10.1088/1748-9326/acb834
Olefeldt, D., M. Hovemyr, M.A. Kuhn, D. Bastviken, T.J. Bohn, J. Connolly, P. Crill, E.S. Euskirchen, S.A. Finkelstein, H. Genet, G. Grosse, L.I. Harris, L. Heffernan, M. Helbig, G. Hugelius, R. Hutchins, S. Juutinen, M.J. Lara, A. Malhotra, K. Manies, A.D. McGuire, S.M. Natali, J.A. O'Donnell, F.-J. W. Parmentier, A. Räsänen, C. Schädel, O. Sonnentag, M. Strack, S.E. Tank, C. Treat, R.K. Varner, T. Virtanen, R.K. Warren, and J.D. Watts. 2021. The Boreal–Arctic Wetland and Lake Dataset (BAWLD). Earth System Science Data 13:5127–5149. https://doi.org/10.5194/essd-13-5127-2021
Olefeldt, D., M.R. Turetsky, P.M. Crill, and A.D. McGuire. 2013. Environmental and physical controls on northern terrestrial methane emissions across permafrost zones. Global Change Biology 19:589–603. https://doi.org/10.1111/gcb.12071
Virkkala, A-M., S. Natali, B.M. Rogers, J.D. Watts, K. Savage, S.J. Connon, M.E. Mauritz-tozer, E.A.G. Schuur, D.L. Peter, C. Minions, J. Nojeim, R. Commane, C.A. Emmerton, M. Goeckede, M. Helbig, D. Holl, H. Iwata, H. Kobayashi, P. Kolari, E. Lopez-Blanco, M.E. Marushchak, M. Mastepanov, L. Merbold, M. Peichl, O. Sonnentag, T. Sachs, M. Ueyama, C. Voigt, M. Aurela, J. Boike, G. Celis, N. Chae, T. Christensen, S. Bret-Harte, S. Dengel, H. Dolman, C. Edgar, B. Elberling, S.E. Euskirchen, A. Grelle, J. Hatakka, E.R. Humphreys, J. Jarveoja, A. Kotani, L. Kutzbach, T. Laurila, A. Lohila, I. Mammarella, Y. Matsuura, G. Meyer, M.B. Nilsson, S.F. Oberbauer, S.J. Park, F.J.W. Parmentier, R. Petrov, A.S. Prokushkin, S. Zyrianov, C. Schulze, V.L. St.louis, E.S. Tuittila, J.P. Tuovinen, W. Quinton, A. Varlagin, D. Zona, and V.I. Zyryanov. 2021. The ABCflux Database: Arctic-Boreal CO2 Flux and Site Environmental Data, 1989-2020. ORNL DAAC, Oak Ridge, Tennessee, USA. https://doi.org/10.3334/ORNLDAAC/1934
Virkkala, A-M., I. Wargowsky, J. Vogt, M. Kuhn, S. Madaan, R. O'Keefe, T. Windholz, K.A. Arndt, B. Rogers, J.D. Watts, M. Goeckede, E.A.G. Schuur, G. Rocher-Ros, D. Bastviken, D. Olefeldt, K. Kent, K. Aalstad, K. Aho, J. Ala-Konni, H. Alcock, I. Althuizen, C.D. Arp, J. Asanuma, K. Attermeyer, M. Aurela, S. Balathandayuthabani, A. Barr, M. Barret, O. Batkhishig, C. Biasi, M.P. Bjorkman, T.A. Black, E. Blanc-Betes, P. Bodmer, J. Boike, A. Bolek, F. Bouchard, I. Bussmann, L. Cabrol, E. Canfora, S. Carey, K. Castro-Morales, N. Chae, A. Christen, T.R. Christensen, C.T. Christiansen, H. Chu, G. Clark, F. Clayer, P.M. Crill, C. Cunada, S.J. Davidson, J.F. Dean, S. Dengel, M. Detto, C. Dieleman, F. Domine, E. Dyukarev, C. Edgar, B. Elberling, C.A. Emmerton, S.E. Euskirchen, G. Falvo, T. Friborg, M. Garneau, M. Giamberini, M.V. Glagolev, M.A. Gonzalez-meler, G. Granath, J. Gudmundsson, K. Happonen, Y. Harazono, L. Harris, J. Hashemi, N. Hasson, J. Heerah, L. Heffernan, M. Helbig, W. Helgason, M. Heliasz, G. Henry, G. Hensgens, T. Hiyama, M. Hock, D. Holl, B. Holmes, J. Holst, T. Holst, G. Hould-Gosselin, E. Humphreys, J.K.Y. Hung, J. Huotari, H. Ikawa, D.V. Ilyasov, M. Ishikawa, G. Iwahana, H. Iwata, M.A. Jackowicz-Korczynski, J. Jansen, J. Jarveoja, V.E. Jassey, R. Jensen, K. Jentzsch, R.G. Jespersen, C. Johannesson, C.P. Jones, A. Jonsson, J.Y. Jung, S. Juutinen, E.S. Kane, J. Karlsson, S. Karsanaev, K. Kasak, J. Kelly, K. Kempton, M. Klaus, G.W. Kling, N. Kljun, J. Knutson, H. Kobayashi, J. Kochendorfer, K. Kohonen, P. Kolari, M. Korkiakoski, A. Korrensalo, P. Kortelainen, E. Koster, K. Koster, A. Kotani, P. Krishnan, J. Kurbatova, L. Kutzbach, M.J. Kwon, E.D. Kyzivat, J. Lagroix, T. Langhorst, E. Lapshina, T. Larmola, K. Larsen, I. Laurion, J. Ledman, H. Lee, A.J. Leffler, L. Lesack, A. Lindroth, D. Lipson, A. Lohila, E. Lopez-Blanco, V.L. St. Louis, E. Lundin, M. Luoto, T. Machimura, M. Magnani, A. Malhotra, M. Maljanen, I. Mammarella, E. Mannisto, L.B. Marchesini, P. Marsh, P.J. Martkainen, M.E. Marushchak, M. Mastepanov, A. Mavrovic, T. Maximov, C. Minions, M. Montemayor, T. Morishita, P. Murphy, D.F. Nadeau, E. Nicholls, M.B. Nilsson, A. Niyazova, J. Norden, K.D. Noumonvi, H. Nykanen, W. Oechel, A. Ojala, T. Okadera, S. Pal, A.V. Panov, T. Papakyriakou, D. Papale, S.J. Park, F. Parmentier, G. Pastorello, M. Peacock, M. Peichl, R. Petrov, K.S. Pierre, N. Pirk, J. Plein, V. Preskienis, A. Prokushkin, J. Pumpanen, H.A. Rains, N. Rakos, A. Rasanen, H. Rautakoski, R. Rinnan, J. Rinne, A.V. Rocha, N.T. Roulet, A. Roy, A. Rutgersson, A.F. Sabrekov, T. Sachs, E. Sahlee, A. Salazar, H.O. Sawakuchi, C. Schulze, R. Seco, A. Sepulveda-Jauregui, S. Serikova, A. Serrone, H.M. Silvennoinen, S. Sjogersten, J. Skeeter, J. Snoalv, S. Sobek, O. Sonnentag, E.H. Stanley, M. Strack, L. Strom, P. Sullivan, R.C. Sullivan, A. Sytiuk, T. Tagesson, P. Taillardat, J. Talbot, S.E. Tank, M. Tenuta, I. Terenteva, F. Thalasso, A. Thiboult, H. Thorgeirsson, F.G. Tigreros, M. Torn, A. Townsend-Small, C. Treat, A. Tremblay, C. Trotta, E.-S. Tuittila, M. Turetsky, M. Ueyama, M. Umair, A. Vaha, L. van Delden, M. van Hardenbroek, A. Varlagin, R.K. Varner, E. Veretennikova, T. Vesala, T. Virtanen, C. Voigt, J.E. Vonk, R. Wagner, K. Walter Anthony, Q. Wang, M. Watanabe, H. Webb, J. M. Welker, A. Westergaard-Nielsen, S. Westermann, J.R. White, C. Wille, S.N. Williamson, S. Zolkos, D. Zona, and S.M. Natali. 2025. ABCFlux v2: Arctic–boreal CO2 and CH4 monthly flux observations and ancillary information across terrestrial and freshwater ecosystems, Earth System Science Data Discuss. [preprint], https://doi.org/10.5194/essd-2025-585
Dataset Revisions
| Version | Release Date | Revision Notes |
|---|---|---|
| 2 | 2026-04-21 | Aquatic and terrestrial sites were separated into two files. |
| 2 | 2026-02-05 | New variables were added to represent detailed descriptions of plant functional types (e.g., evergreen and deciduous shrub coverage), deep soil temperatures (<10 cm), and permafrost thaw presence or absence in the top two meters. Data pertaining to CH4 fluxes were also added that were not included in previous flux synthesis efforts, such as a categorical moisture class (wet-moist-dry) and BAWLD classes (Olefeldt et al., 2021). This release was considered "in-review". |
| 1 | 2021-11-23 | Version 1 release |