Documentation Revision Date: 2022-01-26
Dataset Version: 1
Summary
The QA and documentation of this dataset is in progress.
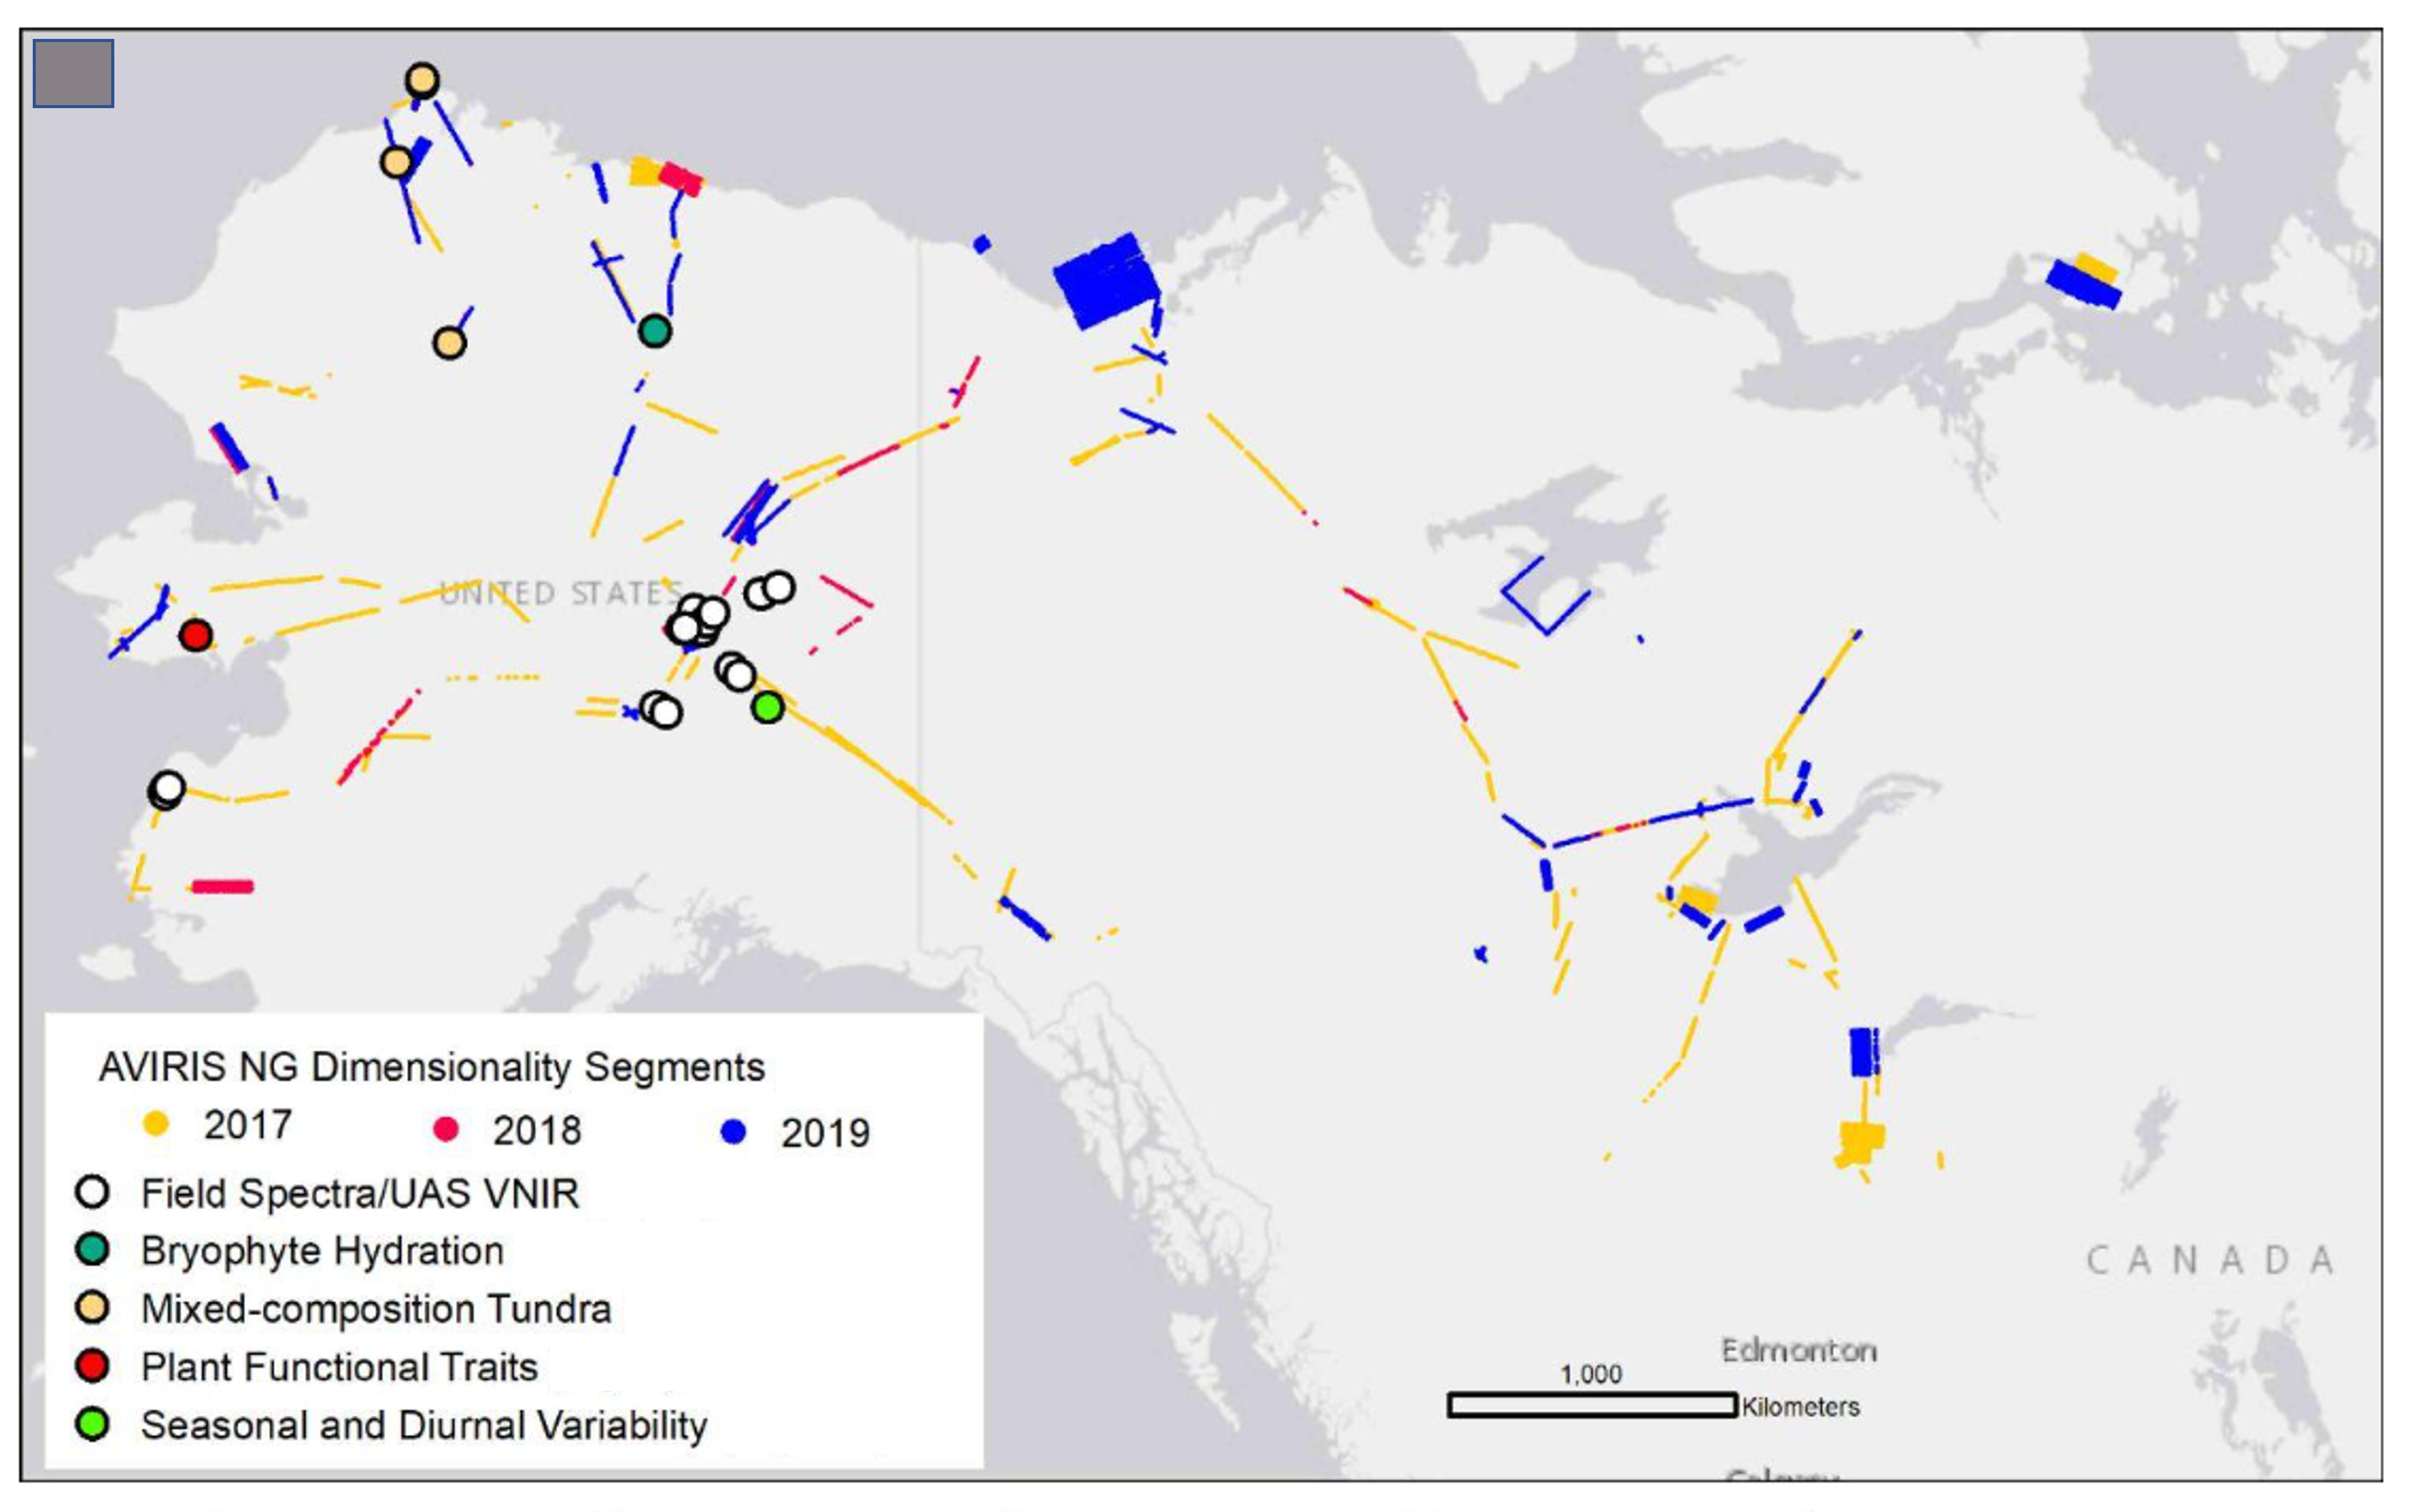
Figure 1: Locations of AVIRIS-NG flight line segments used in this analysis and ground-based measurements
Citation
Nelson, P.R., and K. Smith. 2022. ABoVE: UAV and Ground-based VNIR/SWIR Spectroscopy Data of Plant Functional Types. ORNL DAAC, Oak Ridge, Tennessee, USA. https://doi.org/10.3334/ORNLDAAC/1980
Table of Contents
- Dataset Overview
- Data Characteristics
- Application and Derivation
- Quality Assessment
- Data Acquisition, Materials, and Methods
- Data Access
- References
Dataset Overview
Study area: (These coordinates are the approximate locations of the study sites and may not match the extent of the data files. All latitude and longitude are given in degrees minutes seconds.)
|
Site |
Northern Extent |
Western Extent |
Eastern Extent |
Southern Extent |
|
Birch_Lake |
64°55'14.48"N |
147°49'35.46"W |
147°49'3.90"W |
64°55'2.59"N |
|
Little_Lake |
64°24'53.09"N |
146°54'1.62"W |
146°53'28.79"W |
64°24'26.36"N |
|
Eight_Mile |
63°52'39.62"N |
149°15'25.73"W |
149°15'2.85"W |
63°52'26.48"N |
|
Big Trail Lake |
64°55'14.65"N |
147°49'35.78"W |
147°49'4.24"W |
64°55'2.64"N |
|
Twelve_Mile |
65°24'10.09"N |
145°58'52.59"W |
145°58'35.46"W |
65°24'3.26"N |
|
Murphy_Dome |
64°57'16.31"N |
148°26'17.56"W |
148°20'36.47"W |
64°56'56.73"N |
|
Wickersham_Dome |
65°11'23.33"N |
148° 4'4.29"W |
148° 3'45.12"W |
65°11'15.39"N |
|
Vault_Dr |
65° 2'10.66"N |
147°42'48.57"W |
147°42'12.90"W |
65° 1'57.88"N |
|
Bison_Gulch |
63°48'29.04"N |
148°57'14.74"W |
148°56'58.41"W |
63°48'20.33"N |
|
Chatnika |
65° 9'17.82"N |
147°29'7.30"W |
147°28'34.69"W |
65° 9'9.14"N |
|
Clayton_Lake |
64°55'14.38"N |
147°49'27.53"W |
147°49'16.29"W |
64°54'41.75"N |
|
Eagle_Summit |
65°29'11.33"N |
145°25'27.26"W |
145°24'44.88"W |
65°28'55.51"N |
|
Yukon |
62°45'12.56"N |
164°40'56.98"W |
164°32'55.24"W |
62°39'30.95"N |
Acknowledgement:
NASA ABoVE award (Phase 1) and (Phase 2) Grant Number: NNX15AU05A; Maine Economic Improvement Fund - Small Campus Initiative (MEIF-SCI) awards in 2016 and 2018; Polar Studies research award from the Field Museum, Chicago.
Data Characteristics
Spatial Coverage: Flights over the Alaskan Arctic and boreal zones within the ABoVE Domain
Spatial Resolution: approximately 4-10 centimeters
Temporal Coverage: 07-24-2018 to 08-12-2019
Temporal Resolution: Areas were surveyed once
There are 4 files associated with each of the 175 flight lines included in this dataset. These files are as follows:
ENVI image files - these files have no extension and store reflectance measurements captured by the Headwall Micro A-series VNIR imaging spectrometer.
Header files - accompanying file for the ENVI image files. They should remain in the same directory as the image files for the data to be displayed properly. Header files provide spatial and spectral metadata related to the image file such as the number of lines, samples, channels, etc. Please see the Harris Geospatial reference for the ENVI file format for more detailed information on the header files.
KMLs - these files store the footprint of each flight line.
RGB JPEGs - these files are RGBs of each flight line stored in a jpeg format.
Each flight line uses a specific base filename prefix: LOC_YYYY_MM_DD_HH_NN_SS_ID_rd_rf_or. The datetime codes outlined below applies to all files for the 175 flight lines.
- LOC: General name of the site (e.g Murphy dome)
- YYYY : Year of flight
- MM : Month of flight
- DD : Day of flight
- HH : UTC hour at start of flight
- NN : UTC minute at start of flight
- SS : UTC second at start of flight
- ID : Headwall ID number
- rd: flight was brought to radiance cube
- rf: flight brought to reflectance cube
- or: cube orthorectified
Application and Derivation
The reflectance measurements of 100 vegetation species were collected under AVIRIS-NG flight lines as close as possible in time, providing on-the-ground reflectance of targets in an area independent of NASA’s sensor. The reflectance measurements have higher spectral resolution but the same bandpass as AVIRIS-NG. This library will be an useful resource for those interested in resolving what vegetation occurs in an AVIRIS-NG pixel.
Moreover, the imaging spectroscopy data collected under AVIRIS-NG using a UAV has lower spectral resolution than AVIRIS-NG but high spatial resolution, which is helpful for classifying or mapping features and then calculating the fraction of each feature within an AVIRIS-NG pixel. The imaging spectroscopy data could also be used to directly compare reflectance to AVIRIS-NG in the VNIR where the two sensor’s bandpasses overlap.
Quality Assessment
Data Acquisition, Materials, and Methods
An imagery was generated using a Headwall Micro A-Series sensor push broom imaging spectrometer covering the VNIR (400-1000 nm) in 324 spectral bands with 1004 spatial bands/pixel. This spectrometer is mounted on UAV (DJI Matrice 600) with Trimble APX-15 GPS/IMU. Imagery was orthorectified using the coordinates from the GPS/IMU that were not post-processed. Reflectance of a Spectralon panel taken just before flight under ambient conditions was used as a white reference. Radiometric calibration occurred in the proprietary software SpectralView by Headwall. Orthorectified reflectance products are delivered in GeoTIFF at a spatial resolution of 4-10 cm GSD.
Ground spectra were collected using the PSR+ 3500 Spectroradiometer by Spectral Evolution which cover the range 350-2500 nm in 2151 spectral bands. Values in the data are percent reflectance based on radiometric calibration against a Spectralon panel taken before scanning. Scans were collected using leaf clip or contact probe with tungsten halogen light source that eliminates almost all ambient light. GPS coordinates are included in many of the scans unless they were collected via samples that were taken back to a central location and scanned after field work each day.
Data Access
These data are available through the Oak Ridge National Laboratory (ORNL) Distributed Active Archive Center (DAAC).
ABoVE: UAV and Ground-based VNIR/SWIR Spectroscopy Data of Plant Functional Types
Contact for Data Center Access Information:
- E-mail: uso@daac.ornl.gov
- Telephone: +1 (865) 241-3952