Documentation Revision Date: 2026-08-26
Dataset Version: 1
Summary
This dataset includes four files of relative soil drainage classes in GeoTIFF (.tif) format.
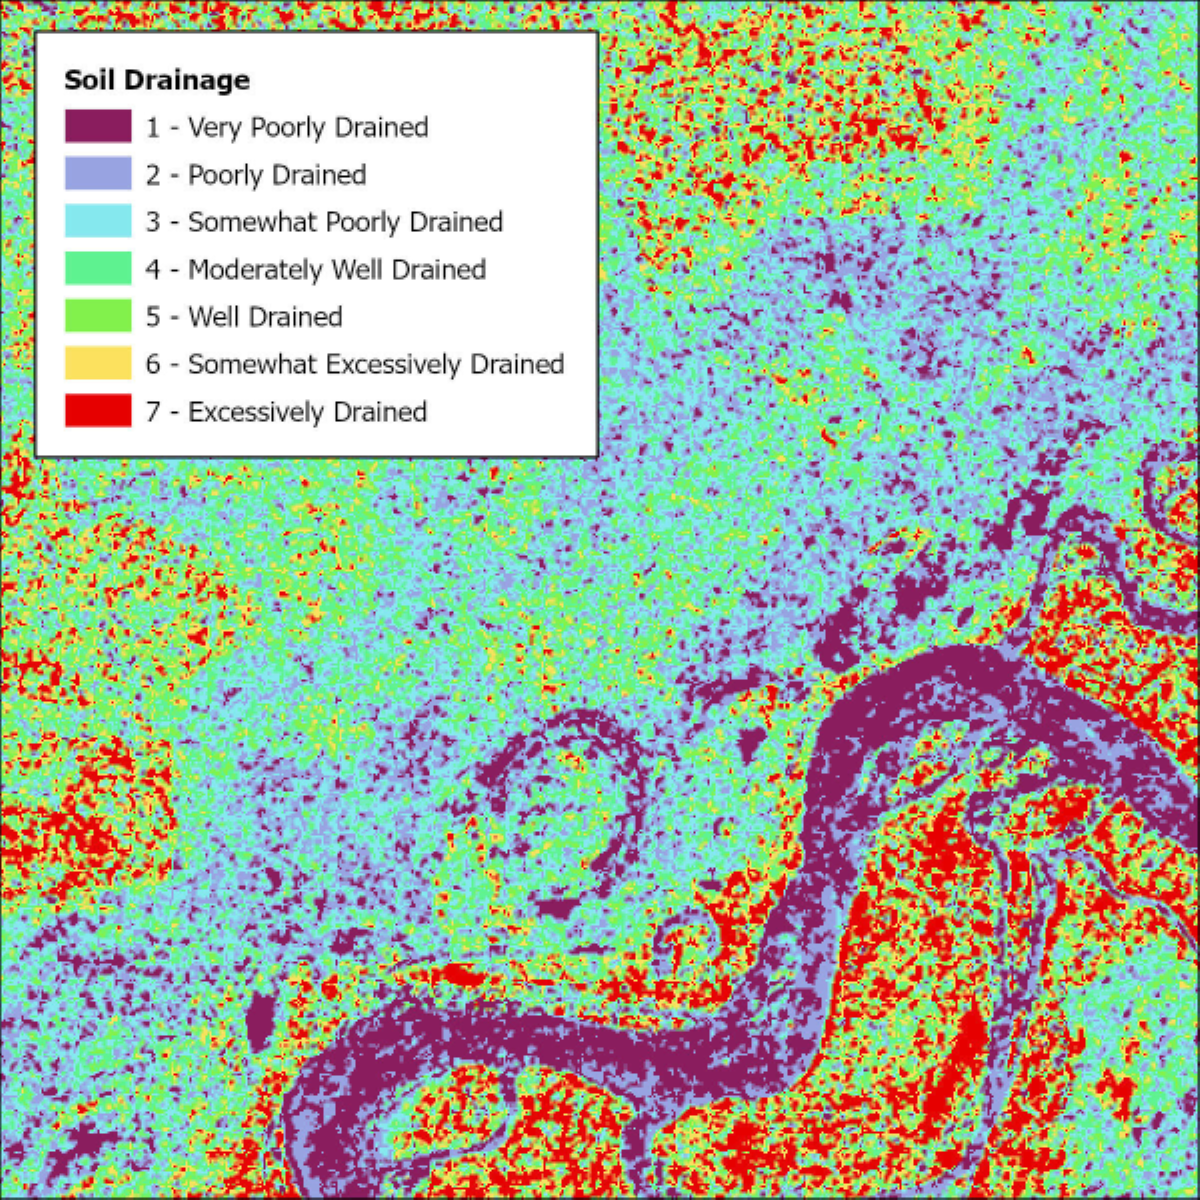
Figure 1. Zoomed-in view of example soil drainage map for the Bonanza Creek area. Source: Dataset GeoTIFF file, BonanzaCreek_quantileFPCA_coef2_7class.tif.
Citation
Bourgeau-Chavez, L.L., N. Kozel, M. Brandt, M.J. Battaglia, J.A. Graham, A.J. Chavez, and D.J.L. Vander Bilt. 2026. ABoVE: Soil Drainage Maps from L-band SAR across Four Sites in Alaska and Canada. ORNL DAAC, Oak Ridge, Tennessee, USA. https://doi.org/10.3334/ORNLDAAC/2516
Table of Contents
- Dataset Overview
- Data Characteristics
- Application and Derivation
- Quality Assessment
- Data Acquisition, Materials, and Methods
- Data Access
- References
Dataset Overview
Four prototype soil drainage maps were produced from a series of L-band HH-polarization SAR imagery from JAXA’s ALOS-1 or ALOS-2 across four study sites: Bonanza Creek, AK; Hay River, Northwest Territories; Delta Junction, AK; and the Red Earth Creek, Alberta. The input data were acquired from repeat orbit/frames, radiometrically terrain corrected and stacked by site before applying FPCA. The study sites had at least five ALOS-1/2 PALSAR growing season images and coincident in situ moisture data for multiple sites in the scenes. The scikit-FDA package in Python was used to apply FPCA to each time series of L-band SAR data. The outputs were coefficients and scores for the FPCA. Field data were used to test the coefficients and scores against in situ soil moisture. Field data were acquired by the authors at Delta Junction, Hay River and Red Earth Creek, but also by Jean et al. (2022) at the Bonanza Creek LTER. Once the relationships were established between the coefficient of variation (CoV) of field plot data and the FPCA coefficient, the designated FPCA coefficient layers were used with a quantile classification of seven classes to output relative soil drainage.
Project: Arctic-Boreal Vulnerability Experiment
The Arctic-Boreal Vulnerability Experiment (ABoVE) is a NASA Terrestrial Ecology Program field campaign being conducted in Alaska and western Canada, for 8 to 10 years, starting in 2015. Research for ABoVE links field-based, process-level studies with geospatial data products derived from airborne and satellite sensors, providing a foundation for improving the analysis, and modeling capabilities needed to understand and predict ecosystem responses to, and societal implications of, climate change in the Arctic and Boreal regions.
Related Dataset
Bourgeau-Chavez, L.L., J.A. Graham, K.R. Bosse, A.F. Poley, M.J. Battaglia, and B. Hart. 2023. Hourly Soil Moisture Logger Data, Alberta and Alaska, 2017-2021. ORNL DAAC, Oak Ridge, Tennessee, USA. https://doi.org/10.3334/ORNLDAAC/2123
- Logger data used for validation of Alberta site
Acknowledgement
This study was supported by the NASA ABoVE Project (grant 80NSSC22K1234).
Data Characteristics
Spatial Coverage: Alaska and Canada: Bonanza Creek, AK; Hay River, Northwest Territories; Delta Junction, AK; and the Red Earth Creek, Alberta.
ABoVE Reference Locations
Domain: Core ABoVE
Spatial Resolution: varies between 12.5-meter and 38.8-meter
Temporal Coverage: 2006-06-14 to 2023-07-31
Temporal Resolution: Sampling frequency: Multiple images were used for FPCA, plus one winter scene for normalization.
Study Area: Latitude and longitude are given in decimal degrees.
| Site | Westernmost Longitude | Easternmost Longitude | Northernmost Latitude | Southernmost Latitude |
|---|---|---|---|---|
| Alaska and Canada | -148.3691 | -114.6258 | 64.7748 | 56.5396 |
Data File Information
This dataset includes four files of relative soil drainage classes in GeoTIFF (.tif) format:
BonanzaCreek_quantileFPCA_coef1_7class.tif: Relative soil drainage map at 12.5-meter pixel spacing for Bonanza Creek (BC), Canada for the time period 2006-2011, from ALOS-1 seasonal input images. 27 input images.
DeltaJunction_quantileFPCA_coef1_7class.tif: Relative soil drainage map at 18.2-meter pixel spacing for Delta Junction (DJ), Alaska for the time period circa 2007 to 2010, ALOS-1 seasonal images. 5 input images.
HayRiver_quantileFPCA_coef1_7class.tif: Relative soil drainage map at 38.5-meter by 38.8-meter pixel spacing for Hay River (HR), Canada for the time period circa 2007 to 2009 from ALOS-1 PALSAR input images across seasons. 5 input images
RedEarthCreek_quantileFPCA_coef1_7class.tif: Soil drainage map at 36.95-meter by 16.45-meter pixel spacing for Red Earth Creek (REC), Canada for the time period circa 2017-2024, based on ALOS-2 PALSAR input images from July only each year. 8 input images.
Table 1. Soil drainage classes in the GeoTIFFs.
| Class number | Description | RGB code* |
|---|---|---|
| 1 | Very Poorly Drained | 138, 23, 94 |
| 2 | Poorly Drained | 141, 166, 225 |
| 3 | Somewhat Poorly Drained | 125, 232, 238 |
| 4 | Moderately Well Drained | 107, 242, 145 |
| 5 | Well Drained | 147, 240, 81 |
| 6 | Somewhat Excessively Drained | 251, 225, 94 |
| 7 | Excessively Drained | 230, 0, 0 |
*Recommended red-blue-green color scheme for displaying drainage classes using 256 color levels (0-255).
Application and Derivation
The boreal and arctic are changing dramatically, with extreme drought, wildfire, and permafrost thaw; therefore, drainage patterns are changing across the landscape. This approach provides a method to monitor changes in those patterns.
Quality Assessment
These maps provide a relative soil drainage representation for the time period covered by the imagery. Accuracy was visually compared to wetland-peatland land cover maps and to in situ time series soil moisture data. R2 was used for comparison of the coefficient of variation of soil moisture from several sites within each area mapped. The R2 values were 0.90 for Bonanza Creek (BC), 0.89 for Hay River (HR), 0.81 for Delta Junction (DJ), and 0.54 for Red Earth Creek (REC). Each site was representative of a 1-ha area with multiple field samples averaged across the 1 ha. REC did not have seasonal images like the others; it only had eight input images from July imagery for each year 2017-2023 and one August image from 2019. BC had 27 input images from across the seasons from 2006-2010. HR and DJ each had five input images with dates of 2007-2009 (HR) and 2007-2010 (DJ).
The soil moisture depth most strongly correlated to the FPCA coefficients was between 12 and 20 cm, but varied by site, with 18-cm depth at Red Earth Creek, 20-cm depth at Bonanza Creek, 12 to 15-cm depths at Delta Junction, and 12-cm depth at Hay River. The soils at all sites were organic with a moss groundcover and are characterized by low bulk density. The variability in soils and drainage at the different sites likely had an influence on which depths were found most strongly correlated, and further investigation is needed to better understand these differences.
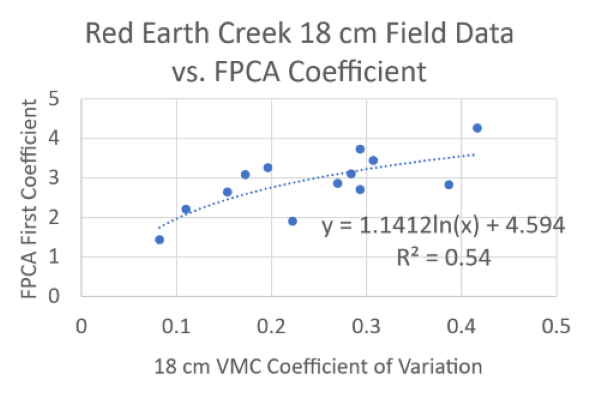
Figure 2. Red Earth Creek, field soil moisture VS FPCA coefficient.
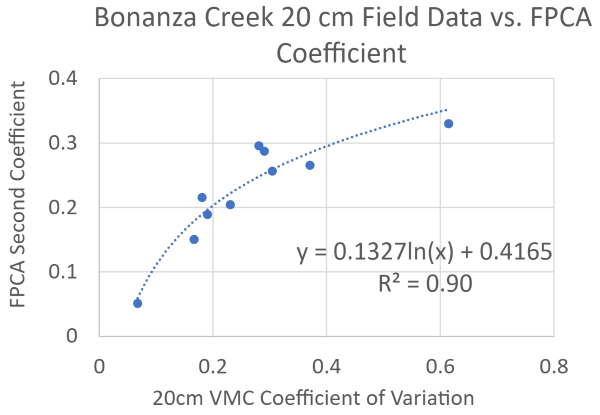
Figure 3. Bonanza Creek, field soil moisture VS FPCA coefficient.
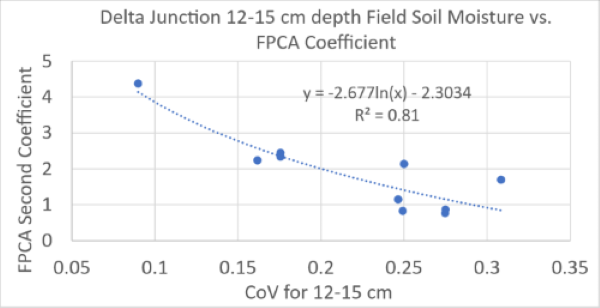
Figure 4. Delta Junction, field soil moisture VS FPCA coefficient.
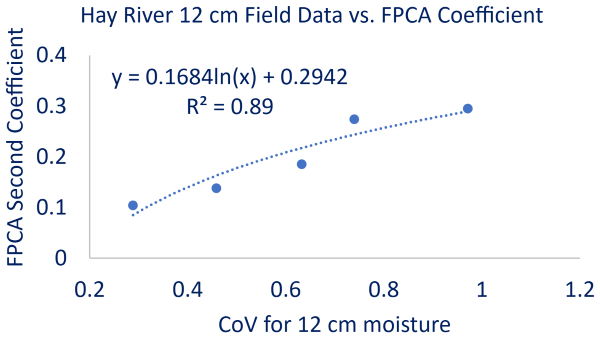
Figure 5. Hay River, field soil moisture VS FPCA coefficient.
Data Acquisition, Materials, and Methods
Four prototype soil drainage maps were produced from an input time series of L-band HH-polarization SAR imagery from JAXA’s ALOS-1 or ALOS-2 across four study sites in Alaska and Canada. The input data were acquired from repeat orbit/frames, radiometrically terrain corrected and stacked by site before applying a functional principal component analysis (FPCA). The scikit-FDA package in Python was used to apply FPCA to each time series of L-band SAR data. A winter frozen condition HH image was used to normalize each of the input images to mitigate the influence of aboveground biomass on the backscatter, which improved results (Bourgeau-Chavez et al. 2024). Focusing on sites that had at least five ALOS-1/2 PALSAR growing season images and coincident in situ moisture data for multiple sites in the scenes, the method was tested on four locations with successful results.
ALOS-PALSAR images (n=27) acquired from NASA ASF were used for the Bonanza Creek, AK site, Hay River, Northwest Territories site (n=5), and Delta Junction, AK site (n=5). ALOS-2 PALSAR-2 images acquired via a JAXA data grant were used for the Red Earth Creek Alberta site (n=8). The outputs were coefficients and scores for the FPCA. Field data acquired by the authors at Delta Junction, Hay River and Red Earth Creek, and also by Jean et al. (2022) at the Bonanza Creek LTER were used to compare the coefficients and scores against in situ soil moisture. Once the relationships were established between the CoV of field plot data and the FPCA coefficient, the designated FPCA coefficient layers were used with a quantile classification of seven classes to output relative soil drainage. It was assumed that the relative soil drainage (movement of water through the soil profile) would be revealed in the CoV in soil moisture, with poorly drained sites having low CoV and well drained sites having high CoV.
The second coefficient was found to be significantly related to the coefficient of variation in situ moisture, with a log fit and R2 of 0.81, 0.90, 0.89 and 0.54. The low R2 site had only July images each year over seven years and one August image, did not capture the seasonal variability, and thus had a lower correlated relationship, as would be expected. Also, cumulative rainfall (six days) data could also be used with validation, although the number of weather stations is quite sparse in the boreal arctic. To produce the maps, the second coefficient from the FPCA was used and a quantile classification with seven classes from well drained to poorly drained (this is the typical number of soil drainage classes) was applied. Since each map is relative and based on different input months/years (dates and number of dates), the maps are “relative” showing sites that are wetter and drier. It is not known if the full range of soil drainage that would typically be mapped from a digital elevation model (DEM), soil morphology and other static layers was captured.
Data Access
These data are available through the Oak Ridge National Laboratory (ORNL) Distributed Active Archive Center (DAAC).
ABoVE: Soil Drainage Maps from L-band SAR across Four Sites in Alaska and Canada
Contact for Data Center Access Information:
- E-mail: uso@daac.ornl.gov
- Telephone: +1 (865) 241-3952
References
Bourgeau-Chavez, L.L., J.A. Graham, K.R. Bosse, A.F. Poley, M.J. Battaglia, and B. Hart. 2023. Hourly Soil Moisture Logger Data, Alberta and Alaska, 2017-2021. ORNL DAAC, Oak Ridge, Tennessee, USA. https://doi.org/10.3334/ORNLDAAC/2123
Bourgeau-Chavez, L.L., Battaglia, M. and Brandt, D., 2024, December. Functional Data Analysis of ALOS-1&2 PALSAR Time Series Imagery for Soil Moisture and Drainage Mapping in Boreal Regions. In AGU Fall Meeting Abstracts (Vol. 2024, pp. GC53J-02).
Jean, M., H.D. Alexander, M.C. Mack, and J. Johnstone. 2022. Site Location and Environmental Characteristics for 83 Locations of 6-163 Years Old Black Spruce, Alaska Paper Birch, and Aspen Stands Across Interior Alaska. Sampled in 2008-2010 and 2013-2015., Bonanza Creek LTER - University of Alaska Fairbanks. BNZ:801. http://www.lter.uaf.edu/data/data-detail/id/801
https://doi.org/10.6073/pasta/06783fdb0d51876f6e72269db22ee152