Documentation Revision Date: 2024-03-22
Dataset Version: 1
Summary
This dataset holds 937 data files. There are 936 files in NetCDF version 4 format (.nc4) with this dataset, including 72 data files for each year for 2003-2015. There is also one file in comma-separated values (.csv) format with flux tower data (GPP, Reco, NEE, and CH4) for the years 2003-2014, used to calibrate and evaluate the modeled data.
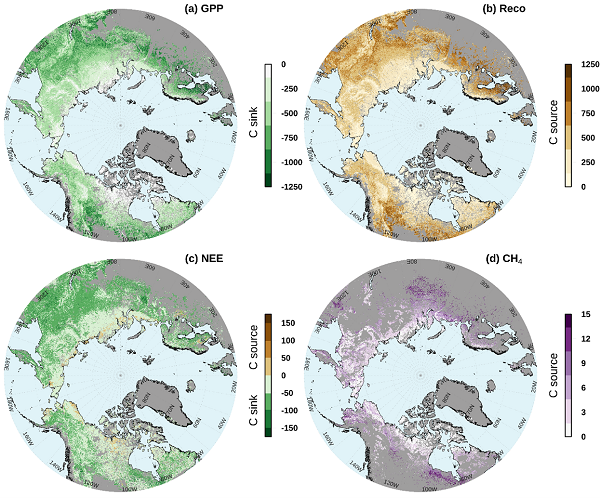
Figure 1. Average annual carbon flux (g m-2 yr-1) across the Arctic-boreal domain from 2003-2015 as informed by daily 1-km TCFM-Arctic simulations: a) GPP, b) Reco, c) NEE, and d) tundra and boreal wetland CH4 emissions with a topographic wetness index (TWI) masking.
Citation
Farina, M.K., and J.D. Watts. 2022. Gridded CO2 and CH4 Flux Estimates for pan-Arctic and Boreal Regions, 2003-2015. ORNL DAAC, Oak Ridge, Tennessee, USA. https://doi.org/10.3334/ORNLDAAC/2121
Table of Contents
- Dataset Overview
- Data Characteristics
- Application and Derivation
- Quality Assessment
- Data Acquisition, Materials, and Methods
- Data Access
- References
Dataset Overview
This dataset provides gridded estimates of gross primary productivity (GPP), ecosystem respiration (Reco), net ecosystem CO2 exchange (NEE = Reco - GPP), and methane (CH4) emissions from tundra and boreal wetland soils, across the pan-Arctic and Boreal zone (>49 degrees north) at 1-km spatial resolution. The data were produced through simulations of the Arctic Terrestrial Carbon Flux Model (TCFM-Arctic) and were calibrated and evaluated using >60 tower eddy covariance (EC) sites. Baseline carbon pools were initialized by continuously cycling (“spinning-up”) the model for 1,000 model years using recent climatology from 1985 to 2002 to reach a dynamic steady-state between estimated net primary productivity (NPP = GPP - Rauto) and near-surface SOC pools. The TCFM-Arctic simulations were extended to the full Arctic-boreal domain, from 2003 to 2015, at a 1-km spatial resolution using land cover maps representing high latitude vegetation communities.
Project: Arctic-Boreal Vulnerability Experiment
The Arctic-Boreal Vulnerability Experiment (ABoVE) is a NASA Terrestrial Ecology Program field campaign being conducted in Alaska and western Canada, for 8 to 10 years, starting in 2015. Research for ABoVE links field-based, process-level studies with geospatial data products derived from airborne and satellite sensors, providing a foundation for improving the analysis, and modeling capabilities needed to understand and predict ecosystem responses to, and societal implications of, climate change in the Arctic and Boreal regions.
Related Publication
Watts, J.D., M. Farina, J.S. Kimball, L.D. Schiferl, Z. Liu, K.A. Arndt, D. Zona, A. Ballantyne, E.S. Euskirchen, F-J. W. Parmentier, M. Helbig, O. Sonnentag, T. Tagesson, J. Rinne, H. Ikawa, M. Ueyama, R. Suzuki, H. Kobayashi, T. Sachs, D.F. Nadeau, J. Kochendorfer, M.Jackowicz-Korczynski, A. Virkkala, M. Aurela, R. Commane, B.K. Byrne, L. Birch, M. Johnson, N. Madani, B. Rogers, J. Du, A. Endsley, K. Savage, B. Poulter, Z. Zhang, L.M. Bruhwiler, C. Miller, S. Goetz, and W.C. Oechel. 2023. Carbon uptake in Eurasian boreal forests dominates the high-latitude net ecosystem carbon budget. Global Change Biology 29:1870-1889. https://doi.org/10.1111/gcb.16553
Related Datasets
Kimball, J.S., L.A. Jones, J.P. Glassy, and R. Reichle. 2016. SMAP L4 Global Daily 9 km Carbon Net Ecosystem Exchange, Version 2. NASA National Snow and Ice Data Center Distributed Active Archive Center. https://doi.org/10.5067/UBKO5ZUI7I5V
Loboda, T.V., E.E. Hoy, and M.L. Carroll. 2017. ABoVE: Study Domain and Standard Reference Grids. ORNL DAAC, Oak Ridge, Tennessee, USA. https://doi.org/10.3334/ORNLDAAC/1367
Acknowledgments
This work was supported by the NASA New Investigators Program, grant number NH17ZDA001N-NIP, NASA FINESST, grant number NNH19ZDA001N-FINESST, and NASA ABoVE Phase 1, grant number NNX15AT74A.
Data Characteristics
Spatial Coverage: Pan-Arctic and Boreal Zone (>49 Deg N)
ABoVE Reference Locations
Domain: Core and extended
State/Territory: Alaska and northwestern Canada
Grid Cells: All "A" cells in Alaska and northwestern Canada
Spatial Resolution: 1 km
Temporal Coverage: 2003-01-01 to 2015-12-31
Temporal Resolution: Daily
Site Boundaries: Latitude and longitude are given in decimal degrees.
| Site | Westernmost Longitude | Easternmost Longitude | Northernmost Latitude | Southernmost Latitude |
|---|---|---|---|---|
| Global | -180 | 180 | 90 | 49 |
Data File Information
There are 936 data files in NetCDF format (.nc4) with this dataset. This includes 72 data files for each year for the years 2003-2015 which provide gridded estimates of gross primary productivity (GPP) (g C m-2 d-1), ecosystem respiration (Reco) (g C m-2 d-1), net ecosystem CO2 exchange (NEE = Reco - GPP ) (g C m-2 d-1), and methane (CH4) emissions from tundra and boreal wetland soils (mg C m-2 d-1), across the pan-Arctic and Boreal zone (>49 Deg N) at 1-km spatial resolution.
There is also one file in comma-separated values (.csv) format with flux tower data (GPP, NEE, and RECO, and 15 sites with CH4 data) for the years 2003-2014 used to calibrate and evaluate the modeled data.
Data file naming convention
The files are named Variable_YYYY_Month.nc4 where Variable is CH4, NEE, GPP, Reco, Rauto, or Rhetero, YYYY is 2003-2015, and Month is January-December. Example file name: CH4_2003_April.nc4.
Table 1. Variables in the data files.
| Variable | Units | Description |
|---|---|---|
| GPP | g C m-2 d-1 | Gross primary productivity, estimated using a light-use efficiency approach driven by FPAR estimates from MODIS combined Terra and Aqua data records. |
| Reco | g C m-2 d-1 | Ecosystem respiration, calculated as the sum of autotrophic respiration (Rauto) and heterotrophic respiration (Rhetero). |
| NEE | g C m-2 d-1 | Net ecosystem exchange of CO2 (NEE = Reco - GPP). |
| Rhetero | g C m-2 d-1 | Heterotrophic respiration, estimated using decomposition rates with environmental constraints applied to three near-surface soil organic carbon (SOC) pools. |
| Rauto | g C m-2 d-1 | Autotrophic respiration, estimated as a fraction of GPP. |
| CH4 | mg C m-2 d-1 | Methane emissions. Methane production is estimated using optimal CH4 production rates with environmental constraints applied to the labile soil carbon pool, and the transfer of CH4 from the soil to the atmosphere is modeled through vegetation, soil diffusion, and water ebullition pathways. |
Application and Derivation
Arctic-boreal landscapes are experiencing profound temperature warming, along with changes in ecosystem moisture status and disturbance from fire. This region is of global importance in terms of carbon feedbacks to climate, yet the sign (sink or source) and magnitude of the Arctic-boreal carbon budget within recent years remains highly uncertain. New estimates are provided in this dataset of recent (2003–2015) vegetation gross primary productivity (GPP), ecosystem respiration (Reco), net ecosystem CO2 exchange (NEE; Reco - GPP) and terrestrial methane (CH4) emissions for the Arctic-boreal zone using a satellite data-driven process-model for northern ecosystems (TCFM-Arctic), calibrated and evaluated using > 60 tower eddy covariance (EC) sites.
Quality Assessment
Agreement between eddy covariance (EC) flux tower records and TCFM-Arctic simulations was assessed according to mean residual error (MRE; EC flux observations - model flux estimates), root-mean-square-error (RMSE), and normalized RMSE (NRMSE; RMSE/y).
Data Acquisition, Materials, and Methods
Site Description
The study domain encompassed terrestrial landscapes within the Arctic-boreal zone, > 50°N. Most of this region remains frozen for more than half of the year (Kim et al., 2012, 2014). Approximately 84% of the domain is underlain by permafrost: 44% continuous; 14% discontinuous; and 26% sporadic or isolated permafrost (Brown et al., 2002). The colder, far northern, and higher elevation regions are characterized by treeless tundra communities, including sedge wetlands, shrub, graminoids, moss, and more barren landscapes of herbs and lichen (CAVM 2003). The warmer boreal region includes coniferous and deciduous forests of spruce, pine, aspen, birch, and larch. Much of the boreal understory is moss dominated, with wetter areas falling into the category of peat-forming fens and bogs (Vitt, 2006). The full study domain encompassed 19.7 x 10⁶ km2 (3.7 x 10⁶ km2 in tundra regions, 6 x 10⁶ km2 in boreal forests, 4.9 x 10⁶ km2 in boreal wetlands, and 5.1 x 10⁶ boreal shrubland/grassland); this excludes ponds, lakes, rivers, rock and ice, and barren vegetated lands. However, site-level summary values for boreal grassland/shrublands are not reported because of lack of representation by the EC towers.
Flux tower CO2 and CH4 datasets
The carbon flux data were produced through simulations of the Arctic Terrestrial Carbon Flux Model (TCFM-Arctic), a satellite data driven, process-based model for northern ecosystems. For model calibration, flux data from EC towers were obtained for 33 tundra and boreal sites across the Arctic-boreal region (> 49°N). Towers were selected where half-hourly data were available over at least a 2-year period. EC sites include ecosystems having permafrost classified as continuous (12 sites), discontinuous (6 sites) and sporadic/isolated (2 sites), and seasonal active layer thaw depths ranging from 20 cm (e.g., the more northern regions of Greenland, Russia, and North Slope Alaska) to > 70 cm (e.g., Scandinavia, boreal Alaska, and Canada). The remaining 13 tower sites are located outside the permafrost zone but experience a strong seasonal freezing of surface and subsurface soils. The EC boreal sites best represent forests and wetlands. Records were not identified from tower sites that represent mesic (non-forest, non-wetland) boreal shrubland/grasslands. The EC flux records used for model calibration were obtained through AmeriFlux, FluxNet, AsiaFlux, and individual tower principal investigators (see Watts et al., 2023 for further details). The EC records included half-hourly gap-filled NEE measurements partitioned into GPP and Reco using methodology deemed appropriate by the tower principal investigators (e.g., Stoy et al., 2006; Lasslop et al., 2010; Reichstein et al., 2012). In addition to CO2 flux, 15 of the tundra or boreal wetland sites also included half-hourly flux measurements of CH4. For independent model verification, model flux estimates were compared against monthly-averaged EC observations provided through the Arctic-Boreal CO2 flux record (ABCFlux; Virkkala et al., 2022). ABCFlux provided data from 35 EC locations (11 tundra; 22 boreal forest; 2 boreal wetland), after excluding EC sites that had been used for model calibration (see Watts et al., 2023 for further details).
TCFM-Arctic meteorology and remote sensing inputs
The Terrestrial Carbon Flux (TCF) model, developed as a precursor to the NASA Soil Moisture Active Passive (SMAP) mission Level 4 Carbon (L4_C) algorithms that provide remote sensing and EC data-informed carbon flux estimates (Jones et al., 2017; Kimball et al., 2009, 2016), was originally based on generalized plant functional types (PFTs) for global terrestrial carbon budgets. TCFM-Arctic is a variant of the TCF model that is designed to better represent northern high-latitude vegetation communities (Watts et al., 2014b, Watts et al., 2023). Land cover was obtained from merged classifications using the Circumpolar Arctic Vegetation Map (CAVM; Walker et al., 2005) to identify tundra communities, and the 300-m resolution ESA CCI-LC 2010 Epoch land cover product (Kirches et al., 2014) to identify boreal communities and wetlands. A peatland vegetation map was also applied to the merged land cover data to identify possible peat-forming wetland regions within the boreal zone (Watts et al., 2014b). Open water lake area was removed from each 1-km cell using a 1-km fractional water mask derived from the MODIS Collection 6 surface water mask (Carroll et al., 2017), so that the remaining grid area only represents terrestrial ecosystems.
The TCFM-Arctic model uses inputs from satellite optical remote sensing to infer changes in the fraction of photosynthetic active radiation absorbed by vegetation (FPAR). Quality screened 4-day, 1-km resolution FPAR values from MODIS combined Terra and Aqua data records (MCD15A3H; Myneni et al., 2015) were used as inputs for the GPP simulations. The MCD15A3H data were gap-filled to daily time steps using a simple linear interpretation method. Daily input meteorology from reanalysis was obtained from the Goddard Earth Observing System Data Assimilation Version 5 (GEOS-5) Modern-Era Retrospective analysis for Research and Applications (MERRA) archive (Rienecker et al., 2011) with a 1/2 x 2/3° spatial resolution. This included daily MERRA incoming shortwave solar radiation (W m−2) and atmospheric vapor pressure deficit (Pa) records used in the GPP algorithm, and near-surface (2 m) wind velocity (m/s; μm) for the vegetation component in the CH4 module. Near surface soil temperature (< 10 cm) and root zone soil moisture (1/2 x 2/3°) were obtained from the MERRA-Land product (Reichle et al., 2011).
TCFM-Arctic site-level assessments
Baseline carbon pools were initialized by continuously cycling (“spinning-up”) the model for 1,000 model years using recent climatology from 1985 to 2002 to reach a dynamic steady-state between estimated net primary productivity (NPP = GPP - Rauto) and near-surface SOC pools (following methods of Kimball et al., 2009, Watts et al., 2014b, Birch et al., 2021). The resulting baseline SOC pools were incorporated as a starting point for the 2003 to 2015 forward model simulations. Agreement between the tower EC records and TCFM-Arctic simulations was assessed according to mean residual error (MRE; EC flux observations - model flux estimates), root-mean-square-error (RMSE), normalized RMSE (NRMSE; RMSE/|Ó¯|), and median/quartile differences. This included the EC observation datasets for model calibration (see Watts et al., 2023) and independent model verification (Virkkala et al., 2022). The resulting TCFM-Arctic simulations were used to estimate annual flux budgets for each EC tower site.
Regional flux budgets & model comparisons
The TCFM-Arctic simulations were extended to the full Arctic-boreal domain at 1-km spatial resolution using the merged land cover map representing high latitude vegetation communities. Grid-cell flux estimates were aggregated to provide seasonal and annual carbon budgets over multiple regional domains. For the regional budget analyses, any grid cells where land cover did not represent vegetated tundra or boreal communities (i.e., cropland, developed or barren regions) were excluded. TCFM-Arctic does not account for carbon emissions from non-terrestrial aquatic environments, and thus open-water areas were not included in regional carbon budgets. TCFM-Arctic provides estimates of CH4 emissions for all grid cells classified as tundra or boreal wetland. To better account for fine-scale (i.e., < 1-km) variations in soil surface wetness and CH4 emissions that are not currently represented in coarser resolution soil moisture products, a topographic wetness index (TWI) based wet/dry mask was applied to the gridded CH4 emission estimates. The 1-km TWI-based mask was derived from an existing 90-m TWI dataset (Amatulli et al., 2020), which represents long-term moisture availability in the landscape. After applying the 1-km TWI-based masking, estimates of CH4 emission budgets from TCFM-Arctic were provided only for the fraction of each 1-km grid cell classified as wet. Methane emission budgets with and without the 1-km TWI-based masking were compared to assess the effect of finer-scale variation in surface wetness on regional budget estimates.
TCFM-Arctic carbon flux estimates were compared with flux estimates from several other available "bottom-up" process-based and statistical upscaling models as well as "top-down" atmospheric inversions. The model comparison analysis included a version of the Community Land Model that was calibrated to improve carbon flux estimates in Arctic-Boreal ecosystems (CLM 5; Birch et al., 2021); the NASA SMAP L4_C product (Jones et al., 2017; Kimball et al., 2009, 2016); FluxCom ensemble median CO2 fluxes from the FluxCom RS and FluxCom RS+METEO products (Jung et al., 2020); the MODIS MOD17 (MOD17A2H) GPP product (Running et al., 2015); statistically upscaled CO2 and CH4 fluxes, trained on eddy covariance and chamber flux observations (Virkkala et al., 2021, Peltola et al., 2019); three CO2 flux inversion experiments from the v10 OCO-2 (Orbiting Carbon Observatory-2) MIP (model intercomparison project) (Byrne et al., 2022, 2023); a recent synthesis of atmospheric CO2 inversions (Liu et al., 2020, 2022), and results from CarbonTracker-CH4 (Bruhwiler et al., 2014).
TCFM-Arctic flux estimates were also compared against atmospheric observations (i.e, 'bottom-up' versus 'top-down' assessment), following the methods of Watts et al., (2021), Schiferl and Commane (2022), and Schiferl et al., (2022). Atmospheric observations were obtained from the 2015 Atmospheric Radiation Measurement Carbon Measurements (ACME-V) and 2017 NASA ABoVE Arctic Carbon Aircraft Profile (Arctic- CAP) campaigns (Sweeney and McKain 2019). For case study locations in the North Slope of Alaska and Scotty Creek in the Northwest Territories, Canada, observations of atmospheric CO2 and CH4 enhancement (background concentration subtracted from the observed concentration) were compared to enhancements simulated by applying gas transport models to TCFM-Arctic carbon flux estimates. Please refer to Watts et al., (2023) for further details.
Data Access
These data are available through the Oak Ridge National Laboratory (ORNL) Distributed Active Archive Center (DAAC).
Gridded CO2 and CH4 Flux Estimates for pan-Arctic and Boreal Regions, 2003-2015
Contact for Data Center Access Information:
- E-mail: uso@daac.ornl.gov
- Telephone: +1 (865) 241-3952
References
Amatulli, G., McInerney, D., Sethi, T., Strobl, P. and Domisch, S., 2020. Geomorpho90m, empirical evaluation and accuracy assessment of global high-resolution geomorphometric layers. Scientific Data, 7(1), p.162. https://doi.org/10.1038/s41597-020-0479-6
Birch, L., Schwalm, C.R., Natali, S., Lombardozzi, D., Keppel-Aleks, G., Watts, J., Lin, X., Zona, D., Oechel, W., Sachs, T. and Black, T.A., 2021. Addressing biases in Arctic–boreal carbon cycling in the Community Land Model Version 5. Geoscientific Model Development, 14(6), pp.3361-3382. https://doi.org/10.5194/gmd-14-3361-2021
Brown, J., O. Ferrians, J.A. Heginbottom, and E. Melnikov. 2002. Circum-Arctic Map of Permafrost and Ground-Ice Conditions, Version 2. Boulder, Colorado USA. NSIDC: National Snow and Ice Data Center. https://doi.org/10.7265/skbg-kf16
Bruhwiler, L., Dlugokencky, E., Masarie, K., Ishizawa, M., Andrews, A., Miller, J., Sweeney, C., Tans, P. and Worthy, D., 2014. CarbonTracker-CH 4: an assimilation system for estimating emissions of atmospheric methane. Atmospheric Chemistry and Physics, 14(16), pp.8269-8293. https://doi.org/10.5194/acp-14-8269-2014
Byrne, B., Baker, D.F., Basu, S., Bertolacci, M., Bowman, K.W., Carroll, D., Chatterjee, A., Chevallier, F., Ciais, P., Cressie, N. and Crisp, D., 2022. National CO 2 budgets (2015–2020) inferred from atmospheric CO 2 observations in support of the global stocktake. Earth System Science Data Discussions, 2022, pp.1-59. https://doi.org/10.5194/essd-15-963-2023
Byrne, B., Liu, J., Yi, Y., Chatterjee, A., Basu, S., Cheng, R., Doughty, R., Chevallier, F., Bowman, K.W., Parazoo, N.C. and Crisp, D., 2022. Multi-year observations reveal a larger than expected autumn respiration signal across northeast Eurasia. Biogeosciences, 19(19), pp.4779-4799. https://doi.org/10.5194/bg-19-4779-2022
Carroll, M.L., C.M. DiMiceli, J.R.G. Townshend, R.A. Sohlberg, A.I. Elders, S. Devadiga, A.M. Sayer, and R.C. Levy. 2017. Development of an operational land water mask for MODIS Collection 6, and influence on downstream data products. International Journal of Digital Earth 10:207-218. https://doi.org/10.1080/17538947.2016.1232756
CAVM Team. 2003. Circumpolar Arctic Vegetation Map. (1:7,500,000 scale), Conservation of Flora and Fauna (CAFF) Map. No. 1. Fish and Wildlife Service, Anchorage, Alaska. ISBN: 0-9767525-0-6. https://www.geobotany.uaf.edu/cavm/
Dinerstein, E., D. Olson, A. Joshi, C. Vynne, N.D. Burgess, E. Wikramanayake, N. Hahn, S. Palminteri, P. Hedao, R. Noss, and M. Hansen. 2017. An ecoregion-based approach to protecting half the terrestrial realm. BioScience 67:534-545. https://doi.org/10.1093/biosci/bix014
Jones, L.A., Kimball, J.S., Reichle, R.H., Madani, N., Glassy, J., Ardizzone, J.V., Colliander, A., Cleverly, J., Desai, A.R., Eamus, D. and Euskirchen, E.S., 2017. The SMAP level 4 carbon product for monitoring ecosystem land–atmosphere CO 2 exchange. IEEE Transactions on Geoscience and Remote Sensing, 55(11), pp.6517-6532. https://doi.org/10.1109/TGRS.2017.2729343
Jung, M., Schwalm, C., Migliavacca, M., Walther, S., Camps-Valls, G., Koirala, S., Anthoni, P., Besnard, S., Bodesheim, P., Carvalhais, N. and Chevallier, F., 2020. Scaling carbon fluxes from eddy covariance sites to globe: synthesis and evaluation of the FLUXCOM approach. https://doi.org/10.5194/bg-17-1343-2020
Kim, Y., J.S. Kimball, K. Zhang, and K.C. McDonald. 2012. Satellite detection of increasing Northern Hemisphere non-frozen seasons from 1979 to 2008: Implications for regional vegetation growth. Remote Sensing of Environment 121:472-487. https://doi.org/10.1016/j.rse.2012.02.014
Kim, Y., J.S. Kimball, K. Zhang, K. Didan, I. Velicongna, and K.C. McDonald. 2014. Attribution of divergent northern vegetation growth responses to lengthening non-frozen season optical-NIR and microwave remote sensing. Int. J. Remote Sens. 35:3700-3721. https://doi.org/10.1080/01431161.2014.915595
Kim, Y., J.S. Kimball, J. Glassy, and J. Du. 2017. An extended global Earth system data record on daily landscape freeze-thaw status determined from satellite passive microwave remote sensing. Earth System Science Data 9:133-147. https://doi.org/10.5194/essd-9-133-2017
Kimball, J., L.A. Jones, J.P. Glassy, and R. Reichle. 2014. Soil Moisture Active Passive (SMAP) Algorithm Theoretical Basis Document. SMAP Level 4 Carbon Data Product (L4_C). Jet Propulsion Laboratory, California Institute of Technology. https://nsidc.org/sites/default/files/271_l4_c_reva_web_0.pdf
Kimball, J.S., L.A. Jones, J.P. Glassy, and R. Reichle. 2016. SMAP L4 Global Daily 9 km Carbon Net Ecosystem Exchange, Version 2. NASA National Snow and Ice Data Center Distributed Active Archive Center. https://doi.org/10.5067/UBKO5ZUI7I5V
Kimball, J., L.A. Jones, K. Zhang, F.A. Heinsch, K.C. McDonald, and W.C. Oechel. 2009. A satellite approach to estimate land-atmosphere CO2 exchange for Boreal and Arctic biomes using MODIS and AMSR-E. IEEE Transactions on Geoscience and Remote Sensing 47:569-587. https://doi.org/10.1109/TGRS.2008.2003248
Kirches, G, Brockmann, M. Boettcher, M. Peters, S. Bontemps, C. Lamarche, M. Schlerf, M. Santoro, and P. Defourny. 2014. CCI-LC Product User Guide. Land Cover (LC) project of the Climate Change Initiative (CCI). European Space Agency (ESA). https://www.esa-landcover-cci.org/
Liu, Z., Kimball, J.S., Ballantyne, A.P., Parazoo, N.C., Wang, W.J., Bastos, A., Madani, N., Natali, S.M., Watts, J.D., Rogers, B.M. and Ciais, P., 2022. Respiratory loss during late-growing season determines the net carbon dioxide sink in northern permafrost regions. Nature communications, 13(1), p.5626. https://doi.org/10.1038/s41467-022-33293-x
Liu, Z., Kimball, J.S., Parazoo, N.C., Ballantyne, A.P., Wang, W.J., Madani, N., Pan, C.G., Watts, J.D., Reichle, R.H., Sonnentag, O. and Marsh, P., 2020. Increased highâlatitude photosynthetic carbon gain offset by respiration carbon loss during an anomalous warm winter to spring transition. Global Change Biology, 26(2), pp.682-696. https://doi.org/10.1111/gcb.14863
Lasslop, G., M. Geichstein, D. Papale, A.D. Richardson, A. Arneth, A. Barr, P. Stoy, and G. Wohlfahrt. 2010. Separation of net ecosystem exchange into assimilation and respiration using a light response curve approach: critical issues and global evaluation. Global Change Biology 16:187-208. https://doi.org/10.1111/j.1365-2486.2009.02041.x
Loboda, T.V., E.E. Hoy, and M.L. Carroll. 2017. ABoVE: Study Domain and Standard Reference Grids. ORNL DAAC, Oak Ridge, Tennessee, USA. https://doi.org/10.3334/ORNLDAAC/1367
McGuire, A.D., T.R. Christensen, D.J. Hayes, A. Heroult, E. Euskirchen, Y. Yi, J.S. Kimball, C. Koven, P. Lafleur, P.A. Miller, W. Oechel, P. Peylin, and M. Williams. 2012. An assessment of the carbon balance of arctic tundra: comparisons among observations, process models, and atmospheric inversions. Biogeosciences 9:3185-3204. https://doi.org/10.5194/bg-9-3185-2012
Myneni, R., Y. Knyazikhin, and T. Park. 2015. MCD15A3H MODIS/Terra + Aqua leaf area index/FPAR 4-day L4 global 500m SIN grid V006. NASA EOSDIS Land Processes DAAC. http://doi.org/10.5067/MODIS/MCD15A3H.006
Peltola, O., Vesala, T., Gao, Y., Räty, O., Alekseychik, P., Aurela, M., Chojnicki, B., Desai, A.R., Dolman, A.J., Euskirchen, E.S. and Friborg, T., 2019. Monthly gridded data product of northern wetland methane emissions based on upscaling eddy covariance observations, Earth Syst. Sci. Data, 11, 1263–1289. https://doi.org/10.5194/essd-11-1263-2019
Reichle, R.H., R.D. Koster, G.J.M. De Lannoy, B.A. Forman, Q. Liu, S.P.P. Mahanama, and A. Touré. 2011. Assessment and enhancement of MERRA Land Surface Hydrology Estimates. Journal of Climage 24:6322-6338. https://doi.org/10.1175/JCLI-D-10-05033.1
Reichstein, M., P.C.Stoy, A.R. Desai, G. Lasslop, and A.D. Richardson. 2012. Partitioning of net fluxes. In: Aubinet, M., T. Vesala, and D. Papale (eds). Eddy Covariance. Springer Atmospheric Sciences. Springer: Dordrecht. https://doi.org/10.1007/978-94-007-2351-1_9
Running, S W, M Zhao (2015). User’s Guide. Daily GPP and Annual NPP (MOD17A2/A3) Products. NASA Earth Observing System MODIS Land Algorithm.
Schiferl, L., and R. Commane. 2022. ABoVE: TVPRM Simulated Net Ecosystem Exchange, Alaskan North Slope, 2008-2017. ORNL DAAC, Oak Ridge, Tennessee, USA. https://doi.org/10.3334/ORNLDAAC/1920
Schiferl, L.D., Watts, J.D., Larson, E.J., Arndt, K.A., Biraud, S.C., Euskirchen, E.S., Goodrich, J.P., Henderson, J.M., Kalhori, A., McKain, K. and Mountain, M.E., 2022. Using atmospheric observations to quantify annual biogenic carbon dioxide fluxes on the Alaska North Slope. Biogeosciences, 19(24), pp.5953-5972. https://doi.org/10.5194/bg-19-5953-2022
Stoy, P.C., G.G. Katul, M.B.S. Siqueira, J-Y. Juang, K.A. Novick, J.M. Uebelherr, and R. Oren. 2006. An evaluation of models for partitioning eddy covariance-measured net ecosystem exchange into photosynthesis and respiration. Agricultural and Forest Meteorology 141:2-18. https://doi.org/10.1016/j.agrformet.2006.09.001
Sweeney, C., and K. McKain. 2019. ABoVE: Atmospheric Profiles of CO, CO2 and CH4 Concentrations from Arctic-CAP, 2017. ORNL DAAC, Oak Ridge, Tennessee, USA. https://doi.org/10.3334/ORNLDAAC/1658
Virkkala, A.M., Aalto, J., Rogers, B.M., Tagesson, T., Treat, C.C., Natali, S.M., Watts, J.D., Potter, S., Lehtonen, A., Mauritz, M. and Schuur, E.A., 2021. Statistical upscaling of ecosystem CO2 fluxes across the terrestrial tundra and boreal domain: Regional patterns and uncertainties. Global Change Biology, 27(17), pp.4040-4059. https://doi.org/10.1111/gcb.15659
Virkkala, A.M., Natali, S.M., Rogers, B.M., Watts, J.D., Savage, K., Connon, S.J., Mauritz, M., Schuur, E.A., Peter, D., Minions, C. and Nojeim, J., 2021. The ABCflux database: Arctic-boreal CO 2 flux observations and ancillary information aggregated to monthly time steps across terrestrial ecosystems. Earth System Science Data Discussions, 2021, pp.1-54. https://doi.org/10.5194/essd-14-179-2022
Watts, J.D., Natali, S.M., Minions, C., Risk, D., Arndt, K., Zona, D., Euskirchen, E.S., Rocha, A.V., Sonnentag, O., Helbig, M. and Kalhori, A., 2021. Soil respiration strongly offsets carbon uptake in Alaska and Northwest Canada. Environmental Research Letters, 16(8), p.084051. https://doi.org/10.1088/1748-9326/ac1222
Watts, J.D., M. Farina, J.S. Kimball, L.D. Schiferl, Z. Liu, K.A. Arndt, D. Zona, A. Ballantyne, E.S. Euskirchen, F-J.W. Parmentier, M. Helbig, O. Sonnentag, T. Tagesson, J. Rinne, H. Ikawa, M. Ueyama, R. Suzuki, H. Kobayashi, T. Sachs, D.F. Nadeau, J. Kochendorfer, M.Jackowicz-Korczynski, A. Virkkala, M. Aurela, R. Commane, B.K. Byrne, L. Birch, M. Johnson, N. Madani, B. Rogers, J. Du, A. Endsley, K. Savage, B. Poulter, Z. Zhang, L.M. Bruhwiler, C. Miller, S. Goetz, and W.C. Oechel. 2023. Carbon uptake in Eurasian boreal forests dominates the high-latitude net ecosystem carbon budget. Global Change Biology 29:1870-1889. https://doi.org/10.1111/gcb.16553