Documentation Revision Date: 2025-06-04
Dataset Version: 1
Summary
This dataset includes 1,204 files in cloud optimized GeoTIFF (COG) format.
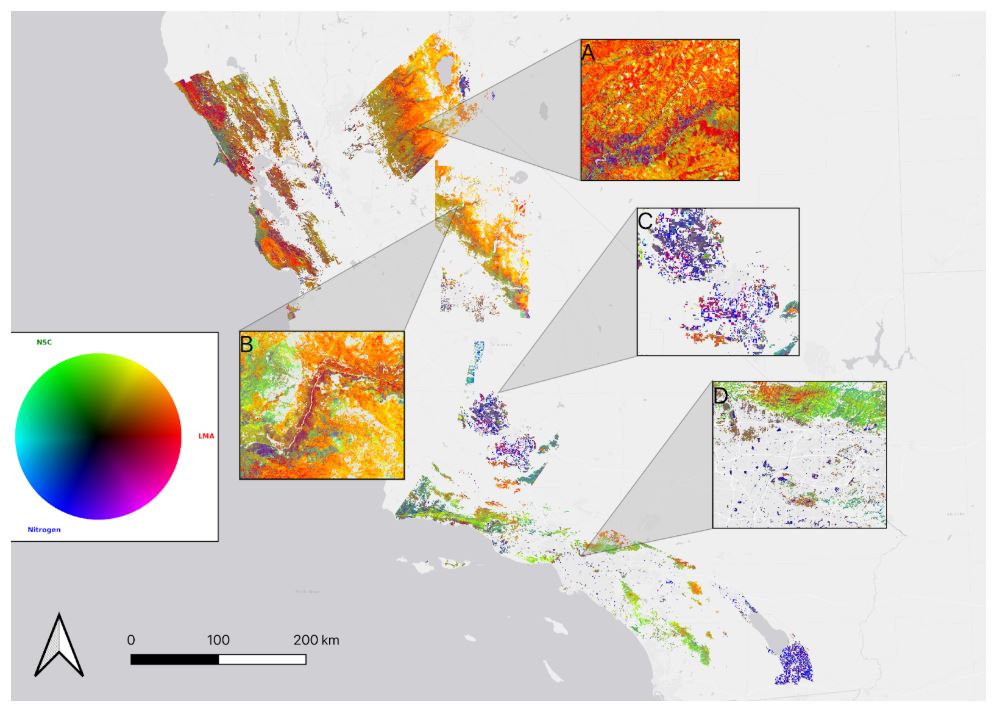
Figure 1. LMA-NSC-Nitrogen composites across WDTS flight boxes. (A) Conifer forests and regenerating clear cuts in the northern Sierra Nevada mountains. (B) Yosemite Valley and Merced River riparian vegetation. (C) Agriculture in the central valley. (D) The San Gabriel Mountains and urban vegetation in Los Angeles County. LMA = leaf mass per area. NSC = nonstructural carbohydrates. Flight boxes shown: yosemite_20140603, socal_20140414, tahoe_20140602, santabarbara_20140606, bayarea_20140528, sodastraw_20131117.
Citation
Zheng, T., E. Shafron, Z. Ye, F.D. Schneider, N. Queally, K. Kovach, R. Pavlick, and P.A. Townsend. 2025. WDTS: AVIRIS-Classic Derived Plant Trait Mosaics, 2013-2018. ORNL DAAC, Oak Ridge, Tennessee, USA. https://doi.org/10.3334/ORNLDAAC/2403
Table of Contents
- Dataset Overview
- Data Characteristics
- Application and Derivation
- Quality Assessment
- Data Acquisition, Materials, and Methods
- Data Access
- References
Dataset Overview
This dataset holds maps of 14 foliar functional traits derived from AVIRIS-Classic imagery over the western United States for the Western Diversity Time Series (WDTS) project. Imagery was acquired from 2013-04-10 to 2018-08-16 and a georeferenced, corrected surface reflectance product was developed for WDTS for 87 acquisitions. Foliar traits were derived from the reflectance product by applying partial least squares regression models. These traits include foliar concentrations of nitrogen, cellulose, lignin, fiber, sugar, starch, calcium, potassium, phosphorus, sulfur, phenolics, and nonstructural carbohydrates. In addition, area concentration of chlorophyll A+B and leaf dry mass per area were estimated. The WDTS includes airborne imagery collected at least once per year (but often several times) over large areas of California for almost all years from 2013-2024. This dataset will enable multi-temporal analyses of plant functional traits and biodiversity at the ecoregion scale.
Project: Western Diversity Time Series (WDTS)
The Western Diversity Time Series (WDTS) is a NASA field investigation focusing on observing California's ecosystems and providing critical information on natural disasters such as volcanoes, wildfires, and drought. WDTS collects seasonal visible to short wave infrared (VSWIR) and thermal infrared (TIR) airborne imagery using instruments including the Airborne Visible/Infrared Imaging Spectrometer (AVIRIS), MODIS/ASTER Airborne Simulator (MASTER), Hyperspectral Thermal Emission Spectrometer (HyTES), and Pushbroom Imager for Cloud and Aerosol Research and Development (PICARD) on a NASA ER-2 high-altitude platform. WDTS aims to provide a benchmark on the state of ecosystems against which future changes can be assessed. WDTS started in 2020 and is a continuation of the HyspIRI Airborne campaign in 2013-2018.
Related Publications:
Zheng, T, Z. Ye, Z.H. Wang, K. Kovach, R. Pavlick, P. Townsend. 2025a. Predicting canopy-level plant functional traits from imaging spectroscopy using pre-trained PLSR models: best practices for model transfer to another sensor. In preparation for ISPRS Journal of Photogrammetry and Remote Sensing.
Zheng, T., E. Shafron, E., Z. Ye, F.D. Schneider, N. Queally, R. Pavlick, and P. Townsend. 2025b. Revealing drought-induced changes in plant functional traits in the Sierra Nevada using imaging spectroscopy. In preparation for Proceedings of the National Academy of Sciences
Related Dataset:
Shafron, E., T. Zheng, Z. Ye, F.D. Schneider, N. Queally, R. Pavlick, and P. Townsend. 2025. WDTS: AVIRIS-Classic L2B Corrected and Georectified Surface Reflectance, 2013-2018. ORNL DAAC, Oak Ridge, Tennessee, USA. https://doi.org/10.3334/ORNLDAAC/2391
- The WDTS surface reflectance product used to derive the foliar traits.
Green, R.O., D.R. Thompson, J.W. Boardman, J.W. Chapman, M. Eastwood, M. Helmlinger, S.R. Lundeen, and W. Olson-Duvall. 2023. AVIRIS-Classic: L1B Calibrated Radiance, Facility Instrument Collection, V1. ORNL DAAC, Oak Ridge, Tennessee, USA. https://doi.org/10.3334/ORNLDAAC/2155
- L1B radiance products from the AVIRIS-Classic Facility Instrument collection.
Green, R.O., D.R. Thompson, J.W. Boardman, J.W. Chapman, M. Eastwood, M. Helmlinger, S.R. Lundeen, and W. Olson-Duvall. 2023. AVIRIS-Classic: L2 Calibrated Reflectance, Facility Instrument Collection, V1. ORNL DAAC, Oak Ridge, Tennessee, USA. https://doi.org/10.3334/ORNLDAAC/2154
- L2 surface reflectance products from the AVIRIS-Classic Facility Instrument collection.
Hook, S.J., J.S. Myers, K.J. Thome, M. Fitzgerald, A.B. Kahle, Airborne Sensor Facility NASA Ames Research Center, and R.O. Green. 2025. MASTER: Western Diversity Time Series Campaign, WDTS, Spring 2024. ORNL DAAC, Oak Ridge, Tennessee, USA. https://doi.org/10.3334/ORNLDAAC/2383
- Imagery from MASTER instrument with overlapping coverage.
Acknowledgement:
The research was carried out at the Jet Propulsion Laboratory, California Institute of Technology, under a contract with NASA (80NM0018D0004). It was supported by NASA's Surface Biology and Geology (SBG) program (grant 1673139) and NASA's Biodiversity Program BioCube (grant 1669379). Additional support was provided by NSF ASCEND Biology Integration Institute (BII) (grant DBI 2021898). N. Queally was supported by the National Science Foundation (NSF) Graduate Research Fellowship Program (grant DGE-1747503) and NASA FINESST award (80NSSC22K1532). E. Shafron was partially supported by the NSF Graduate Research Fellowship Program (grant 366535).
Data Characteristics
Spatial Coverage: California, Nevada, U.S.
Spatial Resolution: 30 m
Temporal Coverage: 2013-04-10 to 2018-08-16
Temporal Resolution: Approximately twice per year during growing seasons
Study Area: (All latitudes and longitudes given in decimal degrees)
| Site | Northernmost Latitude | Southernmost Latitude | Easternmost Longitude | Westernmost Longitude |
|---|---|---|---|---|
| California; western Nevada | 39.5491 | 32.7710 | -123.6573 | -114.8824 |
Data File Information
This dataset includes 1,204 files in cloud optimized GeoTIFF format (*.tif).
The file naming convention is <flightbox>_<YYYYMMDD>_<trait>.tif, where
- <flightbox> - name of WDTS study areas: "bayarea", "santabarbara", "socal", "sodastraw", "tahoe", "yosemite"
- <YYYYMMDD> - date of AVIRIS-Classic imagery acquisition
- <trait> - foliar trait as described in Table 1
GeoTiFF characteristics:
- coordinate system: projected into UTM zones 10 or 11 (EPSG: 32610 or 32611)
- spatial resolution: 30 m
- number of bands: 11 (see Table 2).
- pixel values: bands 1-2 = trait units as listed Table 1; bands 3-10 = 0/1 quality control flags (Table 2); band 11 = flightline number
Table 1. Foliar functional traits derived from AVIRIS-Classic surface reflectance. Maximum values were determined from Wang et al. (2020). Chemical traits can be converted from mass-basis to area-basis by multiplying values by LMA. For chlorophylls, divide value by LMA.
| Trait | Units | Description | Maximum value |
|---|---|---|---|
| LMA | g m-2 | leaf dry mass per area | 507.07 |
| Nitrogen | mg g-1 | nitrogen concentration | 58.62 |
| Cellulose | mg g-1 | cellulose concentration | 412.32 |
| Lignin | mg g-1 | lignin concentration | 556.88 |
| Fiber | mg g-1 | fiber concentration | 846.43 |
| Sugar | mg g-1 | sugar concentration | 394.18 |
| Starch | mg g-1 | starch concentration | 87.39 |
| Calcium | mg g-1 | calcium concentration | 77.57 |
| Potassium | mg g-1 | potassium concentration | 39.34 |
| Phosphorus | mg g-1 | phosphorus concentration | 3.56 |
| Sulfur | mg g-1 | sulfur concentration | 4.78 |
| Phenolics | mg g-1 | phenolics concentration | 271.97 |
| Chlorophylls | µg cm-2 | chlorophyll a+b per area | 98.39 |
| NSC | mg g-1 | nonstructural carbohydrates | 471.49 |
Table 2. Bands in GeoTIFF files.
| Band | Band Name | Description | Used to mask trait predictions? | Range of values |
|---|---|---|---|---|
| 1 | s6v3_mean | Mean trait prediction across 200 model permutations | Yes | Variable |
| 2 | s6v3_sd | Standard deviation of trait predictions across 200 model permutations | Yes | Variable |
| 3 | QC_all | Indicates whether data passes QC checks or not. 0 = did not pass, 1 = passed.. | Yes | 0-1 |
| 4 | QC_fc | Indicates whether or not pixel has fractional vegetation cover of >= 0.5. 0 = no, 1 = yes | Yes | 0-1 |
| 5 | QC_fs | Indicates whether or not pixel has fractional snow cover of <= 0.3. 0 = no, 1 = yes | Yes | 0-1 |
| 6 | QC_uncertainty | Indicates whether or not pixel uncertainty is less than 0.3 | Yes | 0-1 |
| 7 | QC_shadow | Indicates whether or not pixel’s reflectance at 976 nm is >= 0.1. 0 = no, 1 = yes. | Yes | 0-1 |
| 8 | QC_pixanomaly | Indicates whether or not any wavelengths have reflectance values >1 or <0. 0 = yes, 1 = no. | Yes | 0-1 |
| 9 | QC_range | Indicates whether or not mean trait prediction is within NEON range of trait measurement values. 0=no, 1=yes. | Yes | 0-1 |
| 10 | QC_edge | Indicates whether or not pixel is within 14.5% left-most area of flightline, which has a known brightness anomaly. 0=no, 1=yes. | No | 0-1 |
| 11 | flight_id | Flightline number of pixel. | No | 1-28 |
User Note: See information at the end of Section 5 about files named yosemite_<YYYYMMDD>_<trait>_v2.tif.
Application and Derivation
The NASA Western Diversity Time Series (WDTS) was developed out of the 2013-2014 NASA HyspIRI Preparatory Campaign in California, a NASA effort to demonstrate the science that would underlay a global imaging spectroscopy mission (Lee et al., 2015). The original WDTS was designed to capture the diversity of California's ecosystems across five large flight boxes that were imaged a minimum of three times per year to represent key phenological time points (Figure 1).
Following the 2018 Decadal Survey and the rebranding of HyspIRI to Surface Biology and Geology (SBG), AVIRIS-Classic and other imaging spectroscopy data have continued to be acquired periodically over the WDTS flight boxes to maintain a long-term time series that should enable quantification of changes in vegetation function and functional diversity from imaging spectroscopy data. This dataset provides maps of plant functional trait built from empirical models relating imagery spectra to traits via partial least squares regression.
Quality Assessment
Foliar functional traits were estimated from partial least squares regression (PLSR) models. Overall, these models have a high degree of confidence in core leaf economics-spectrum traits (chlorophyll, nitrogen, phosphorus) and carbon use traits (sugar, lignin, NSC), but less so in traits associated with base cation concentrations and defense.
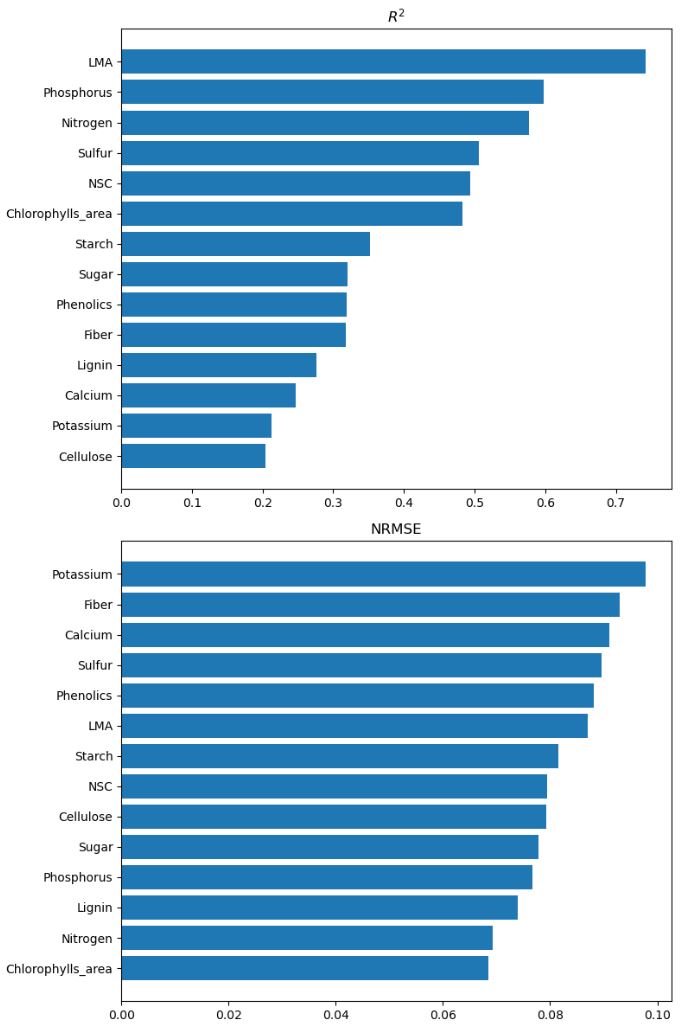
Figure 2. Model R2 and normalized root mean squared error (RMSE/value range) for each trait in the dataset
Data Acquisition, Materials, and Methods
AVIRIS-Classic imagery was collected on the NASA ER-2 aircraft from altitudes of 19,800 m, yielding imagery with 15-20 m ground sample distance. AVIRIS-Classic is a 224-channel “whisk-broom” instrument with four grating imaging spectrometers covering a spectral range from 400-2500 nm, with spectral sampling every 10 nm. Radiometric calibration accuracy is within 1 nm, and signal to noise ratio is greater than 100:1 (Green et al., 1998). The 2013-2014 AVIRIS-Classic acquisitions were paired with concurrent MODIS/ASTER Airborne Simulator (MASTER) 50-band visible-to-thermal infrared collections (e.g., Hook et al., 2022).
Table 3. Flightboxes with dates of coverage and number of AVIRIS-Classic flight lines and acquisitions.
| Flightbox | First date | Last date | Flight lines | Acquisitions |
|---|---|---|---|---|
| bayarea | 2013-04-10 | 2018-08-16 | 143 | 15 |
| santabarbara | 2013-04-11 | 2018-06-28 | 104 | 11 |
| socal | 2013-04-12 | 2018-06-25 | 107 | 15 |
| sodastraw | 2013-05-02 | 2018-06-21 | 12 | 12 |
| tahoe | 2013-05-02 | 2018-06-21 | 144 | 15 |
| yosemite | 2013-05-03 | 2018-06-22 | 171 | 16 |
This dataset provides canopy functional trait maps built from empirical models relating surface reflectance spectra to foliar traits via partial least squares regression (PLSR). Models were developed in tandem with the WDTS surface reflectance product (Shafron et al., 2025), and were trained on this corrected reflectance dataset (Figure 3). The training dataset was compiled from four primary data sources (Figure 4).
- Field data from the NASA Forest Functional Types (FFT) campaign: Trait data from 237 forest plots spanning a broad region of the Upper Midwest and Northeast U.S. (Serbin et al., 2014; Singh et al., 2015).
- Field data collected in California in 2018 (CA2018).
- Plot data from various sources for California in 2013 (CA2013).
- Pixels selected from NEON trait maps (Wang et al., 2020) with concurrent AVIRIS-Classic acquisitions.
See Zheng et al. (2025a) for details of training dataset compilation and quality control.
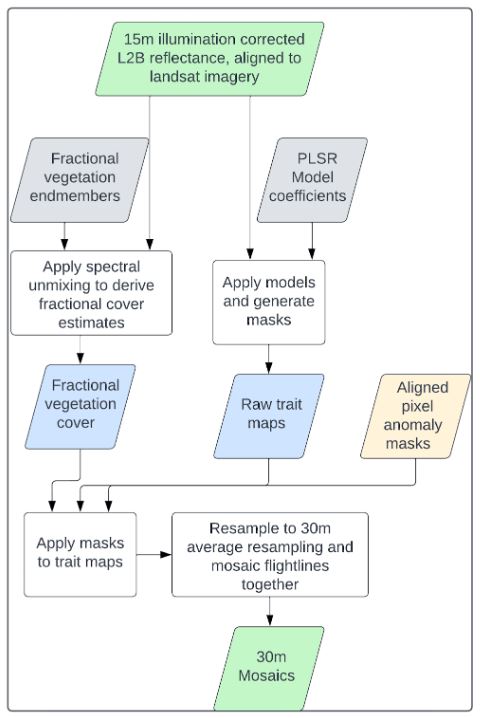
Figure 3. Processing workflow to derive WDTS foliar trait maps. Gray boxes indicate starting products, white boxes indicate processing steps, beige boxes indicate intermediate products. This product is highlighted in green at the end of the workflow.
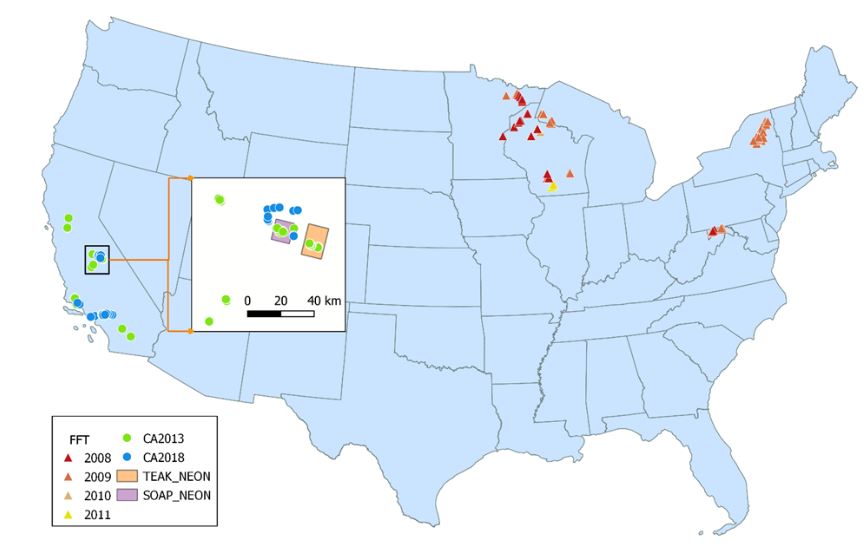
Figure 4. Locations for the field dataset (FFT, CA2013, and CA2018) and the boundaries of the NEON boxes for TEAK and SOAP (the enlarged inset). For the FFT set, plots are colored to show the year they were sampled.
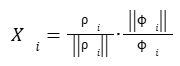
The PLSR approach of (Wang et al., 2020) was modified to normalize reflectance values corresponding to wavelengths captured by AVIRIS-Classic’s four separate detectors, which effectively prevented between-detector radiometric calibration differences from interfering with resulting map outputs. Between-year calibration and atmospheric correction differences were corrected by selecting pixels from pseudo-invariant targets in Yosemite (a rock quarry), and normalizing imagery by the target spectra that aligned with the year of acquisition. The evaluation of the between-year comparability of the corrected AVIRIS-Classic spectra is detailed in Zheng et al. (2025b). Under this modeling scheme, our spectra, Xi, are normalized following:
 ,
,
where ρ is the corrected surface reflectance for a given pixel, ||ρ|| is the L2 norm of corrected surface reflectance for that pixel, Φ is the corrected surface reflectance of our pseudo-invariant object during the year of that acquisition, ||Φ|| is the L2 norm of the pseudo-invariant object’s surface reflectance, and i denotes each spectral region of the AVIRIS-Classic instrument. Spectral regions for traits are 400-1262 nm (Chlorophyll only), 1000-1262 nm, 1262-1870 nm, and 1880-2400 nm. Chlorophyll is the only model that relies on visible wavelengths, owing to the much stronger absorption and reflectance features in that spectral region relative to any other trait.
To remove trait predictions in non-vegetated or snowy areas, fractional vegetation and snow cover masks were generated for each pixel, using spectral unmixing. This method used a set of endmembers (EMs) extracted from a flightline in the Yosemite box (f170607t01p00r16), representative of green vegetation, bare surface, and snow (Sousa et al., 2022). EMs and imagery are then normalized using the L2 (euclidean) norm, and an unconstrained ordinary least squares estimate was used to generate the fractional abundance for the target EMs (Settle and Drake, 1993). Finally, fractional abundance estimates for each cover type were constrained to be greater than zero and summed to unit. The resulting fractional cover estimates were then used in the final masking and mosaicing process to filter out unsuitable pixels.
Occasionally there were anomalously low or high reflectance values in pixels, driven by either sensor issues or extremely low solar zenith angles. In 2018, there was a pervasive striping anomaly that affected a large portion of the WDTS flightlines in that year, yielding a disproportionately large number of such pixels. To minimize these types of anomalies, pixels with reflectance values of less than 0 or greater than 1 in any wavelength during summer acquisitions, and less than -0.2 or greater than 1 in fall/winter acquisitions, were removed. The relaxed lower threshold in fall/winter was due to lower solar zenith angles yielding lower than average reflectance values.
Estimate uncertainty was measured by (standard deviation of jackknifed predictions/mean prediction). To determine an appropriate uncertainty level at which to mask out pixels, the percent of valid pixels remaining was calculated for modeling uncertainty using cutoffs ranging from 0-1, in 0.02 level increments. On average, a 30% uncertainty threshold retained approximately 96% of pixels while maintaining high confidence in retained pixels. This analysis was performed on potassium, because it had the second lowest R2 and highest normalized RMSE out of all modeled traits. Smaller uncertainty thresholds resulted in exponentially more data loss, and higher thresholds had little marginal benefit in terms of data retention.
Data in files named “yosemite_*_v2.tif” were derived from L2 data that were processed specifically for the purposes of plant functional trait mapping, separate from JPL's L2 data of record (Green et al., 2023). Atmospheric correction and radiance calibration parameters used for these "v2" data were slightly different from the L2 data of record. Reflectance from these "v2" data were generally more radiometrically stable over time than the JPL version of record; however, both trait products are included in this dataset. These "v2" versions of L2 data only exist for the yosemite flightbox for June of 2013 and 2015.
The 'v2' Yosemite trait maps, produced using the more stable L2 reflectance data and calibrated with in-box quarry spectra, are analysis-ready for studying year-to-year variations. While trait maps for other regions are useful for examining spatial patterns, their temporal consistency is less certain. Users should be cautious when interpreting temporal trends from these maps.
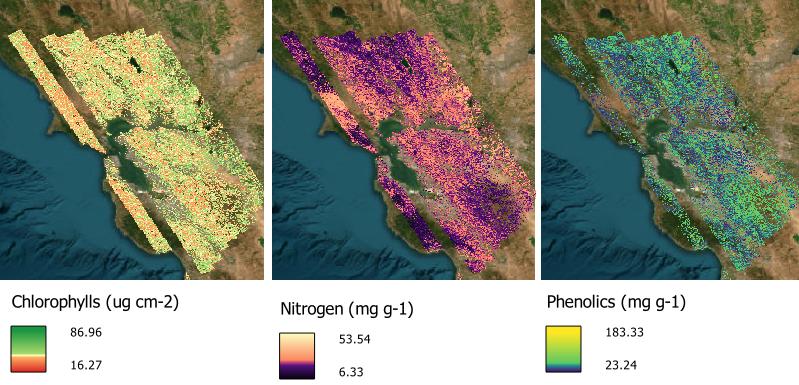
Figure 5. Foliar concentrations of chlorophyll A+B, nitrogen, and phenolics in the bayarea flightbox around San Francisco Bay, California, on April 10 2013. Concentrations were derived from a mosaic of AVIRIS-Classic images acquired on that date and estimated with regression models to relate surface reflectance to field measurements of these foliar functional traits. Sources: bayarea_20130410_Chlorophylls_30m.tif, bayarea_20130410_Nitrogen_30m.tif, bayarea_20130410_Phenolics_30m.tif, basemap: ESRI World Imagery
Data Access
These data are available through the Oak Ridge National Laboratory (ORNL) Distributed Active Archive Center (DAAC).
WDTS: AVIRIS-Classic Derived Plant Trait Mosaics, 2013-2018
Contact for Data Center Access Information:
- E-mail: uso@daac.ornl.gov
- Telephone: +1 (865) 241-3952
References
Green, R. O., M.L. Eastwood, C.M. Sarture, T.G. Chrien, M. Aronsson, B.J. Chippendale, J.A. Faust, B.E. Pavri, C.J. Chovit, M. Solis, M.R. Olah, and O. Williams. 1998. Imaging Spectroscopy and the Airborne Visible/Infrared Imaging Spectrometer (AVIRIS). Remote Sensing of Environment 65:227–248. https://doi.org/10.1016/S0034-4257(98)00064-9
Green, R.O., D.R. Thompson, J.W. Boardman, J.W. Chapman, M. Eastwood, M. Helmlinger, S.R. Lundeen, and W. Olson-Duvall. 2023. AVIRIS-Classic: L1B Calibrated Radiance, Facility Instrument Collection, V1. ORNL DAAC, Oak Ridge, Tennessee, USA. https://doi.org/10.3334/ORNLDAAC/2155
Green, R.O., D.R. Thompson, J.W. Boardman, J.W. Chapman, M. Eastwood, M. Helmlinger, S.R. Lundeen, and W. Olson-Duvall. 2023. AVIRIS-Classic: L2 Calibrated Reflectance, Facility Instrument Collection, V1. ORNL DAAC, Oak Ridge, Tennessee, USA. https://doi.org/10.3334/ORNLDAAC/2154
Hook, S.J., J.S. Myers, K.J. Thome, M. Fitzgerald, A.B. Kahle, Airborne Sensor Facility NASA Ames Research Center, and R.O. Green. 2022. MASTER: HyspIRI Airborne Campaign, California, Late Spring 2013. ORNL DAAC, Oak Ridge, Tennessee, USA. https://doi.org/10.3334/ORNLDAAC/1968
Hook, S.J., J.S. Myers, K.J. Thome, M. Fitzgerald, A.B. Kahle, Airborne Sensor Facility NASA Ames Research Center, and R.O. Green. 2025. MASTER: Western Diversity Time Series Campaign, WDTS, Spring 2024. ORNL DAAC, Oak Ridge, Tennessee, USA. https://doi.org/10.3334/ORNLDAAC/2383
Lee, C.M., M.L. Cable, S.J. Hook, R.O. Green, S.L. Ustin, D.J. Mandl, and E.M. Middleton. 2015. An introduction to the NASA Hyperspectral InfraRed Imager (HyspIRI) mission and preparatory activities. Remote Sensing of Environment 167:6–19. https://doi.org/10.1016/j.rse.2015.06.012
Serbin, S.P., A. Singh, B.E. McNeil, C.C. Kingdon, and P.A. Townsend. 2014. Spectroscopic determination of leaf morphological and biochemical traits for northern temperate and boreal tree species. Ecological Applications 24:1651–1669. https://doi.org/10.1890/13-2110.1
Settle, J.J., and N.A. Dreke. 1993. Linear mixing and the estimation of ground cover proportions. International Journal of Remote Sensing 14:1159–1177. https://doi.org/10.1080/01431169308904402
Shafron, E., T. Zheng, Z. Ye, F.D. Schneider, N. Queally, R. Pavlick, and P. Townsend. 2025. WDTS: AVIRIS-Classic L2B Corrected and Georectified Surface Reflectance, 2013-2018. ORNL DAAC, Oak Ridge, Tennessee, USA. https://doi.org/10.3334/ORNLDAAC/2391
Singh, A., S.P. Serbin, B.E. McNeil, C.C. Kingdon, and P.A. Townsend. 2015. Imaging spectroscopy algorithms for mapping canopy foliar chemical and morphological traits and their uncertainties. Ecological Applications 25:2180–2197. https://doi.org/10.1890/14-2098.1
Sousa, D., P. Brodrick, K. Cawse-Nicholson, J.B. Fisher, R. Pavlick, C. Small, and D.R. Thompson. 2022. The Spectral Mixture Residual: A Source of Low-Variance Information to Enhance the Explainability and Accuracy of Surface Biology and Geology Retrievals. Journal of Geophysical Research: Biogeosciences 127:e2021JG006672. https://doi.org/10.1029/2021JG006672
Wang, Z., A. Chlus, R. Geygan, Z. Ye, T. Zheng, A. Singh, J.J. Couture, J. Cavender-Bares, E.L. Kruger, and P.A. Townsend. 2020. Foliar functional traits from imaging spectroscopy across biomes in eastern North America. New Phytologist 228:494–511. https://doi.org/10.1111/nph.16711
Zheng, T, Z. Ye, Z.H. Wang, K. Kovach, R. Pavlick, P. Townsend. 2025a. Predicting canopy-level plant functional traits from imaging spectroscopy using pre-trained PLSR models: best practices for model transfer to another sensor. In preparation for ISPRS Journal of Photogrammetry and Remote Sensing.
Zheng, T., E. Shafron, E., Z. Ye, F.D. Schneider, N. Queally, R. Pavlick, and P. Townsend. 2025b. Revealing drought-induced changes in plant functional traits in the Sierra Nevada using imaging spectroscopy. In preparation for Proceedings of the National Academy of Sciences