Documentation Revision Date: 2025-03-23
Dataset Version: 1
Summary
This dataset includes 3395 files: 679 binary ENVI files, 679 ENVI header files, and 2037 JSON files.
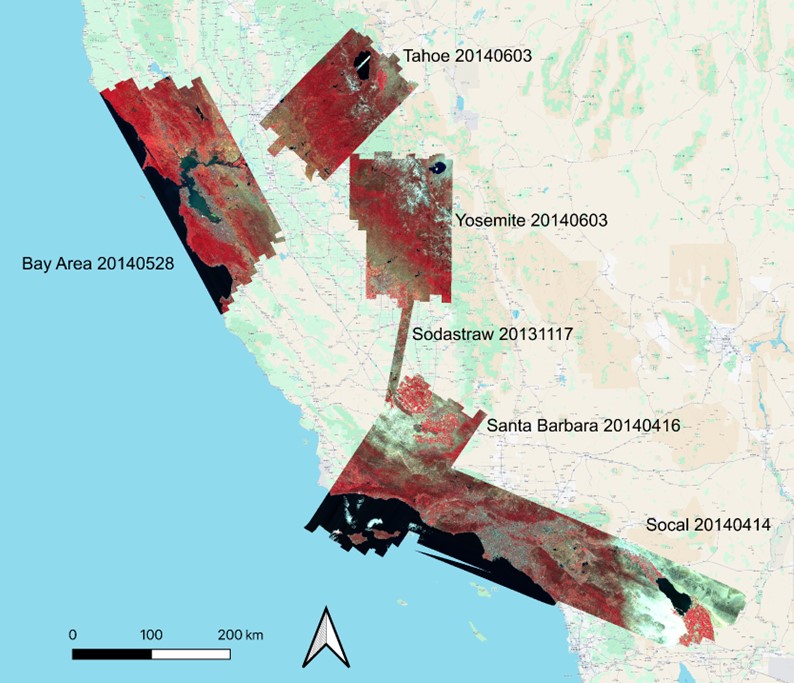
Figure 1. Color-infrared surface reflectance. Acquisitions shown are representative of the spatial coverage of flight boxes for the Western Diversity Time Series project over California and western Nevada, U.S.
Citation
Shafron, E., T. Zheng, Z. Ye, F.D. Schneider, N. Queally, R. Pavlick, and P.A. Townsend. 2025. WDTS: AVIRIS-Classic L2B Corrected and Georectified Surface Reflectance, 2013-2018. ORNL DAAC, Oak Ridge, Tennessee, USA. https://doi.org/10.3334/ORNLDAAC/2391
Table of Contents
- Dataset Overview
- Data Characteristics
- Application and Derivation
- Quality Assessment
- Data Acquisition, Materials, and Methods
- Data Access
- References
Dataset Overview
This dataset includes Level-2 (L2) surface reflectance imagery from the AVIRIS-Classic instrument collected for NASA's Western Diversity Time Series Project over California and Nevada in 2013 to 2018. AVIRIS-Classic imagery were collected on the NASA ER-2 from altitude of 19,800 m, yielding imagery with 15-20 m ground sample distance. AVIRIS-Classic is a 224-channel whisk-broom instrument with four grating imaging spectrometers covering a spectral range from 400-2500 nm, with spectral sampling every 10 nm (Green et al., 1998). Radiometric calibration accuracy is within 1 nm, and signal to noise ratio is greater than 100:1 (Green et al., 1998). Existing L2 imagery were reprocessed co-register pixels with cloud-free panchromatic imagery from Landsat. Then, topographic, FlexBRDF, and glint corrections were applied and the georectified images were resampled to 15-m spatial resolution.
Project: Western Diversity Time Series (WDTS)
The Western Diversity Time Series (formerly HyspIRI) airborne campaign is a multi-year effort to observe California’s ecosystems and provides critical information on natural disasters such as volcanoes, wildfires, and drought. WDTS collects seasonal visible to short wave infrared (VSWIR) and thermal infrared (TIR) airborne imagery using instruments including the Airborne Visible/Infrared Imaging Spectrometer (AVIRIS), the MODIS/ASTER Airborne Simulator (MASTER), and the Hyperspectral Thermal Emission Spectrometer (HyTES) on a NASA ER-2 high-altitude platform. WDTS aims to provide a benchmark on the state of ecosystems against which future changes can be assessed.
Related Datasets:
Green, R.O., D.R. Thompson, J.W. Boardman, J.W. Chapman, M. Eastwood, M. Helmlinger, S.R. Lundeen, and W. Olson-Duvall. 2023a. AVIRIS-Classic: L1B Calibrated Radiance, Facility Instrument Collection. ORNL DAAC, Oak Ridge, Tennessee, USA. https://doi.org/10.3334/ORNLDAAC/2155
Green, R.O., D.R. Thompson, J.W. Boardman, J.W. Chapman, M. Eastwood, M. Helmlinger, S.R. Lundeen, and W. Olson-Duvall. 2023b. AVIRIS-Classic: L2 Calibrated Reflectance, Facility Instrument Collection. ORNL DAAC, Oak Ridge, Tennessee, USA. https://doi.org/10.3334/ORNLDAAC/2154
- The corrected and georectified reflectance images were derived from this Green et al. (2023b) dataset.
Hook, S.J., J.S. Myers, K.J. Thome, M. Fitzgerald, A.B. Kahle, Airborne Sensor Facility NASA Ames Research Center, and R.O. Green. 2024. MASTER: Western Diversity Time Series Campaign, WDTS, Spring 2024. ORNL DAAC, Oak Ridge, Tennessee, USA. https://doi.org/10.3334/ORNLDAAC/2383
- Imagery from the MASTER instrument in 2024 with overlapping geographic coverage.
Acknowledgement:
The research was carried out at the Jet Propulsion Laboratory (JPL), California Institute of Technology, under a contract with the National Aeronautics and Space Administration (80NM0018D0004). It was supported by the NASA Surface Biology and Geology (SBG) project through JPL award 1673139 to the University of Wisconsin and the NASA Biodiversity Program “BioCube” project through JPL award 1669379. Additional support was provided by NSF ASCEND Biology Integration Institute (BII) (grant DBI 2021898). N. Queally was supported by the National Science Foundation (NSF) Graduate Research Fellowship Program (grant DGE-1747503) and a NASA FINESST award (80NSSC22K1532). E. Shafron was partially supported by the NSF Graduate Research Fellowship Program (grant 366535).
Data Characteristics
Spatial Coverage: Portions of California and western Nevada, U.S.
Spatial Resolution: 15 m
Temporal Coverage: 2013-04-10 to 2018-08-16
Temporal Resolution: One-time estimate
Study Area: Latitude and longitude are given in decimal degrees.
| Site | Northernmost Latitude | Southernmost Latitude | Easternmost Longitude | Westernmost Longitude |
|---|---|---|---|---|
| California; western Nevada | 39.6410 | 30.7415 | -123.6418 | -115.1111 |
Data File Information
This dataset includes 3395 files: 679 binary ENVI files, 679 ENVI header files, and 2037 JSON files.
There are 652 flight lines with five files for each line. Each flight line includes a surface reflectance image in ENVI format consisting of an ENVI binary file (.bin) with an associated header (.hdr) file holding metadata in text format. In addition, there are three JSON files that hold ground control points (GCP) used in georectification, coefficients used for topographic correction, and coefficients used for bidirectional reflectance distribution function (BRDF) correction.
The naming convention for the ENVI files is <flight prefix>_refl_corrected_15m_<ver>.<ext>, where
- <flight prefix> = flight line identifier, f<YYMMDD>t01p00r<aa>, encoding the date and time by year (YY), month (MM), day (DD), and the airborne flight run number (aa) (e.g., f060426t01p00r03).
- "refl_corrected_15m" = denotes topographic, BRDF, and glint corrections along spatial resampling to 15-m resolution.
- <ver> = additional element (e.g., "v2") for some flightlines in the yosemite box in which surface reflectance was processed with an alternative software algorithm purposed for mapping plant functional traits (see Section 5).
- <ext> = file extension of "bin" denotes ENVI binary data files, while “hdr” denotes the ENVI header files.
The header (.hdr) for each ENVI holds metadata for the binary data file, including:
- number of samples (rows), lines (rows), and bands
- band information: wavelengths (nm) and full width at half maximum (fwhm) values
- data type (4 = Float32), interleave type (band sequential, BSQ), and byte order
- map info: projection and datum, coordinates for x y reference points, pixel size, map units, and UTM zone.
ENVI Characteristics
- The ENVI images are in a UTM, WGS-84 projected coordinate system. Data are from UTM zones 10N and 11N (EPSG 32610 and 32611, respectively), and the UTM zone is specified in each header file.
- Valid reflectance values range from 0.0 to 1.0. The data include occasional negative values that may be valid if modeled surface reflectance is very low; atmospheric correction algorithms incorporated instrument noise and could produce negative values.
- Nodata values are indicated as -9999.
The naming conventions for the JSON files are:
- Ground control points: <flight prefix>_refl_corrected_GCP.json
- FlexBRDF correction coefficients: <flight prefix>_rdn_refl_corrected_brdf_coeffs.json
- Topographic corrections coefficients: <flight prefix>_rdn_refl_corrected_brdf_coeffs.json
Some JSONs may include a versioning component in the file name after <flight prefix> to indicate the radiance software version.
Example file names for a single flightline:
- f130410t01p00r09_refl_corrected_15m.bin
- f130410t01p00r09_refl_corrected_15m.hdr
- f130410t01p00r09_refl_corrected_GCP.json
- f130410t01p00r09rdn_refl_corrected_brdf_coeffs.json
- f130410t01p00r09rdn_refl_corrected_topo_coeffs.json
Table 1. Flight boxes for WDTS acquisitions (see Figure 1).
| Flight Box | First date | Last date | Number of Flightlines | Number of Acquisitions |
|---|---|---|---|---|
| bayarea | 2013-04-10 | 2018-08-16 | 143 | 15 |
| santabarbara | 2013-04-11 | 2018-06-28 | 104 | 11 |
| socal | 2013-04-12 | 2018-06-25 | 107 | 15 |
| sodastraw | 2013-05-02 | 2018-06-21 | 12 | 12 |
| tahoe | 2013-05-02 | 2018-06-21 | 144 | 15 |
| yosemite | 2013-05-03 | 2018-06-22 | 171 | 16 |
Application and Derivation
The Western Diversity Time Series reflectance product is one of the largest analysis-ready airborne imaging spectroscopy datasets ever produced. Because illumination corrections are focused on vegetated pixels, this dataset is particularly well-suited for applications in terrestrial ecology and may be useful for studies in geology, limnology, marine science, public health, and other related fields.
The corrections applied to this dataset render raw pixel spectra unsuitable for most physics-based retrievals of surface properties, but have the benefit of being more comparable between flightlines and under different illumination conditions than the standard L2 imagery (e.g., Green et al., 2023b). Georectification with AROSICS also makes pixels comparable across years and flightlines, making time series analysis a suitable application of this dataset.
Quality Assessment
Radiometric calibration is performed prior to data acquisition, as outlined in Green, et al. (2023a). Quality assessment on corrections were carried out by running regressions on overlapping pixels between flight lines for single bands in the Visible, NIR, SWIR 1, and SWIR 2 spectral regions, for a random sample of approximately 10% of the flightlines in this dataset (Table 2).
are given below:
Table 2. The R2 and slope values of regressions for raw, georectified, and topo/BRDF/glint corrected pixels on overlapping flight lines. Regression statistics for four bands 462 to 2387 nm are listed.
| Visible (462 nm) | NIR (850 nm) | SWIR 1 (1532 nm) | SWIR 2 (2387 nm) | |
|---|---|---|---|---|
| Average R2 of regressions | ||||
| Raw | 0.46 | 0.47 | 0.58 | 0.56 |
| Georectification | 0.56 | 0.59 | 0.67 | 0.65 |
| topo/BRDF/glint | 0.45 | 0.57 | 0.62 | 0.63 |
| Slope values from regressions | ||||
| Raw | 0.65 | 0.67 | 0.76 | 0.74 |
| Georectification | 0.72 | 0.73 | 0.79 | 0.79 |
| topo/BRDF/glint | 0.63 | 0.71 | 0.75 | 0.79 |
In addition, qualitative assessments were conducted on the spectral signatures of specific points, before and after AROSICS georectification. The figures below show how the spectral signatures in a given spatial location change over time with and without AROSICS georectification.
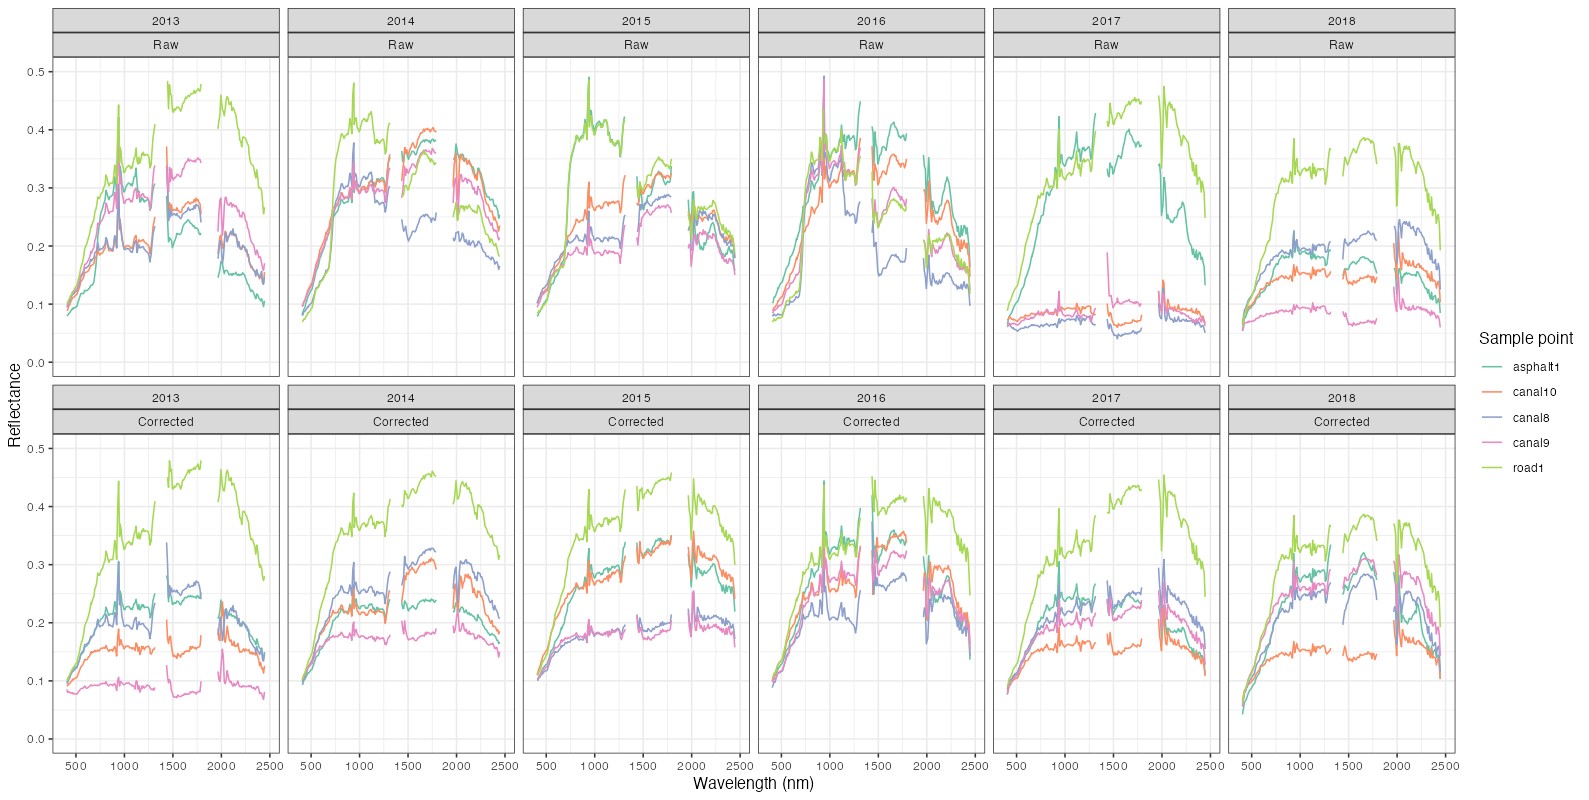
Figure 2. Extracted spectra for selected points before (raw) and after (corrected) AROSICS georectification for an area in the Yosemite box, across June acquisitions from 2013-2018. To analyze WDTS imagery as a time series it is important that pixels are reflecting a stationary location on the ground throughout time (e.g., Figure 3). Spatial shifting due to georectification error is apparent in the raw imagery, as reflected by the differing spectral signatures for a single point over time. Georectification with AROSICS drastically reduces this source of error, rendering spectral signatures for specific locations in space comparable over time.
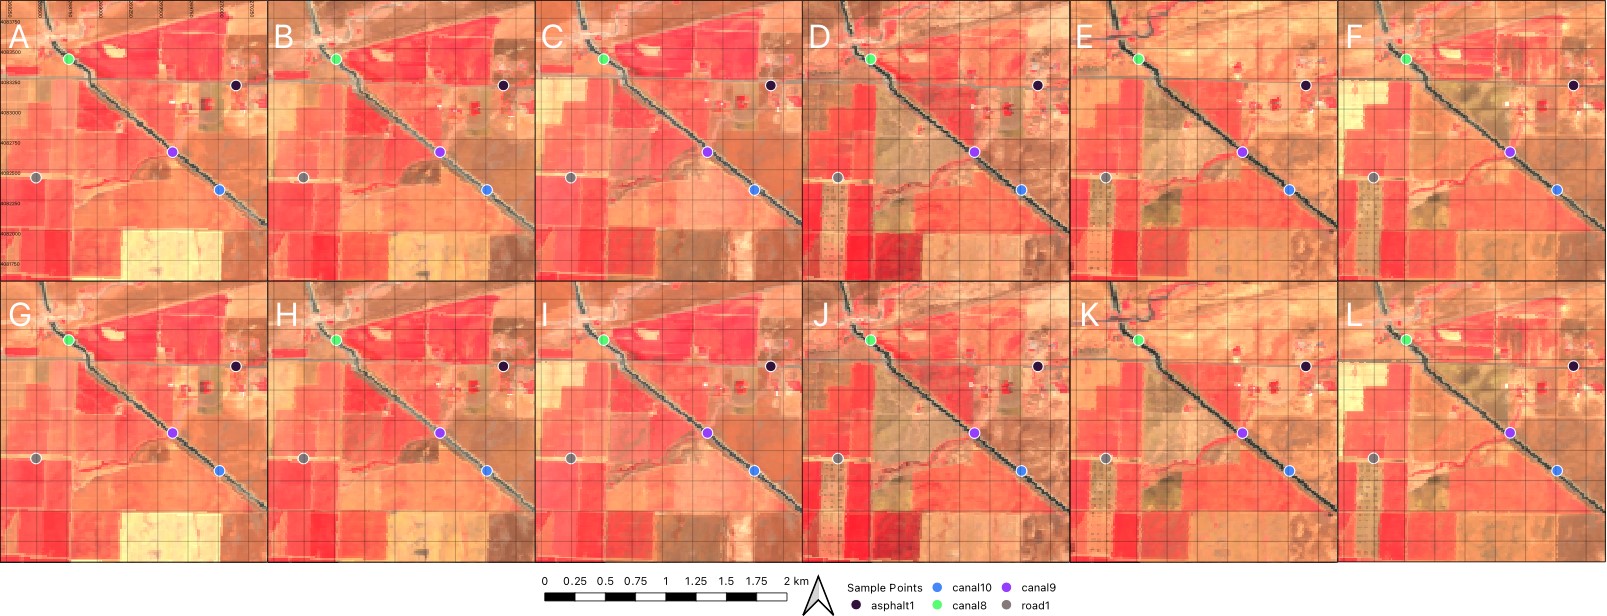
Figure 3. Color-infrared images of an agricultural area between 2013 and 2018 before AROSICS (A-F), and after AROSICS (G-L) for a fixed spatial bounding box. Points and imagery correspond to spectra extracted for Figure 2. UTM Zone 11N easting and northing coordinates are given in box A. Grid lines are drawn every 250 meters.
Data Acquisition, Materials, and Methods
Background
The NASA Western Diversity Time Series (WDTS) emerged from and includes the 2013-2014 NASA HyspIRI Preparatory Campaign in California, a NASA effort to demonstrate the science that would underlay a global imaging spectroscopy mission (Lee et al., 2015). The original WDTS was designed to capture the diversity of California's ecosystems across five large flight boxes that were imaged a minimum of three times per year to represent key phenological time points (Figure 1). The WDTS was extended beyond 2014 to maintain a long-term time-series for prototyping temporal analyses of imaging spectroscopy data. AVIRIS-Classic imagery was collected on the NASA ER-2 from ~65,000 ft, yielding imagery with 15-20 m ground sample distance (Green et al, 1998). AVIRIS-Classic is a 224-channel “whisk-broom” instrument with four grating imaging spectrometers covering a spectral range from 400-2500 nm, with spectral sampling every 10 nm. Radiometric calibration accuracy is within 1 nm, and signal to noise ratio is greater than 100:1 (Green et al., 1998). The 2013-2014 collections were paired with concurrent MODIS/ASTER Airborne Simulator (MASTER) 50-band visible to thermal infrared collections. WDTS acquisitions were sustained after 2015 with annual collections in most years in May, June or July. Following the 2018 Decadal Survey and the rebranding of HyspIRI to Surface Biology and Geology (SBG), AVIRIS-Classic and other imaging spectroscopy data have continued to be acquired periodically over the WDTS flight boxes to maintain a long-term time series that should enable quantification of changes in vegetation function and functional diversity from imaging spectroscopy data.
Generating corrected surface reflectance
This dataset was generated directly from L2B AVIRIS-Classic Calibrated reflectance (Green et al., 2023b). This WDTS reflectance product is suitable for analyses using statistical techniques to relate surface reflectance to physical, chemical, ecological, and biological properties of the surface across single or multiple flightlines. Users interested in physics-based retrievals of specific surface or atmospheric properties should revert to the aforementioned dataset, which does not have topographic, BRDF, or glint corrections applied.
AVIRIS-Classic reflectance L2 data were originally atmospherically corrected using ATmospheric REMoval software (ATREM) (Thompson et al., 2015). This physically-based method for solving the radiative transfer equation has an option to compute and apply correction factors to each wavelength that adjust for inaccuracies in calibration, atmospheric gas absorption, and solar irradiance in a scene (Thompson et al., 2015). However, these correction factors were not computed or applied universally to the data of record (Green et al., 2023a, 2023b), causing inconsistencies from year to year that are undesirable for time series analysis. In cases where correction factors were applied, the original atmospherically-corrected reflectance were reverted by dividing out the factors. The resulting “unsmoothed” data is used for all subsequent processing.
Ground control points (GCPs) were computed using AROSICS local coregistration, to align flight lines to median composites of the temporally-nearest cloud-free Landsat panchromatic imagery (Scheffler et al., 2017). The resulting GCPs were applied to unsmoothed reflectance data and the ancillary data bands that are derived from on-board instrumentation. Finally, topographic, BRDF, and glint corrections were computed and applied to the resulting georectified images and resampled all imagery to 15 m spatial resolution (Gao and Li, 2021; Queally et al., 2022; Soenen et al., 2005) (Figure 4).
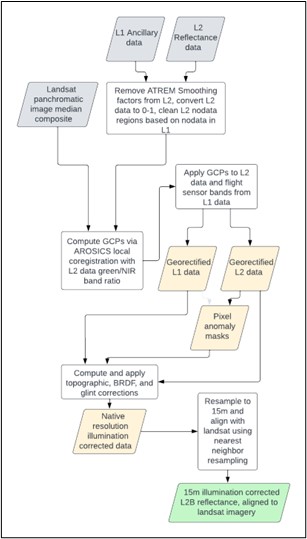
Figure 4. Processing workflow to derive WDTS reflectance. Gray boxes indicate starting products, white boxes indicate processing steps, beige boxes indicate intermediate products. This product is highlighted in green at the end of the workflow.
User Notes:
Topographic, BRDF, and glint corrections were applied only to specific pixels based on thresholds of suitability. For example, topographic corrections were only applied to pixels with a slope angle of greater than 5 degrees, cosine of the illumination angle greater than 0.12, and a normalized difference vegetation index (NDVI) of greater than 0.1. FlexBRDF corrections were applied to pixels with an NDVI greater than 0.1, and a sensor zenith angle greater than 2 degrees. Lastly, glint corrections were applied to pixels with NDVI of less than 0.1 and normalized difference water index (NDWI) of greater than 0.1. Users should be aware that water pixels with exceptionally high glint, especially in the ocean, sometimes will not have glint corrections because they do not meet these thresholds. Additionally, because the FlexBRDF algorithm is designed for terrestrial vegetation, BRDF corrections were not applied over non-vegetated surfaces.
Products with “_v2” in the file name are derived from L2 data that was processed specifically for the purposes of plant functional trait mapping, separate from the L2 data of record (i.e., Green et al., 2023b). Atmospheric correction and radiance calibration parameters used for these L2 data are slightly different from the L2 data of record. Reflectance from these _v2 versions are generally more radiometrically stable over time than the Green et al. (2023b) version; however, both corrected products are included in this dataset. These _v2 versions of L2 data only exist for the Yosemite box for June of 2013 and 2015.
Data Access
These data are available through the Oak Ridge National Laboratory (ORNL) Distributed Active Archive Center (DAAC).
WDTS: AVIRIS-Classic L2B Corrected and Georectified Surface Reflectance, 2013-2018
Contact for Data Center Access Information:
- E-mail: uso@daac.ornl.gov
- Telephone: +1 (865) 241-3952
References
Gao, B.-C. and R.-R. Li. 2021. Correction of Sunglint Effects in High Spatial Resolution Hyperspectral Imagery Using SWIR or NIR Bands and Taking Account of Spectral Variation of Refractive Index of Water. Advances in Environmental and Engineering Research 02:1–1. https://doi.org/10.21926/aeer.2103017
Green, R. O., M. L. Eastwood, C. M. Sarture, T. G. Chrien, M. Aronsson, B. J. Chippendale, J. A. Faust, B. E. Pavri, C. J. Chovit, M. Solis, M. R. Olah, and O. Williams. 1998. Imaging Spectroscopy and the Airborne Visible/Infrared Imaging Spectrometer (AVIRIS). Remote Sensing of Environment 65:227–248. https://doi.org/10.1016/S0034-4257(98)00064-9
Green, R.O., D.R. Thompson, J.W. Boardman, J.W. Chapman, M. Eastwood, M. Helmlinger, S.R. Lundeen, and W. Olson-Duvall. 2023a. AVIRIS-Classic: L1B Calibrated Radiance, Facility Instrument Collection. ORNL DAAC, Oak Ridge, Tennessee, USA. https://doi.org/10.3334/ORNLDAAC/2155
Green, R.O., D.R. Thompson, J.W. Boardman, J.W. Chapman, M. Eastwood, M. Helmlinger, S.R. Lundeen, and W. Olson-Duvall. 2023b. AVIRIS-Classic: L2 Calibrated Reflectance, Facility Instrument Collection. ORNL DAAC, Oak Ridge, Tennessee, USA. https://doi.org/10.3334/ORNLDAAC/2154
Hook, S.J., J.S. Myers, K.J. Thome, M. Fitzgerald, A.B. Kahle, Airborne Sensor Facility NASA Ames Research Center, and R.O. Green. 2024. MASTER: Western Diversity Time Series Campaign, WDTS, Spring 2024. ORNL DAAC, Oak Ridge, Tennessee, USA. https://doi.org/10.3334/ORNLDAAC/2383
Lee, C. M., M. L. Cable, S. J. Hook, R. O. Green, S. L. Ustin, D. J. Mandl, and E. M. Middleton. 2015. An introduction to the NASA Hyperspectral InfraRed Imager (HyspIRI) mission and preparatory activities. Remote Sensing of Environment 167:6–19. https://doi.org/10.1016/j.rse.2015.06.012
Queally, N., Z. Ye, T. Zheng, A. Chlus, F. Schneider, R. P. Pavlick, and P. A. Townsend. 2022. FlexBRDF: A Flexible BRDF Correction for Grouped Processing of Airborne Imaging Spectroscopy Flightlines. Journal of Geophysical Research: Biogeosciences 127:e2021JG006622. https://doi.org/10.1029/2021JG006622
Scheffler, D., A. Hollstein, H. Diedrich, K. Segl, and P. Hostert. 2017. AROSICS: An Automated and Robust Open-Source Image Co-Registration Software for Multi-Sensor Satellite Data. Remote Sensing 9:676. https://doi.org/10.3390/rs9070676
Soenen, S.A., D.R. Peddle, and C.A. Coburn. 2005. SCS+C: a modified Sun-canopy-sensor topographic correction in forested terrain. IEEE Transactions on Geoscience and Remote Sensing 43:2148–2159. https://doi.org/10.1109/TGRS.2005.852480
Thompson, D. R., B.-C. Gao, R. O. Green, D. A. Roberts, P. E. Dennison, and S. R. Lundeen. 2015. Atmospheric correction for global mapping spectroscopy: ATREM advances for the HyspIRI preparatory campaign. Remote Sensing of Environment 167:64–77. https://doi.org/10.1016/j.rse.2015.02.010