Documentation Revision Date: 2020-05-07
Dataset Version: 1
Summary
The 1982-2013 time series data included annual wet season cumulative NDVI as a proxy for net primary productivity (NPP), and annual wet season cumulative rainfall as the main driver of productivity. The resulting gridded data, with a 0.05-degree spatial resolution and pixel specific information on concurrent woody and herbaceous vegetation trends across this savanna region, are referred to as the West African Vegetation Trends (WAVeTrends) product (Anchang et al. 2019).
The dataset is the first to provide spatially explicit regional scale information on how each category has evolved separately over the past few decades, whether in response to changing climate conditions or from sustained human activities. It is expected to help address lingering questions about the land degradation/desertification process, long-term climate change, and food security in the region.
This dataset includes seven files in GeoTIFF (*.tif) format. The data are available as a single file with six bands and as six separate files, one for each band. A companion file is included that provides detailed Python code which can be used to re-generate vegetation change categories based on user defined significance levels (p-values).
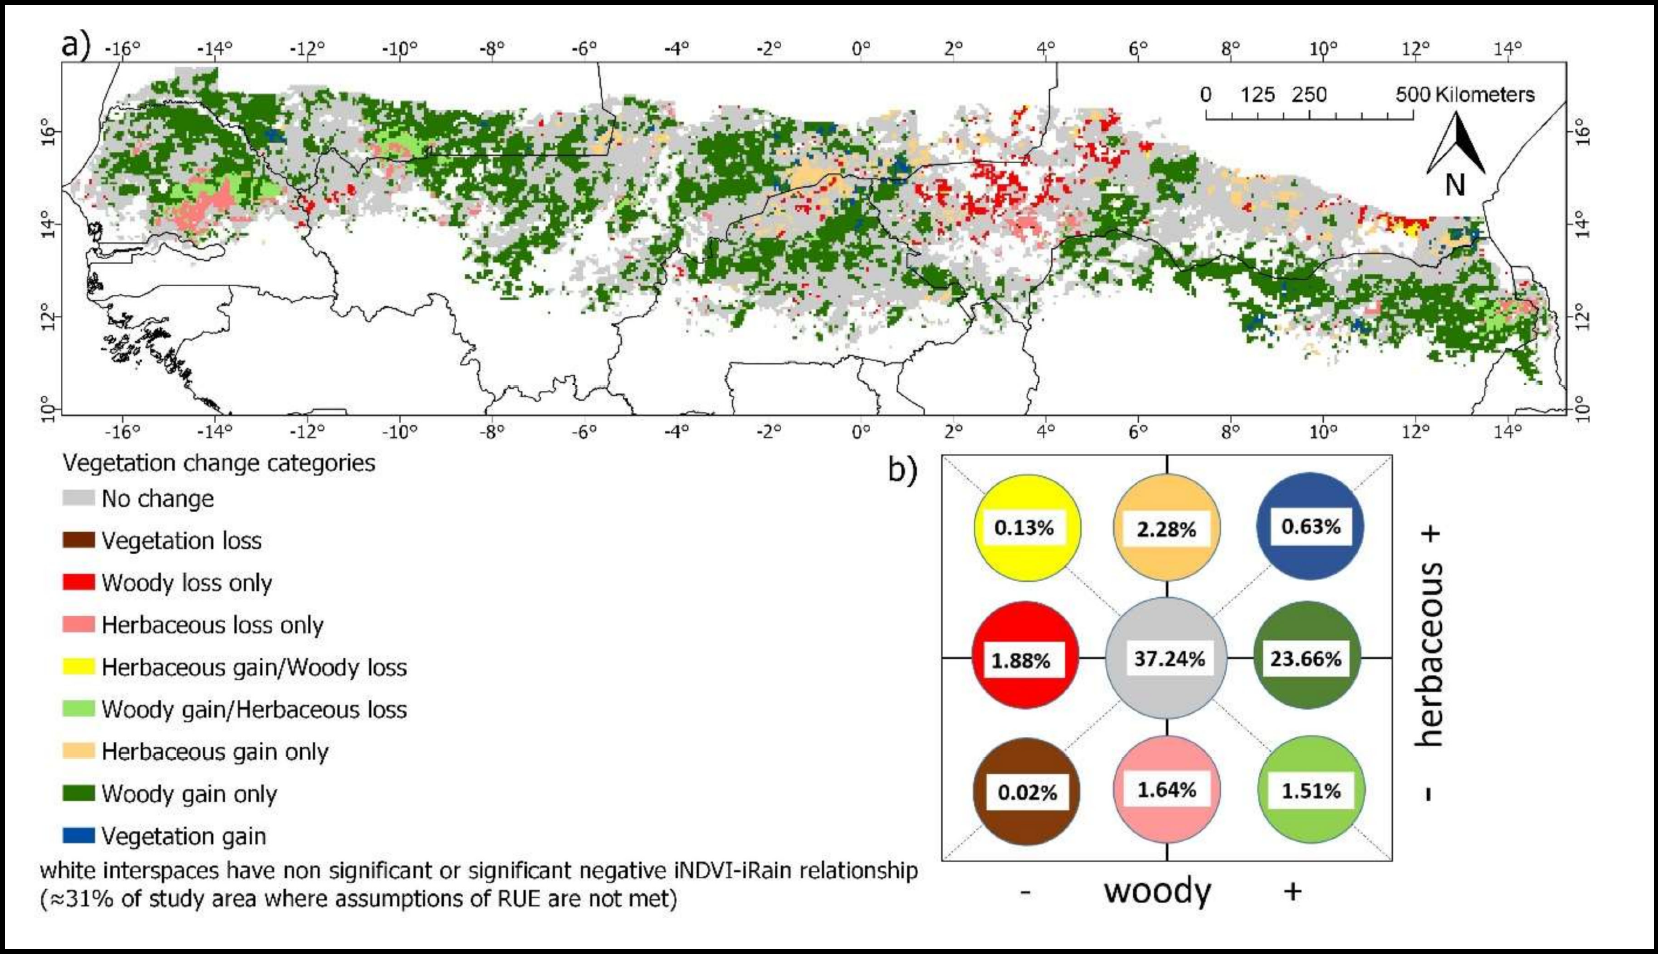
Figure 1. Concurrent woody and herbaceous vegetation changes between the 1982-1991 and 2004-2013 decades of the Sudano-Sahel region of Africa. (A) Map of vegetation change categories. (B) Chart showing the conceptual position and the relative abundance of each category in a 2-D space (Anchang et al. 2019).
Citation
Anchang, J.Y., L. Prihodko, A.T. Kaptue, C.W. Ross, W. Ji, S.S. Kumar, B. Lind, M.A. Sarr, A.A. Diouf, and N.P. Hanan. 2020. Woody and Herbaceous Vegetation Change across the Savannas of West Africa, 1982-2013. ORNL DAAC, Oak Ridge, Tennessee, USA. https://doi.org/10.3334/ORNLDAAC/1738
Table of Contents
- Dataset Overview
- Data Characteristics
- Application and Derivation
- Quality Assessment
- Data Acquisition, Materials, and Methods
- Data Access
- References
Dataset Overview
The WAVeTrends dataset is a 0.05 degree (5.55km) vegetation change product, spanning the West African Sudano-Sahel region. It provides pixel-wise information on concurrent woody and herbaceous vegetation trends over a 32-year period (1982-2013). Wood and herbaceous vegetation change was separated using methods based on the concept of rain use efficiency (RUE), that specifically examined how differently productivity in each vegetation category responded to long-term rainfall variability. Change in mean decadal RUE (long-term sensitivity) was used to detect the slower change in woody canopy cover; while change in the slope of the productivity-rainfall relationship (short-term sensitivity) was used to detect change in the more responsive grasses and forbs. In both cases, adjustments were made using a log function for pixels showing a preference for a non-linear productivity-rainfall long-term dynamic.
This dataset is a result of international scientific cooperation under the SERVIR Global Initiative, between NASA funded researchers at New Mexico State University (NMSU) and USAID funded regional partners in West Africa. In this region, woody and herbaceous vegetation contribute immense ecological and socioeconomic value to millions of agro-pastoralists.
Related Publication:
Anchang, J.Y., Prihodko, L., Kaptue, A.T., Ross, C.W., Ji, W., Kumar, S.S., Lind, B., Sarr, M.A., Diouf, A.A. and Hanan, N.P. 2019. Trends in Woody and Herbaceous Vegetation in the Savannas of West Africa. Remote Sensing, 11(5):576.
https://doi.org/10.3390/rs11050576
Kaptué, A.T., Prihodko, L. and Hanan, N.P., 2015. On regreening and degradation in Sahelian watersheds. Proceedings of the national academy of sciences, 112(39), pp.12133-12138. https://doi.org/10.1073/pnas.1509645112
Acknowledgments:
This work was supported by the NASA SERVIR Applied Science Team (NNX16AN30G) and NASA Terrestrial Ecology Program (NNX13AK50G).
Data Characteristics
Spatial Coverage: West African Sudano-Sahel Savanna Region
Spatial Resolution: 0.05 decimal degrees (5.55 km2)
Temporal Coverage: 1982-01-01 to 2013-12-31
Temporal Resolution: Decadal
Study Area: Latitude and longitude are given in decimal degrees.
| Region | Westernmost Longitude | Easternmost Longitude | Northernmost Latitude | Southernmost Latitude |
|---|---|---|---|---|
| West Africa | -17.14319 | 15.30681 | 17.41476 | 9.96476 |
Data File Information
This dataset includes seven files in GeoTIFF (*.tif) format. The data are available as a single file with six bands and as six separate files, one for each band.
A companion file is included that provides detailed Python code which can be used to re-generate vegetation change categories, as in vegetation_change.tif, based on user-defined significance levels (p-values).
Table 1. File names and descriptions.
| File Name | Values | Description |
|---|---|---|
| WAVeTrends.tif | 6-band file with bands as described here | |
| vegetation_change.tif (band_1) | 1 to 9 | Categories of vegetation change derived by p<0.05 for woody_pvalue.tif and herbaceous_pvalue.tif; see Table 3 for details |
| woody_trend.tif (band_2) | -0.13 to +0.12 | Change in long-term RUE sensitivity (i.e., the difference in mean RUE between first and last decade); negative values indicate a decrease in woody cover |
| herbaceous_trend.tif (band_3) | -2.03 to +2.45 | Change in short-term RUE sensitivity (i.e., the difference in the slope of the NPP-rainfall model between first and last decade); negative values indicate a decrease in herbaceous cover |
| woody_pvalue.tif (band_4) | 0.0 to 1.0 | p-values associated with woody_trend.tif |
| herbaceous_pvalue.tif (band_5) | 0.0 to 1.0 | p-values associated with herbaceous_trend.tif |
| validity_flag.tif (band_6) | 1 to 3 | Categories describing the long-term iNDVI-iRain relationship at each pixel location; see Table 4 for details |
Data File Details
Each file has 149 rows and 649 columns and uses the projection EPSG:4326.
Table 2. File details.
| File Name | Data Type | Missing Data Value |
|---|---|---|
| WAVeTrends.tif | Float32 | -3.40282346638528E+38 |
| vegetation_change.tif (band_1) | Byte | 255 |
| woody_trend.tif (band_2) | Float32 | -3400 |
| herbaceous_trend.tif (band_3) | Float32 | -3400 |
| woody_pvalue.tif (band_4) | Float32 | -3400 |
| herbaceous_pvalue.tif (band_5) | Float32 | -3400 |
| validity_flag.tif (band_6) | Byte | 255 |
Table 3. Values and descriptions for vegetation_change.tif.
| Value | Description |
|---|---|
| 1 | No Change |
| 2 | Vegetation Loss |
| 3 | Woody Loss Only |
| 4 | Herbaceous Loss only |
| 5 | Wood Loss/Herb Gain |
| 6 | Woody Gain/Herbaceous Loss |
| 7 | Herbaceous Gain Only |
| 8 | Woody Gain Only |
| 9 | Vegetation Gain |
Table 4. Values and descriptions for validity_flag.tif.
| Value | Description |
|---|---|
| 1 | Non-Valid — no significant positive relationship between NPP and rainfall; use of RUE not suitable |
| 2 | Valid — significant positive linear relationship; rainfall main driver of NPP and use of RUE is valid |
| 3 | Valid — significant positive log-linear relationship; rainfall is limiting but slightly saturating; log function applied |
Application and Derivation
The dataset provide spatially explicit regional scale information on how woody and herbaceous vegetation has evolved separately over the past few decades in the Sudano-Sahel region, whether in response to changing climate conditions or from sustained human activities. It is expected to help address lingering questions about the land degradation/desertification process, long-term climate change, and food security in the region.
Quality Assessment
The use of RUE for vegetation trend analysis in savanna regions is predicated on the assumption that rainfall is a significant positive driver of NPP in drylands. validity_flag.tif (band_6 of WAVeTrends.tif) serves as a validity flag based on the examination of long-term iNDVI-iRain relationship at each pixel location.
- A pixel value of 1 indicates a negative or non-significant relationship (i.e., rainfall is not a limiting factor; hence, trends assessed using RUE not valid).
- A pixel value of 2 indicates a significant positive linear relationship (i.e., rainfall is highly limiting; hence, use of RUE is valid).
- A pixel value of 3 indicates a significant positive log-linear relationship (i.e., rainfall is still strongly limiting but with slight saturating effect which is taken into account applying log function).
The vegetation trends provided in woody_trend.tif (band_2 of WAVeTrends.tif) and herbaceous_trend.tif (band_3 of WAVeTrends.tif) were assessed on a per-pixel basis using independent t-tests and ANCOVA, respectively. In both cases, a threshold of p<0.05 was initially used to determine statistically significant change. The classified vegetation trends provided in vegetation_change.tif (band_1 of WAVeTrends.tif) were determined using a significance threshold of 0.05. The raw p-values are included in woody_pvalue.tif (band_4 of WAVeTrends.tif) and herbaceous_pvalue.tif (band_5 of WAVeTrends.tif), respectively, so users can classify vegetation trends at other levels of confidence.
Data Acquisition, Materials, and Methods
Study Area
The study area consisted of the Sahelian and Sudanian savanna ecoregions of West Africa, bounded to the north by the Sahara Desert (MAP < 150 mm) and to the south by the Guinea savanna-forest mosaic (MAP > 900 mm), and extending from the Atlantic coasts of Senegal and Gambia on the west to the eastern borders of Niger and Nigeria on the east (Figure 2).
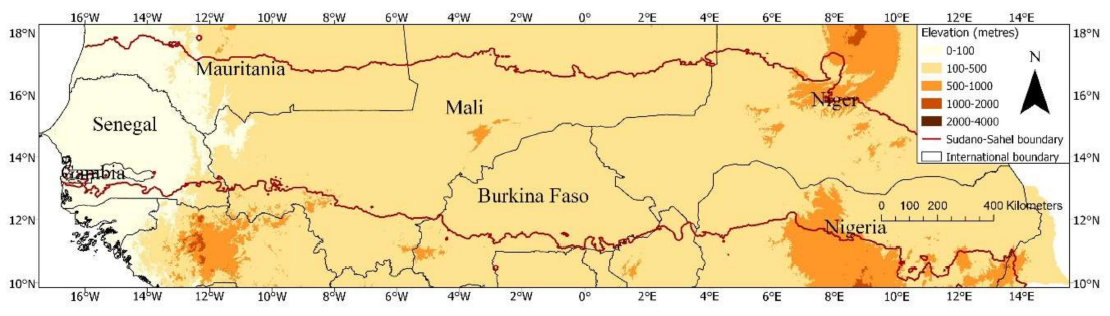
Figure 2. Map of the West African Sudano-Sahelian savanna region (Anchang et al., 2019).
Productivity and Climate Data
Long-term vegetation data were obtained from the Global Inventory Monitoring and Modeling System (GIMMS, 3rd generation) NDVI data archive, and long-term climate data were obtained from the Climate Hazards Group Infrared Precipitation with Station (CHIRPS) data archive. Both were retrieved using Google Earth Engine.
The analysis that produced this dataset used 32 years (1982-2013) of wet season cumulative NDVI (iNDVI) as a proxy for net primary productivity (NPP) and wet season cumulative rainfall (iRain) as the primary driver of productivity.
Change Detection Using RUE
Change in woody vegetation cover/density was diagnosed using per-pixel independent samples t-test, as the difference in mean Rain Use Efficiency (RUE) between the first and last decades of the time series (RUE = iNDVI/iRain for a given year) and referred to as Change in Long-term RUE Sensitivity (δSL).
Change in herbaceous vegetation cover/density was diagnosed by comparing the slope of the iNDVI - iRain relationship between both decades using per-pixel Analysis of Covariance (ANCOVA) and referred to as Change in Short-term RUE Sensitivity (δSS). iRain was replaced with log[iRain] in the aforementioned framework to produce a saturating (log-linear) regression model that better captured the long-term NPP-rainfall relationship. Categorical vegetation change was then determined for each pixel using the sign (+/-) of the δSL and δSS values and a significance level of p<0.05.
See Anchang et al. (2019) for details.
A companion file is included that provides detailed Python code which can be used to re-generate vegetation change categories, as in vegetation_change.tif, based on user-defined significance levels (p-values).
Data Access
These data are available through the Oak Ridge National Laboratory (ORNL) Distributed Active Archive Center (DAAC).
Woody and Herbaceous Vegetation Change across the Savannas of West Africa, 1982-2013
Contact for Data Center Access Information:
- E-mail: uso@daac.ornl.gov
- Telephone: +1 (865) 241-3952
References
Anchang, J.Y., Prihodko, L., Kaptue, A.T., Ross, C.W., Ji, W., Kumar, S.S., Lind, B., Sarr, M.A., Diouf, A.A. and Hanan, N.P. 2019. Trends in Woody and Herbaceous Vegetation in the Savannas of West Africa. Remote Sensing, 11(5):576.
https://doi.org/10.3390/rs11050576