Documentation Revision Date: 2023-10-20
Dataset Version: 1
Summary
This dataset contains 34,721 GeoPackage files, 34,721 Shapefiles contained inside compressed (*.zip) files, three Cloud-Optimized GeoTIFF (COG) files, and three files in comma-separated values (.CSV) format.
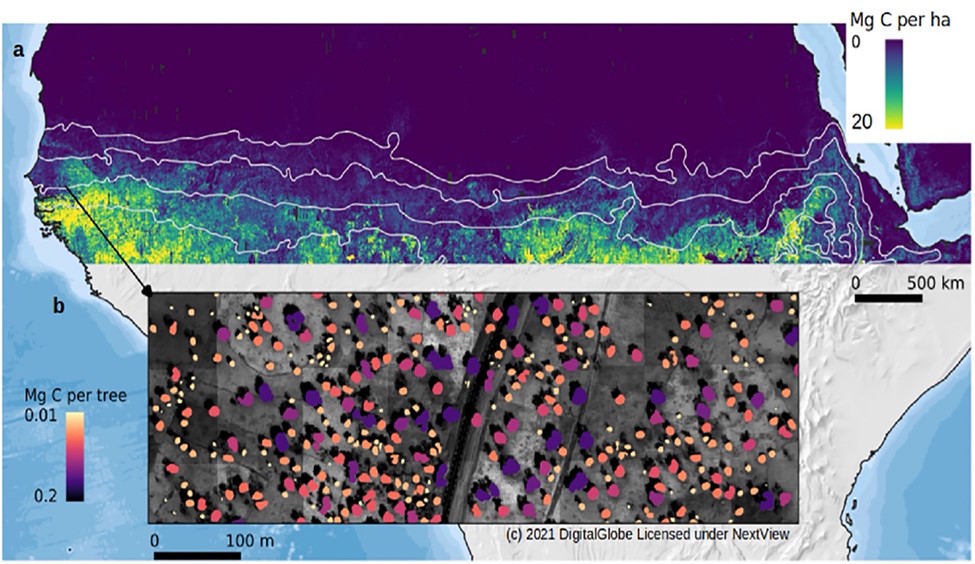
Figure 1. Wood, foliage and root carbon of 9,947,310,221 trees (> 3 m^2 in crown area) across 9,685,324 km^2 were mapped. a, The study area covered the southern Sahara, the Sahel, and the northern Sudanian zone of Africa and shows the aggregated tree carbon density and carbon (foliage + wood + root) per hectare. The isohyets mark the 150, 300, 600, and 1000 mm/year rainfall zones (from north to south). b, An example of the carbon stock of each tree for an agroforestry area in Senegal. Figure from Tucker et al. (2023).
Citation
Tucker, C.J., M. Brandt, P. Hiernaux, A. Kariryaa, J.L. Small, and J. Meyers. 2022. Carbon Stocks of Individual Trees in African Drylands: Allometry and Output Data. ORNL DAAC, Oak Ridge, Tennessee, USA. https://doi.org/10.3334/ORNLDAAC/2117
Table of Contents
- Dataset Overview
- Data Characteristics
- Application and Derivation
- Quality Assessment
- Data Acquisition, Materials, and Methods
- Data Access
- References
Dataset Overview
This dataset provides allometrically-estimated carbon stocks of 9,947,310,221 tree crowns derived from 50-cm resolution satellite images within the 0 to 1000 mm/year precipitation zone of Africa north of the equator and south of the Sahara Desert. These data are presented in GeoPackage (*.gpkg) format and are summarized in Cloud-Optimized GeoTIFF (COG) format. An interactive viewer application developed to display these carbon estimates at the individual tree level across the study area is available at: https://trees.pgc.umn.edu/app. The analysis utilized 326,523 Maxar multispectral satellite images collected between 2002 to 2021 for the early dry season months of November to March to identify tree crowns. Metadata from satellite image processing across the study area are presented in Shapefile (*.shp) format. Additionally, field measurements from destructive harvests used to derive allometry equations are contained in comma-separated (*.csv) files. These data demonstrate a new tool for studying discrete semi-arid carbon stocks at the tree level with immediate applications provided by the viewer application. Uncertainty of carbon estimates are ±19.8%.
Related Publication
Tucker, C. J., M. Brandt, P. Hiernaux, A. Kariryaa, K. Rasmussen, J. Small, C. Abel, et al. 2023. Sub-continental scale carbon stocks of individual trees in African drylands. Nature , 615(7950), 80-86. https://doi.org/10.1038/s41586-022-05653-6
Acknowledgments
This work was supported by Advancing Collaborative Connections for Earth System Science (grant 880292.04.02.01.01). AK, RF and CI were supported by the research grant DeReEco (grant number 34306) by Villum Fonden.
Data Characteristics
Spatial Coverage: Sahara, Sahel, and sub-humid zone of Africa from the Atlantic Ocean to the Red Sea.
Spatial Resolution: Variable polygon sizes
Temporal Coverage: 2002-11-01 to 2020-03-31
Temporal Resolution: One-time estimate
Study Area: Latitude and longitude are given in decimal degrees.
| Site | Westernmost Longitude | Easternmost Longitude | Northernmost Latitude | Southernmost Latitude |
|---|---|---|---|---|
| Sahel, Sahara, and sub-humid zone of Africa | -18.0 | 42.22 | 24.03 | 9.5 |
Data File Information
This dataset contains 34,721 GeoPackage files, 34,721 Shapefiles contained inside compressed (*.zip) files, three GeoTIFF files, and three files in comma-separated values (.CSV) format. GeoPackage files contain polygons of individual tree crowns with carbon stock data. Shapefiles contain metadata of satellite imagery used to derive the tree crowns. These files are in the Universal Transverse Mercator (UTM) projection system for UTM Zone segments 28–37 as shown in Figure 2. Individual files are approximately 16,384 x 16,384 m tiles. The feature coordinates are in UTM projected space, and are relative to the feature centroid. For latitude and longitude they must be first reprojected.
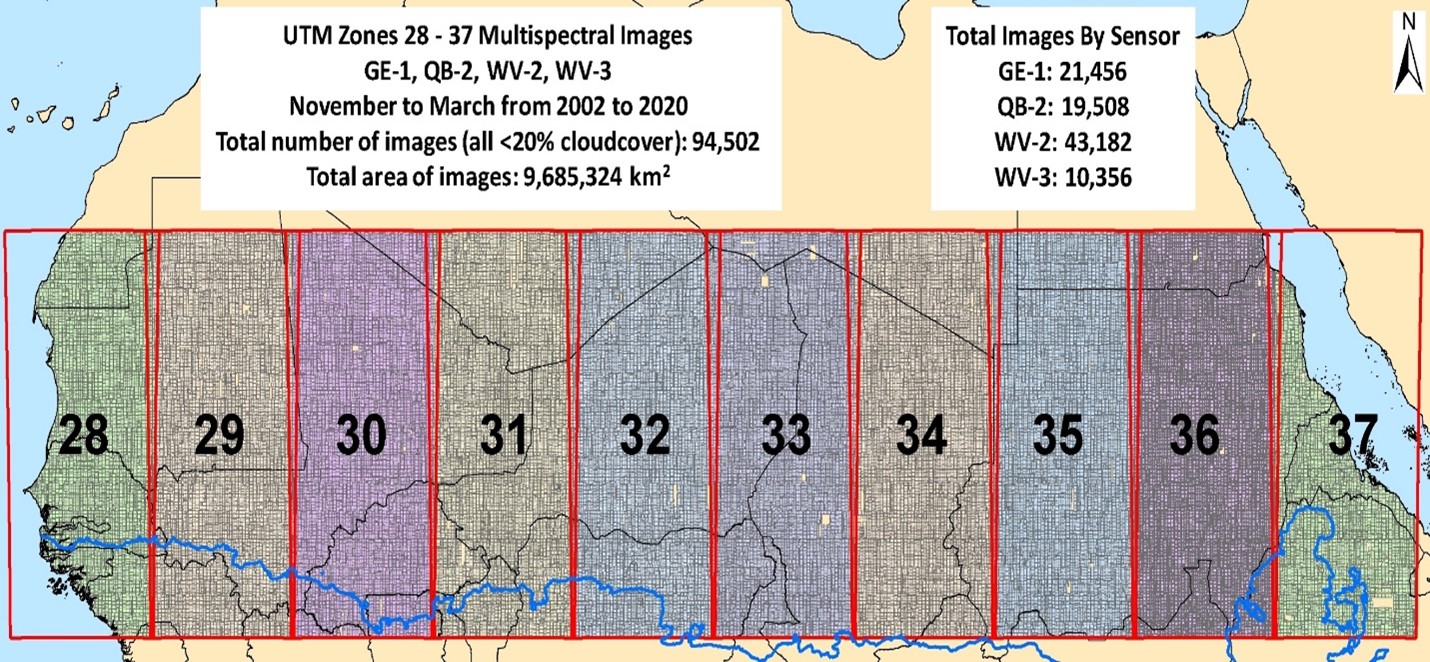
Figure 2. The study area covered ten UTM Zones from 9.5o to 24o North latitude across Africa. 94,502 Maxar satellite images were selected in a hierarchical fashion for processing from four satellites (QuickBird-2, GeoEye-1, WorldView-2 and WorldView-3), using the panchromatic and pan-sharpened NDVI bands at 50 cm spatial resolution. The area of our study was 9,685,324 km2 and covered the 0 to 1000 mm/year rainfall zone (Funk et al., 2015), which is denoted by the blue line.
GeoTiff files summarize variables at 100-m resolution across the study area. They use EPSG code 4326 (WGS 84) and have 100-m (~0.00091 degree) resolution. They have five data bands that record variable information by tree crown area size: band 1: 3-15 m2; band 2: 15-50 m2; band 3: 50-200 m2; band 4: >200 m2 ; and band 5: All area classes combined. These are our hectare-scale information. Regions outside the study area or where standing water is present have been masked to the no data value.
CSV files contain allometry data from Hiernaux et al. (2023) used to derive allometry equations. The data viewer application is available via internet browser (Google Chrome, Apple Safari 9 and above, Microsoft Edge 13 with the Win10 update, and the latest Firefox) at: https://trees.pgc.umn.edu/app.
No Data Value: -9999
File Naming Convention
GeoPackage and Shapefiles are named SSAr2_zone_GE01-QB02-WV02-WV03_PV_row_column_mosaic.gpkg and SSAr2_zone_GE01-QB02-WV02-WV03_PV_row_column_mosaic_cutlines.zip, respectively, where:
- zone = The EPSG identifier, e.g.32628. The last two digits indicate the UTM zone
- row = 001 through 041; up to forty one rows
- column = 001 through 099; up to ninety nine columns
GeoTIFF files are named wgs_84_mosaic_100m_tree_variable_density.tif, where variable is area, carbon, or count.
Allometry CSV files are named Allometry_Hiernaux-type.csv, where type is foliage, roots, or wood
Table 1. Data dictionary for SSAr2_zone_GE01-QB02-WV02-WV03_PV_row_column_mosaic.gpkg files
| Variable | Units | Description |
|---|---|---|
| Area | m^2 | Area of tree crown |
| Leaf_Mass | kg | Leaf mass |
| Wood_Mass | kg | Wood mass |
| Root_Mass | kg | Root mass |
Table 2. Data dictionary for SSAr2_zone_GE01-QB02-WV02-WV03_PV_row_column_mosaic_cutlines.zip files
| Variable | Units | Description |
|---|---|---|
| IMAGENAME | Input image filename | |
| SENSOR | Image source sensor (GE01 = GeoEye, QB02 = QuickBird, WV02 = WorldView2, WV03=WorldView3) | |
| ACQDATE | yyyy-mm-ddThh:mm:ss.ssssssZ | Image acquisition date |
| CAT_ID | Source image DigitalGlobe catalog ID | |
| RESOLUTION | m | Resolution of satellite image |
| OFF_NADIR | Decimal degrees | Sensor off nadir angle |
| SUN_ELEV | Decimal degrees | Solar elevation angle |
| SUN_AZ | Decimal degrees | Solar azimuth angle |
| CLOUDCOVER | Source image fractional cloud cover (flag value -999) | |
| TDI | Level of the time-delayed integration, as commanded to the spacecraft | |
| DATE_DIFF | Difference in days between image date and target date (flagged with -9999 for this dataset because no target date was imposed) | |
| SCORE | Image score. Images are selected in order of descending score. | |
| SCAN_DIR | Image scan direction (forward, reverse) | |
| RF_MULT | Multiplier to convert panchromatic image values to reflectance (reflectance = image_value*RF_MULT + RF_ADD) | |
| RF_ADD | Offset to convert panchromatic image values to reflectance (reflectance = image_value*RF_MULT + RF_ADD) | |
| STATS_MIN | Image minimum values (panchromatic, ndvi) | |
| STATS_MAX | Image maximum values (panchromatic, ndvi) | |
| STATS_STD | Image standard deviations (panchromatic, ndvi) | |
| STATS_MEAN | Image mean values (panchromatic, ndvi) | |
| STATS_PXCT | Image valid pixel counts (panchromatic, ndvi) |
Table 3. Data dictionary for wgs_84_mosaic_100m_tree_variable_density.tif files. Note: Variable is in the file name.
| Variable | Units | Description |
|---|---|---|
| area | m^2 | Total tree area in a given 100 m by 100 m pixel |
| carbon | Mg | Total carbon in a given 100 m by 100 m pixel |
| count | Number of trees in a given 100 m by 100 m pixel |
Table 4. Data dictionary for Allometry_Hiernaux-type.csv files
| Variable | Units | Description |
|---|---|---|
| species | Species name | |
| region | Region | |
| plant_type | Plant type. Tree or shrub | |
| stem_circ_cm | cm | Stem circumference |
| height_m | m | Plant height |
| crown_area_m2 | m^2 | Crown are |
| foliage_dry_mass_kg | kg | Dry mass of foliage |
| basal_area_cm2 | cm^2 | cross-sectional area of a tree at breast height (1.3m above ground) |
| root_dry_mass_kg | kg | Dry mass of roots |
| wood_dry_mass_kg | kg | Dry mass of wood |
Data Viewer Application
Through the data viewer application, users are able to zoom in to any area within the dataset to view individual tree polygons and query their statistics, while at the same time accurately depicting the overall trends of the dataset at lower zoom levels. The visualization also clearly denotes where data were missing. Additionally, the extent and origin of the source imagery, its acquisition date, and a preview of the imagery is available. The viewer was developed to function with Mapbox Studio and browsers that support WebGL: Google Chrome, Apple Safari 9 and above, Microsoft Edge 13 with the Win10 update, and the latest Firefox. The viewer is not compatible with Internet Explorer
When accessing the viewer in a supported browser via http://trees.pgc.umn.edu/app, the users see the image below (Figure 3). Users can zoom in or zoom out with the controls in the upper left-hand corner, or also select the terrain zone or the satellite view. CHIRPS precipitation isolines derived from Funk et al., 2015 are highlighted at 150 mm/year, 300 mm/year, 600 mm/year, and 1000 mm/year (from North to South). Precipitation isolines are only evident with terrain view.
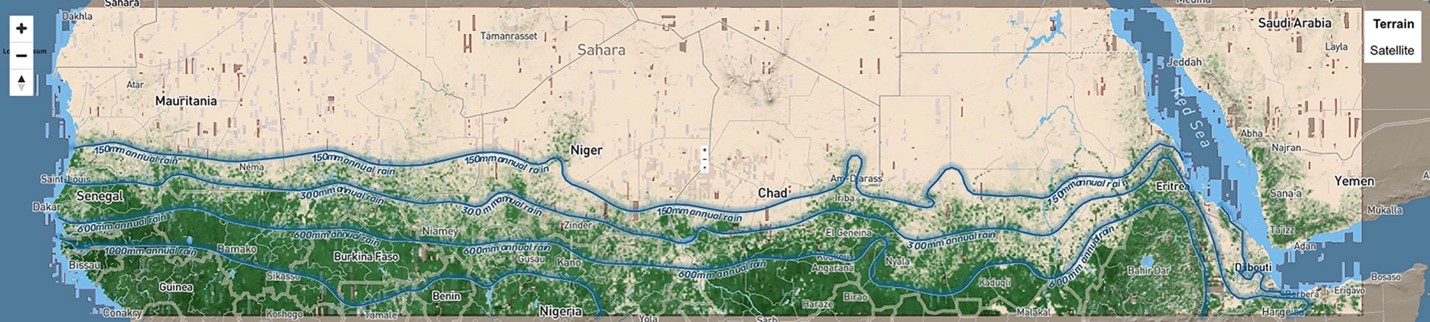
Figure 3. The viewer covers the area from 9.5o N to 24o N and stretches from the Atlantic Ocean to the Red Sea. Tree crowns are mapped over the entire domain shown above.
When users zoom into an area of interest, they will notice areas of no data, areas of possible cloud contamination, and areas of possible aerosol optical thicknesses >0.6 may occur. 5.3% of the study area possibly suffered from cloud contamination, 3.7% possibly suffered from aerosol optical thicknesses >0.6 at 470 nm, and 0.9% of the study area had no data or the data selected did not process (Figure 4). Total cloud and aerosol effects on uncertainty may be as low as 4% or 5%.
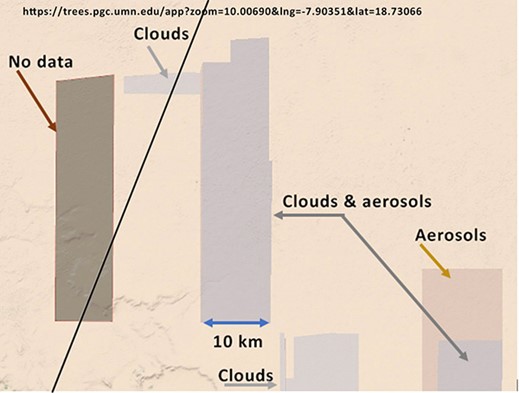
Figure 4. The viewer identifies areas of no data, possible cloudy areas, and areas of aerosol optical depth >0.6 at 470 nm in our input data. The URL is a unique identifier for the exact area for these data in our viewer. The above figure is from Mauritania.
Another feature of the viewer is that you can save the URL from where a user is and when that URL is entered into the browser, you return exactly to that location with the magnification as well (Figure 5). This makes it easy to return to areas of interest simply and quickly. Also clicking on polygons will reveal carbon stock estimates (Figure 5).
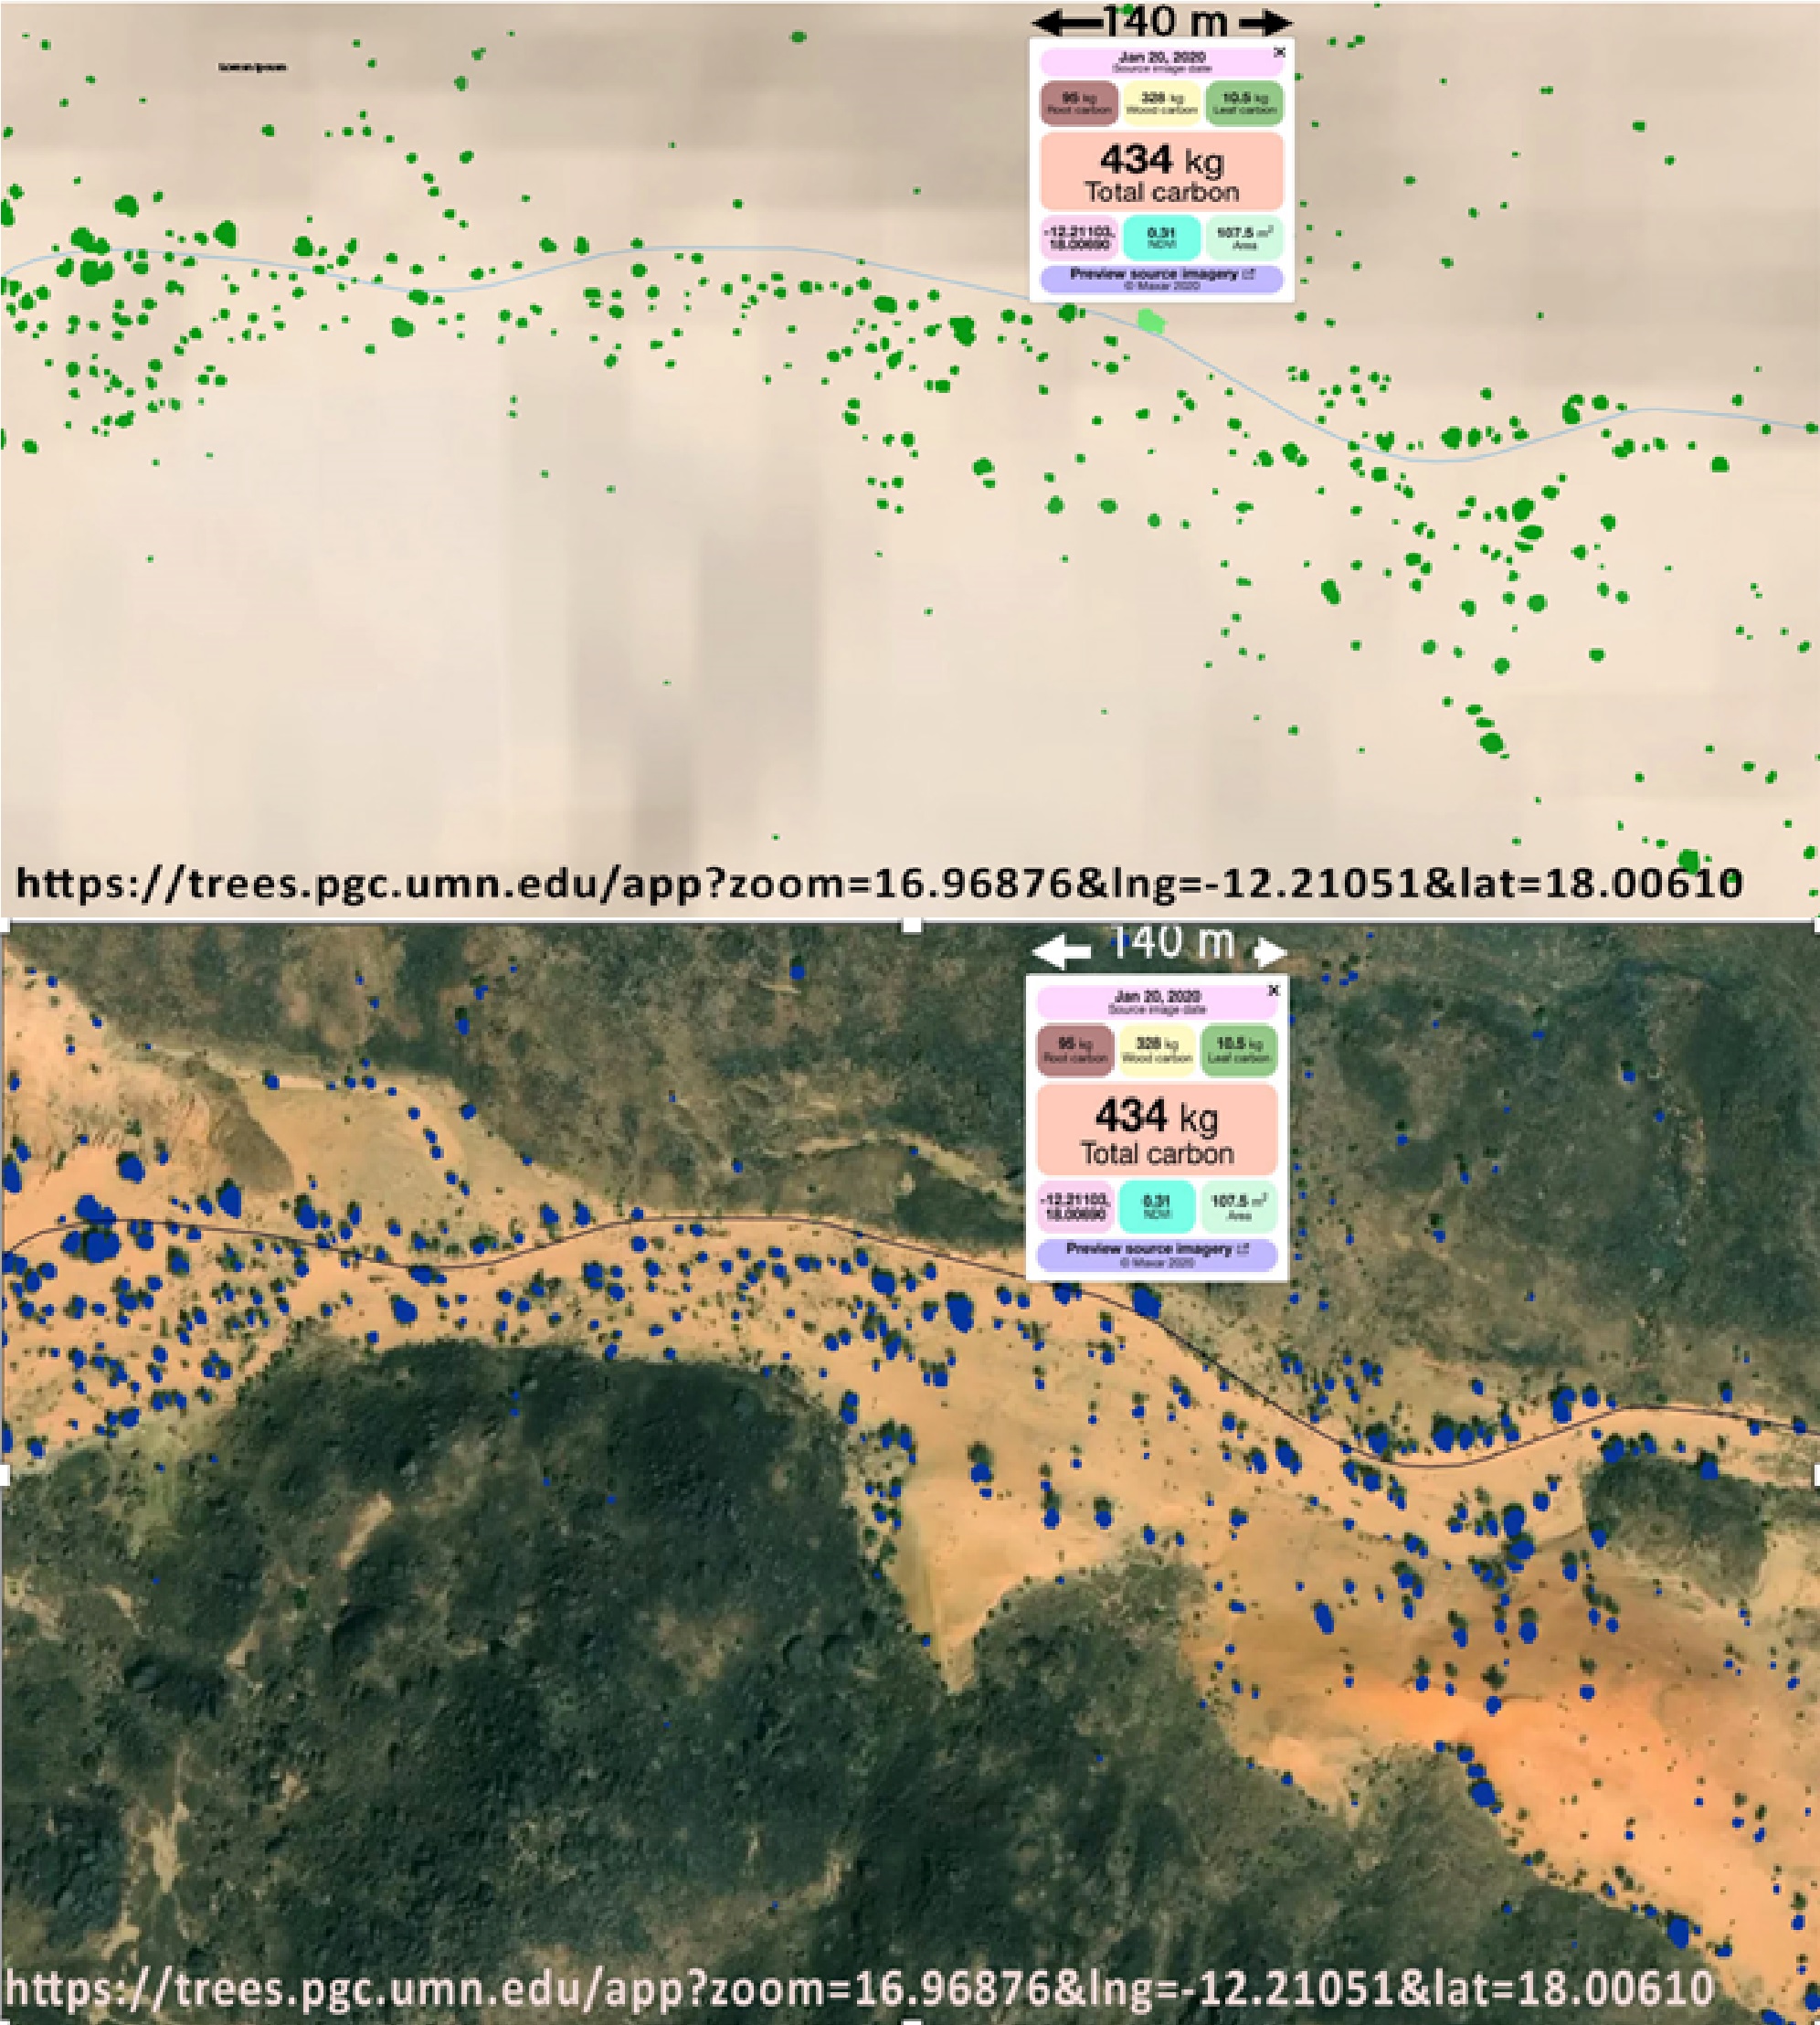
Figure 5. Clicking on a feature (green polygons in the top image and blue polygons in the bottom image) will open a popup revealing information about the polygon, including carbon stock estimates. Addtionally, users can utilize the terrain feature (top image) in combination with the satellite view (the bottom image) to understand the lay of the land for areas of interest. The encoded coordinates uniquely identify the area of interest and the magnification of it for the images in question, i.e. https://trees.pgc.umn.edu/app?zoom=16.96876&lng=-12.21051&lat=18.00610.
Companion File
This dataset contains one companion file: Data_viewer_description_Carbon_Stocks_of_Indiv_Trees.pdf. This file describes how to use the aforementioned data viewer application.
Application and Derivation
Trees outside of forest areas, also known as “non-forest trees”, support the livelihoods of a rapidly increasing population and are an essential factor for the survival and biodiversity of flora and fauna in arid and semi-arid regions. Whereas the monitoring of forests has been carried out on a routine basis, attempts to quantify the density of trees outside of forests have been limited to small sample sizes or local field surveys.
The limited attention devoted to the quantification of individual trees in drylands has led to misinterpretations of the extent of canopy cover, and to confusion related to the definition of canopy cover. Products designed to assess global tree cover are poorly designed to quantify tree cover in drylands, which has resulted in the prevailing view that dryland areas such as the Sahara or Sahel Zone are largely free of trees. For example, in the hyper-arid zone that comprises 58% of the study area, 356,414,476 trees were mapped with an average carbon weight of 51 kg with an average crown area of 15.1 m2 (Tables 5 and 6).
This dataset provides a wall-to-wall identification of non-forest trees, defined as woody plants with a crown area > 3 m2 with an associated shadow, from the Southern Sahara, Sahel Zone, the Sudan Zone, and dry sub-humid zone up to 1000 mm/year precipitation. Approaching the question of semi-arid woody carbon from the 50 cm tree level overcomes many of the problems from previous coarser-resolution satellite studies and dynamic vegetation simulation modeling studies that use tree generalizations at scales of tens of km.
A minimum green tree crown area of 3 m2 with an associated shadow was used as the criteria for trees to be included in the assessment, which excludes small bushes that are difficult to separate from perennial grass tussocks, other types of green vegetation that are not trees, and rocks that cast shadows but have no green vegetation. The disaggregation of clumped trees was achieved by giving the spaces between crowns a larger weight than other spaces during the learning process of the model. See Brandt et al. (2020) for additional information.
Table 5. Summary of tree crown areas by rainfall zones from 0 to 1000 mm/year.
| Average Annual Rainfall | 0 to 150 mm/year | 150 to 300 mm/yr | 300 to 600 mm/yr | 600 to 1000 mm/yr | 0 to 1000 mm/yr |
|---|---|---|---|---|---|
| Tree canopy area class: 3 - 15 m2 | |||||
| Number of trees: | 255,546,965 | 626,479,170 | 1,726,614,955 | 2,593,544,593 | 5,202,185,683 |
| Total tree crown area (m2): | 2,012,361,590 | 5,220,718,528 | 14,706,631,403 | 22,431,391,197 | 44,371,102,717 |
| Average tree crown area (m2): | 7.9 | 8.3 | 8.5 | 8.65 | 8.5 |
| Tree canopy area class: 15 - 50 m2 | |||||
| Number of trees: | 87,996,075 | 318,654,841 | 1,087,080,391 | 2,194,835,124 | 3,688,566,431 |
| Total tree crown area (m2): | 2,180,514,042 | 8,148,464,839 | 28,520,222,361 | 60,090,033,484 | 98,939,234,725 |
| Average tree crown area (m2): | 24.8 | 25.6 | 26.2 | 27.4 | 26.8 |
| Tree canopy area class: 50 - 200 m2 | |||||
| Number of trees: | 12,345,232 | 52,464,724 | 220,438,944 | 719,441,685 | 1,004,690,585 |
| Total tree crown area (m2): | 977,576,124 | 4,106,196,215 | 17,355,450,869 | 60,281,496,573 | 82,720,719,781 |
| Average tree crown area (m2): | 79.2 | 78.3 | 78.7 | 83.8 | 82.3 |
| Tree canopy area class: >200 m2 | |||||
| Number of trees: | 526,204 | 2,353,089 | 8,480,526 | 40,507,703 | 51,867,522 |
| Total tree crown area (m2): | 198,282,953 | 914,635,623 | 2,961,211,656 | 12,955,028,454 | 17,029,158,685 |
| Average tree crown area (m2): | 376.8 | 388.7 | 349.2 | 319.8 | 328.3 |
| Tree canopy area class: Total | |||||
| Number of trees: | 356,414,476 | 999,951,824 | 3,042,614,816 | 5,548,329,105 | 9,947,310,221 |
| Total tree crown area (m2): | 5,368,734,709 | 18,390,015,203 | 63,543,516,289 | 155,757,949,707 | 243,060,215,908 |
| Average tree crown area (m2): | 15.1 | 18.4 | 20.9 | 28.1 | 24.4 |
Table 6. Wood, root, and leaf carbon summary for rainfall zones between 0 to 1000 mm/year.
| Average.Annual.Rainfall | 0 to 150 mm/year | 150 to 300 mm/yr | 300 to 600 mm/yr | 600 to 1000 mm/yr | 0 to 1000 mm/yr |
|---|---|---|---|---|---|
| Tree canopy area class: 3 - 15 m2 | |||||
| Leaf carbon: | 202,282 | 522,327 | 1,468,616 | 2,236,760 | 4,429,985 |
| Root carbon: | 1,677,961 | 4,310,677 | 12,095,620 | 18,393,686 | 36,477,944 |
| Wood carbon: | 4,695,776 | 12,248,210 | 34,578,102 | 52,830,976 | 104,353,064 |
| Total C | 6,576,019 | 17,081,214 | 48,142,337 | 73,461,422 | 145,260,993 |
| Tree canopy area class: 15-50 m2 | |||||
| Leaf carbon: | 197,959 | 737,606 | 2,575,473 | 5,405,075 | 8,916,111 |
| Root carbon: | 1,472,708 | 5,470,388 | 19,052,084 | 39,817,228 | 65,812,407 |
| Wood carbon: | 5,733,360 | 21,498,926 | 75,461,439 | 159,26,270 | 262,419,994 |
| Total C | 7,404,026 | 27,706,919 | 97,088,995 | 204,948,572 | 337,148,513 |
| Tree canopy area class: 50-200 m2 | |||||
| Leaf carbon: | 80,368 | 337,821 | 1,427,098 | 4,938,407 | 6,783,695 |
| Root carbon: | 537,804 | 2,262,317 | 9,551,645 | 32,922,967 | 45,274,733 |
| Wood carbon: | 2,887,565 | 12,118,474 | 51,252,412 | 178,801,123 | 245,059,575 |
| Total C | 3,505,737 | 14,718,612 | 62,231,156 | 216,662,497 | 297,118,003 |
| Tree canopy area class: >200 m2 | |||||
| Leaf carbon: | 16,353 | 75,433 | 244,221 | 1,068,446 | 1,404,454 |
| Root carbon: | 109,720 | 506,115 | 1,638,593 | 7,168,691 | 9,423,120 |
| Wood carbon: | 582,995 | 2,689,227 | 8,706,605 | 38,090,595 | 50,069,422 |
| Total C | 709,068 | 3,270,776 | 10,589,419 | 46,327,732 | 60,896,995 |
| Tree canopy area class: Total | |||||
| Leaf carbon: | 496,962 | 1,673,187 | 5,715,408 | 13,648,687 | 21,534,244 |
| Root carbon: | 3,798,193 | 12,549,498 | 42,337,942 | 98,302,575 | 156,988,208 |
| Wood carbon: | 13,899,696 | 48,554,838 | 169,998,556 | 429,448,953 | 661,902,043 |
| Total C | 18,194,851 | 62,777,522 | 218,051,906 | 541,400,216 | 840,424,495 |
| % total C by ppt zone | 2.20% | 7.50% | 25.90% | 64.40% | |
| % Total ABG C | 2.10% | 7.30% | 25.70% | 64.80% | 683,436,300 |
| Zonal Area (km2) | 5,617,488 | 1,162,239 | 1,434,513 | 1,471,084 | 9,685,324 |
| total area (%) | 58% | 12% | 15% | 15% | |
| number of trees | 356,414,476 | 999,951,824 | 3,042,614,816 | 5,548,329,105 | 9,947,310,221 |
| Ave. tree C (kg) | 51 | 63 | 72 | 98 | 84 |
Quality Assessment
An automatic tree detection framework based on deep learning techniques, and fully convolutional networks was used for mapping individual tree crowns. The underlying model was trained with 89,899 manually delineated tree crowns on 0.5-m satellite imagery. The model was found to operate at an accuracy of 96.6%; specifically a pixel-level comparison between our convolutional neural network determined tree crown area vs. hand annotated tree crown area. Thus implies a small difference between the manual annotation and the high performance computing model results.
An independent tree crown mapping evaluation was undertaken by seven team members for omission and commission errors within the 200 to 1000 mm/year precipitation zone for 850 areas with 50,570 trees. The omission error rates were 2.7% and the commission error rate was 4.9%, a net uncertainty of 2.2%. An evaluation of the uncertainty in the conversion of tree crowns into tree wood, root, and leaf carbon found an allometric uncertainty of ±19.5% assuming independence of allometric errors. Combining uncertainties, we found an overall carbon uncertainty of ±19.8%.
We found 0.9% of our study area had no data or corrupted data that failed to process, 5.3% of our study area was possibly compromised by clouds, and 3.7% was possibly compromised by high aerosol optical thickness. In total 8.9% of our data were possibly affected by clouds or aerosols. Nevertheless, we mapped 691,477,772 tree crowns in these areas.
Data Acquisition, Materials, and Methods
The following is a brief summary of the methods described in Brandt et al. (2020), which were also used and further extended for large-scale application in Tucker et al. (2023). Please see the manuscripts for details.
The mapping of woody plants at the level of single trees was achieved by the use of satellite data at 0.5-m resolution from the Maxar satellites, combined with modern machine-learning techniques. 326,523 Maxar multispectral images from the QuickBird-2, GeoEye-1, WorldView-2 and WorldView-3 satellites were provided to NASA under the NextView license from the National Geospatial Intelligence Agency. These images were collected from 2002 to 2020 from the early dry season months of November to March from 9.5° to 24° N latitude within UTM zones 28 North to 37 North (Figure 2). Normalized difference vegetation index (NDVI) images were used to distinguish green tree crowns from the non-vegetated background because the images were taken from a period during which only woody plants are photosynthetically active in the study area. A set of decision rules was applied to select images for the mosaic, consisting of 16,384 x 16,384-m tiles. This resulted in 94,502 images that were used for the study. Data were assembled over several years with a focus on more recent years to achieve a relatively recent and complete wall-to-wall coverage.
To identify aerosol optical depth and/or cloud cover problems in the Maxar data, MODIS daily aerosol optical depth product and the MODIS daily cloud cover product for the same day and same specific location as the commercial satellite data used in our analysis were used. An aerosol optical depth threshold of > 0.6 at 470 nm and cloud cover threshold >50% was applied to identify possibly affected satellite images. A total of 3,637 Maxar images were flagged for possible aerosol optical depth problems and 3,735 Maxar images were flagged for possible cloud cover problems. Visual evaluations of selected data were employed for each UTM zone at the 100-m scale to independently determine aerosol and cloud problems in the results. This independent aerosol or cloud cover determination found 8.9% of the input data possibly suffered from these two effects.
A neural network model (publicly available at https://doi.org/10.5281/zenodo.3978185) was used to automatically segment the tree crowns—that is, to detect tree crowns in the input images. The segmented areas were then converted to polygons for counting the trees and measuring their crown size. Using machine learning coupled to training data of 89,899 manually delineated and annotated trees, the location of individual trees over 9,685,324 km2 and their crown area were determined from the input images. Trees with a crown area >3 m2 were enumerated resulting in 9,947,310,221 trees identified. The neural network U-Net code and other essential codes used in the study are from the Github code repository at https://github.com/ankitkariryaa/An-unexpectedly-large-count-of-trees-in-the-western-Sahara-and-Sahel/tree/v1.0.0.
The input mosaics processed by the neural network were segmented into ten groups, for each UTM zone, from 28 North to 37 North, respectively, and overlap at their boundary (Figure 2). A tree canopy in the overlapping region may be described by vector polygons in two separate GeoPackage data files. To prevent double counting these canopies in analysis, special attention is required to properly handle the overlapping region. A suggested approach, which was used in Brandt et al. (2020) and Tucker et al. (2023) is that all tree canopy areas are rasterized to 100 m2 resolution images in the WGS 84 coordinate reference system. Nearest-neighbor resampling was used to form mosaics of overlapping images into a single mosaic, which spans the entire study area and prevented duplicative counting of trees. See Figures 6, 7, and 8 for a summary of data organization, data processing, neural network particulars, and allometry. A summary of training data locations can be found in Brandt et al., 2020. A data viewer application was developed to present individual tree crown data in an interactive format. It can be found at: https://trees.pgc.umn.edu/app.
Carbon stocks of trees were derived through allometry data (Hiernaux et al., 2023). Seasonal maximum foliage, wood, and root dry masses were measured on 900, 698 and 26 trees or shrubs from 27, 26 and 5 species respectively. The allometric regression equations for foliage, wood or root masses are linear or power functions using a range of different approaches: Ordinary Least Square regression after log-log transform with or without Baskerville correction (Baskerville, 1972), and Non-Linear Regressions. All the regression outputs are intercompared for fit indicators and by systematic estimates of prediction uncertainty, as well as the resulting trends in root to wood ratio, and foliage to wood ratio over the range of crown areas. This process selected a set of Ordinary Least Square log-log equations with crown area as independent variable. The approximation errors were 0.37 kg dry matter for foliage, 14.0 for wood, and 14.5 for roots, aggregating to 20.1 kg dry matter per tree. These novel allometry equations were compared to published equations for tropical trees, most from more humid tropics, and generally based on stem diameter, tree height and wood density. The novel allometry predictions are within the range of the predictions of these other allometry equations, reinforcing the confidence in their use even beyond the Sahel domain towards sub-humid savannas. For additional details, see Hiernaux et al. (2023).
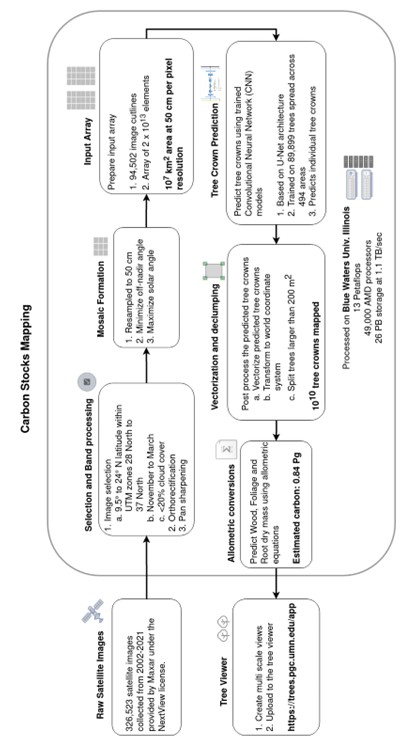
Figure 6. Carbon stocks mapping. A flow chart summary of our satellite data, data selection, band processing, mosaic formation, input array determination, tree crown prediction, vectorization, declumping of contiguous clusters of trees, and allometric conversion.
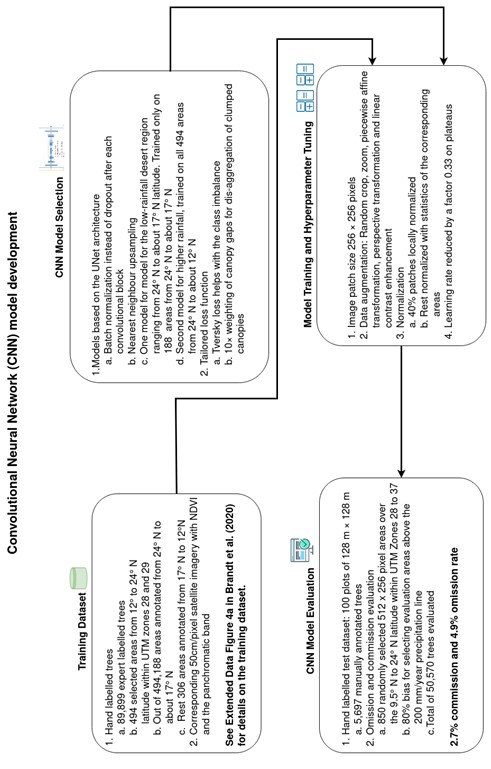
Figure 7. Convolutional neural network model development. A graphical summary of our training data, model selection based on precipitation, model training, hyper-parameter tuning, and model evaluation. See also figure 5 for the locations of all of our training data. Training data were within the 0 to 1000 mm/year precipitation area and were also used by Brandt et al. (2020).
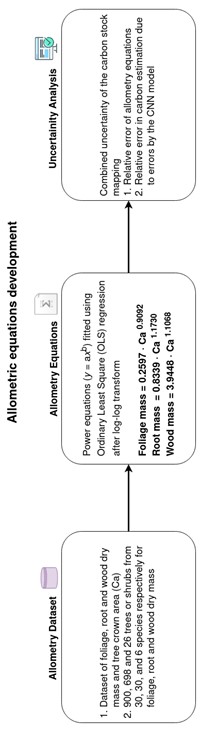
Figure 8. Allometric equation development. A graphical summary of allometry that permits the use of tree crowns to estimate leaf carbon, wood carbon, and root carbon. Carbon uncertainty was determined to be ±19.8%.
Data Access
These data are available through the Oak Ridge National Laboratory (ORNL) Distributed Active Archive Center (DAAC).
Carbon Stocks of Individual Trees in African Drylands: Allometry and Output Data
Contact for Data Center Access Information:
- E-mail: uso@daac.ornl.gov
- Telephone: +1 (865) 241-3952
References
Baskerville G. L., 1972. Use of logarithmic regression in the estimation of plant biomass. Canadian Journal of Forest Research 2, 49-53. https://doi.org/10.1139/x72-009
Brandt, M., C.J. Tucker, A. Kariryaa, K. Rasmussen, C. Abel, J. Small, et al. 2020. An unexpectedly large count of trees in the West African Sahara and Sahel. Nature. https://doi.org/10.1038/s41586-020-2824-5.
Funk, C., P. Peterson, M. Landsfeld, D. Pedreros, J. Verdin, S. Shukla, G. Husak, J. Rowland, L. Harrison, A. Hoell, and J. Michaelsen. 2015. The climate hazards infrared precipitation with stations—a new environmental record for monitoring extremes. Scientific Data 2:150066 DOI: https://doi.org/10.1038/sdata.2015.66.
Hiernaux, P., B.-A. Issoufou, C. Igel, A. Kariryaa, M. Kourouma, J. Chave, E. Mougin, and P. Savadogo. 2023. Allometric equations to assess Sahel woody plant dry mass and carbon content from high resolution satellite imagery. Forest Ecol. & Management 529, 1200653. https://doi.org/10.1016/j.foreco.2022.120653.
Tucker, C. J., M. Brandt, P. Hiernaux, A. Kariryaa, K. Rasmussen, J. Small, C. Abel, et al. 2023. Sub-continental scale carbon stocks of individual trees in African drylands. Nature , 615(7950), 80-86. https://doi.org/10.1038/s41586-022-05653-6