Documentation Revision Date: 2025-03-09
Dataset Version: 3
Summary
There are 49,462 files included in this dataset; 49,461 tar.gz files holding PhenoCam images, in JPEG (*.jpg) format, are packaged by Phenocam site, year, and month. There is also one GeoJSON file holding locations and basic information about each site.
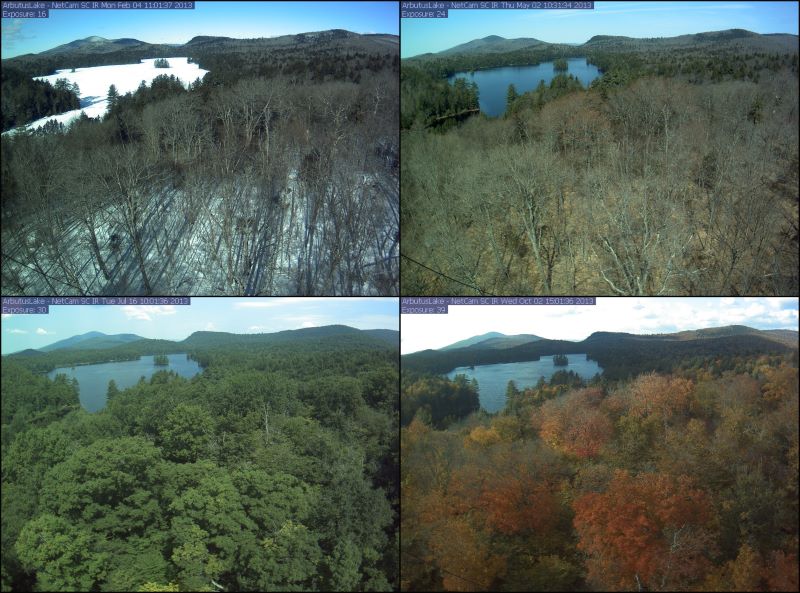
Figure 1: A series of PhenoCam images from February, May, July, and October 2013 at the Arbutus Lake site in New York.
Citation
Ballou, K., Z. Vladich, A.M. Young, T. Milliman, K. Hufkens, C. Coffey, K. Begay, M. Fell, M. Javadian, A.K. Post, C. Schadel, O. Zimmerman, D.M. Browning, C.R. Florian, M.A. Friedl, M. Moon, M.D. SanClements, B. Seyednasrollah, A.D. Richardson, M. Abraha, D.W. Allen, M. Apple, M.A. Arain, A.C. Axel, P.H.J. Badiou, M. Bahn, J. Baker, D. Baldocchi, S.L.J. Bayliss, N. Behrens, C.M. Beier, C.J. Bernacchi, D. Berveiller, J. Bhattacharjee, S.C. Biraud, J.J. Blais, P. Blanken, M. Bonfim, D.D. Bosch, R. Boughton, E.H. Boughton, R.F. Brown, N. Brunsell, S.P. Burns, M.S. Carbone, B.R. Carlson, A. Carrara, M. Cavagna, W.S. Chan, J. Chen, A. Christen, N. Chrysoulakis, H. Chu, P.E. Clark, B.J. Conrad, M.R. Cortese, R.M. Crandall, E. Cremonese, H. Crepaz, F.W. Davis, D. Debinski, A.R. Desai, M. Detto, R. Diaz-Delgado, L. Duchesne, A.L. Dunn, K.J. Easterday, D.M. Eissenstat, T. El-Madany, D.S.S. Ellum, S.K.M. Ernest, A. Esposito, E.S. Euskirchen, L. Fenstermaker, L.F. Filchev, J.M. Fill, L.B. Flanagan, B. Forsythe, J.M. Frank, A.L. Freestone, J. Gallagher, M.B. Garcia, D. Garcia-Diaz, M. Gharun, D. Gianelle, J.M. Gonet, S.C. Goslee, T. Griffis, P. Groffman, L. Gu, J. Guillemot, I.M. Halm, M. Halpin, A. Hammerle, C.V. Hanson, P.J. Hanson, Z. Harlow, K.M. Hart, C.E. Hatch, P.L. Heinrich, D. Hemming, M. Heskel, A.C. Hill, A.A. Hove, T. Hubner, D. Hui, E.R. Humphreys, P.C. Inkenbrandt, A. Jaimes-Hernandez, R. Jensen, B.G. Johnson, J.M.F. Johnson, L.S.K. Joseph, E. Keel, V.R. Kelly, K.W. King, J.W. Kirchner, P.B. Kirchner, M.A. Kline, S.H. Knox, M. Krassovski, K.L. Ladig, P.E. Laerke, O. Langvall, N.K. Lany, G. Lanthier, G. le Maire, H. Liu, Y.P. Luo,R. López Jiménez, A. Manco, J. Marrs, T.A. Martin, M. Mauritz, G. McCarty, B. McNeil, F. Meier, M. Mensinger, G.A. Meyer, M. Migliavacca, T. Miura, B.P. Mohanty, C.E. Moore, R. Mudd, J.W. Munger, Z.E. Murrell, Z. Nesic, H.S. Neufeld, J. Norris, J. O'Connell, T.L. O'Halloran, W. Oechel, A.C. Oishi, B. Oryan, W.W. Oswald, D.M.P. Peltier, J. Perez-Quezada, T.D. Perkins, C. Phillips, M. Pizarro, D. Poursanidis, J.W.M. Pullens, P. Ramanamandimby, M.P. Rao, R.L. Ray, M.L. Reba, C. Redmond, A. Reinmann, D.A. Roberts, G.P. Robertson, M. Rodriguez-Caton, K. Rumora, B.C. Rundquist, B.R.K. Runkle, T. Sachs, E.J. Sadler, A. Saha, N.Z. Saliendra, T.S. Sankey, H. Scheifinger, L. Schmalbeck, M.R. Schuppenhauer, M.D. Schwartz, R.L. Scott, S.D. Sebestyen, D. Smale, E.M. Smith, J. Smith, O. Sonnentag, P. Stoy, S. Strachan, K. Suvocarev, D. Szutu, F. Tekinay, J.E. Thom, R.Q. Thomas, C. Trauernicht, D. Trejo, D. Tsirantonakis, A. Valero, A.K. Van den berg, M.K. Van der molen, R. Vargas, M. Vellend, J. Verfaillie, C.S. Vogel, A. Vrieling, J.J. Walker, J.R. Ward, D.A. Watts, N. Webb, P. Wetzel, S. Weyers, A.V. Whipple, C.W. Whippo, W.A. White, T.G. Whitham, C. Wille, A. Wingler, G. Wohlfahrt, S. Wolf, J.D. Wood, A.L. Woodley, J. Yang, X. Yang, G. Yenni, A.J. Zambrano-olimpo, A. Zandonai, Y. Zhang, and D. Zona. 2025. PhenoCam Dataset v3.0: Digital Camera Imagery from the PhenoCam Network, 2000-2023. ORNL DAAC, Oak Ridge, Tennessee, USA. https://doi.org/10.3334/ORNLDAAC/2364
Table of Contents
- Dataset Overview
- Data Characteristics
- Application and Derivation
- Quality Assessment
- Data Acquisition, Materials, and Methods
- Data Access
- References
- Dataset Revisions
Dataset Overview
This dataset provides a time series of visible-wavelength digital camera imagery collected through the PhenoCam Network at each of 738 sites across diverse ecosystems of the world (mostly North America) from 2000-2023. Vegetation types such as deciduous broadleaf forests, grasslands, evergreen needleleaf forests, and agriculture are the best-represented.The raw imagery was used to derive information on phenology, including time series of vegetation color, canopy greenness, and phenology transition dates for the PhenoCam Dataset v3.0. The images are provided in JPEG format organized in compressed tar.gz archives by site and date. Site locations and basic metadata are included in a GeoJSON file.
Related Publications:
Richardson, A.D., Hufkens, K., Milliman, T., Aubrecht, D.M., Chen, M., Gray, J.M., Johnston, M.R., Keenan, T.F., Klosterman, S.T., Kosmala, M., Melaas, E.K., Friedl, M.A., Frolking, S. 2018. Tracking vegetation phenology across diverse North American biomes using PhenoCam imagery. Scientific Data 180028. DOI: https://doi.org/10.1038/sdata.2018.28
- This paper provides an in-depth description of the methods used for PhenoCam image analysis and data processing. Users are encouraged to cite this paper along with the current dataset.
Seyednasrollah, B., A.M. Young, K. Hufkens, T. Milliman, M.A. Friedl, S. Frolking, and A.D. Richardson. 2019. Tracking vegetation phenology across diverse biomes using PhenoCam imagery: The PhenoCam Dataset v2.0. Scientific Data 6:222. https://doi.org/10.1038/s41597-019-0229-9
Young, A.M., T. Milliman, K. Hufkens, K. Ballou, C. Coffey, K. Begay, M. Fell, M. Javadian, A.K. Post, C. Schädel, Z. Vladich, O. Zimmerman, D.M. Browning, C.R. Florian, M.A. Friedl, M. Moon, M.D. SanClements, B. Seyednasrollah, and A.D. Richardson. 2025. Tracking vegetation phenology across diverse biomes using PhenoCam imagery: The PhenoCam Dataset v3.0. Submitted to Earth System Science Data.
Related Dataset:
Seyednasrollah, B., et al. 2019. PhenoCam Dataset v2.0: Vegetation Phenology from Digital Camera Imagery, 2000-2018. ORNL DAAC, Oak Ridge, Tennessee, USA. https://doi.org/10.3334/ORNLDAAC/1674
- Version 2 of this dataset.
Zimmerman, O., et.al. 2024. PhenoCam Dataset v3.0: Vegetation Phenology from Digital Camera Imagery, 2000-2023. ORNL DAAC, Oak Ridge, Tennessee, USA. https://doi.org/10.3334/ORNLDAAC/2389
- Zimmerman et al. (2024) provides measures of vegetation phenology derived from images in this dataset.
Acknowledgments:
The development of PhenoCam has been supported by the Northeastern States Research Cooperative, the National Science Foundation, the Long-Term Agroecosystem Research (LTAR) network supported by the United States Department of Agriculture, the National Ecological Observatory Network (NEON) program sponsored by the National Science Foundation, the U.S.Department of Energy, Oak Ridge National Laboratory, the U.S. National Park Service Inventory and Monitoring Program, the USA National Phenology Network, and the North Central Climate Science Center of the United States Geological Survey.
Data Characteristics
Spatial Coverage: Multiple points mostly over North America, Europe, and other continents
Spatial Resolution: Point
Temporal Resolution: Variable. Generally every 30 minutes, but in some cases only once-daily.
Temporal Coverage: 2000-02-01 to 2023-12-31
Spatial Extent: (All latitude and longitude given in decimal degrees)
| Sites | Westernmost Longitude | Easternmost Longitude | Northernmost Latitude | Southernmost Latitude |
|---|---|---|---|---|
| Global | -158.1701 | 172.3502 | 71.2825 | -45.0384 |
Data File Information
There are 49,462 files included in this dataset; 49,461 tar.gz files holding PhenoCam images, in JPEG (*.jpg) format, are packaged by Phenocam site, year, and month. There is also one GeoJSON file holding locations and basic information about each site.
The naming convention for *.tar.gz files is <site>_<yyyy>_<mm>.tar.gz, where
- <site> = site name
- <yyyy> = year
- <mm> = month
Example file name for data from the ARM site in Oklahoma from May 2004: armoklahoma_2004_05.tar.gz
Once uncompressed, each tar.gz file contains a series of nested directories for the site, year, and month, and then the series of JPEG (*.jpg) visible-wavelength images for that month.
The visible-wavelength jpg images are named as: <site>_<yyyy>_<mm>_<dd>_hhmmss.jpg, where
- <dd> = day
- <hhmmss> = time in the local standard time at the site
For sites using the StarDot NetCam SC IR camera and following the standard PhenoCam configuration protocol, the tar.gz file also includes a series of monochrome JPEG (*.jpg) visible+infrared images, as well as metadata files (flat text) paired with each image.
The visible+infrared jpg images are named <site>_IR_<yyyy>_<mm>_<dd>_hhmmss.jpg.
The metadata files for visible-wavelength images are named <site>_<yyyy>_<mm>_<dd>_hhmmss.meta.
The metadata files for visible+infrared images are named <site>_IR_<yyyy>_<mm>_<dd>_hhmmss.meta.
(See the related dataset at https://doi.org/10.3334/ORNLDAAC/2389 for information on local time offset from UTC time.)
The locations of PhenoCam sites are included as point locations in a GeoJSON file: phenocam_images_sites_v3.geojson.
Table 1: Point attributes for PhenoCam locations in phenocam_sites_v3.geojson.
| Attribute | Units | Description |
|---|---|---|
| sitename | - | the name of the camera site, e.g. “coweeta,” used to designate all images and products associated with site |
| long_name | - | a more descriptive name for each camera site |
| lat | degrees north | the latitude (in decimal degrees) of the camera itself |
| lon | degrees east | the longitude (in decimal degrees) of the camera itself |
| elevation | m | the elevation of the ground surface (m above sea level) at the camera site |
| date_start | YYYY-MM-DD | the date of the first image in the archive for this site |
| date_end | YYYY-MM-DD | the date of the last image in the archive for this site |
| site_years | y | number years site has operated |
| site_type | - | the site class (Type I, II, or III) |
| infrared_enabled | - | whether camera is infrared enabled: Yes (Y), No (N) |
| utc_offset | h | difference between UTC time and local standard time at site |
| camera_description | - | the brand and model of the camera being used |
| camera_orientation | - | the compass direction in which the camera is pointing |
| flux_data | - | “True” if eddy covariance flux measurements were made at the site |
| flux_networks | - | name of flux network if the site belongs to a network (e.g., AmeriFlux, Fluxnet-Canada) |
| flux_sitenames | - | FLUXNET site code, if applicable |
| ecoregion | - | numeric code identifying the site’s EPA Ecoregion |
| MAP_site | mm | mean annual precipitation as reported by site personnel |
| MAP_daymet | mm | mean annual precipitation from the Daymet |
| MAP_worldclim | mm | mean annual precipitation from WorldClim |
| MAT_site | degree C | mean annual temperature as reported by site personnel |
| MAT_daymet | degree C | mean annual temperature from the Daymet |
| MAT_worldclim | degree C | mean annual temperature from WorldClim |
| primary_veg_type | - | abbreviation for the primary vegetation type at the site (see Table 2) |
| secondary_veg_type | - | abbreviation for the secondary vegetation type at the site (see Table 2) |
| dominant_species | - | Latin binomials for the dominant species at each site, as reported by site personnel |
| landcover_igbp | - | numeric code corresponding to the land cover classification scheme of the International Geosphere-Biosphere Programme, derived from MODIS imagery (Friedl et al., 2010; Channan et al., 2014) |
| wwf_biome | - | numeric code corresponding to the biome classification scheme of the World Wildlife Fund (Olson et al., 2001) |
| koeppen_geiger | - | climate classification according to the Köppen-Geiger system (Kottek et al, 2006) |
Table 2. Vegetation types for PhenoCam sites. Site-years and number of sites pertains to the primary vegetation type at sites.
| Abbreviation | Description | Site-years | Number of sites |
|---|---|---|---|
| AG | agriculture | 602.6 | 136 |
| DB | deciduous broadleaf | 1204.1 | 168 |
| DN | deciduous needleleaf | 12.4 | 1 |
| EB | evergreen broadleaf | 116.6 | 25 |
| EN | evergreen needleleaf | 608.5 | 100 |
| GR | grassland | 710.6 | 138 |
| NV | non-vegetated | 1.4 | 1 |
| SH | shrubs | 297.2 | 61 |
| TN | tundra | 144.9 | 18 |
| UN | forest understory | 14.2 | 3 |
| WL | wetland | 162.9 | 31 |
| Total | 4172.2 | 738 | |
Application and Derivation
Data derived from PhenoCam imagery can be used for phenological model validation and development, evaluation of satellite remote sensing data products, understanding relationships between canopy phenology and ecosystem processes, study of the seasonal changes in leaf-level physiology that are associated with changes in leaf color, benchmarking earth system models, and studies of climate change impacts on terrestrial ecosystems (Richardson et al., 2018; Seyednasrollah et al. 2019).
Quality Assessment
Quality assurance was conducted by quantitative analysis through automated quality control routines (e.g. filtering and outlier detection) and a visual evaluation of each time series to examine consistency and overall quality (Richardson et al., 2018; Seyednasrollah et al. 2019; Young et al., 2025).
Data Acquisition, Materials, and Methods
PhenoCam Network
The PhenoCam network is a cooperative network, established in 2008, that uses digital camera imagery to monitor ecosystem dynamics over time. It serves as a long-term, continental-scale, phenological observatory with cameras deployed within North America, from Alaska to Texas, and from Maine to Hawaii, and some on other continents.
The data included here are visible-wavelength, automated digital camera imagery from 738 camera sites, together totaling 4172.2 site-years of data across different ecoregions, climate zones, and vegetation types. Vegetation types such as deciduous broadleaf forests (1204 site-years of data in the dataset), grasslands (710 site-years), evergreen needleleaf forests (608 site-years), and agriculture (603 site-years) are the best-represented.
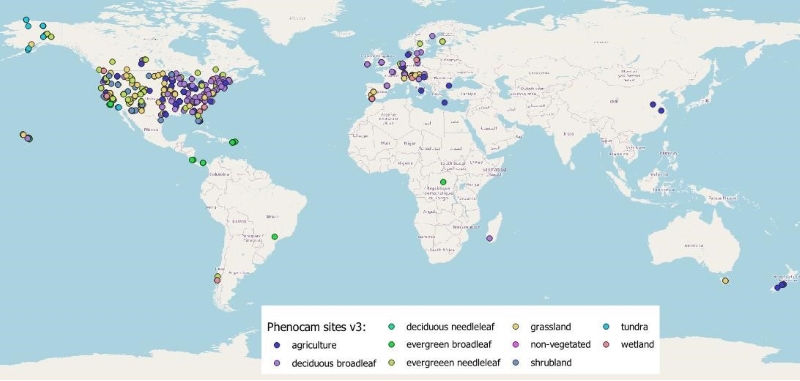
Figure 2. Global distribution of PhenoCam sites represented in this dataset. There are 624 sites in North America, 85 in Europe, 7 in Oceania, 3 in South America, 2 in Africa, and 2 in Asia.
Image Analysis for Phenology
These images were used to track vegetation phenology (Richardson et al., 2018) and results are available in Zimmerman et al. (2024). For each image, summary statistics for RGB (red, green, blue) color channels were calculated across a region-of-interest (ROI) delineating a specific vegetation type. From the high-frequency (typically, 30 minute) imagery, time series characterizing vegetation color, including canopy greenness (canopy greenness index -- the green chromatic coordinate, Gcc) and red chromatic coordinate (Rcc) were derived for 1- and 3-day intervals. For cameras recording visible+infrared images, the cameraNDVI index is calculated using methods described in Young et al. (2025).
See Seyednasrollah et al. (2019a, 2019b), Zimmerman et al. (2024), and Young et al. (2025) for more details.
Data Access
These data are available through the Oak Ridge National Laboratory (ORNL) Distributed Active Archive Center (DAAC).
PhenoCam Dataset v3.0: Digital Camera Imagery from the PhenoCam Network, 2000-2023
Contact for Data Center Access Information:
- E-mail: uso@daac.ornl.gov
- Telephone: +1 (865) 241-3952
References
Channan, S., Collins, K. and Emanuel, W.R., 2014. Global mosaics of the standard MODIS land cover type data. University of Maryland and the Pacific Northwest National Laboratory, College Park, Maryland, USA, 30.
Friedl, M.A., D. Sulla-Menashe, B. Tan, A. Schneider, N. Ramankutty, A. Sibley, and X. Huang. 2010. MODIS Collection 5 global land cover: Algorithm refinements and characterization of new datasets. Remote Sensing of Environment 114:168-182. https://doi.org/10.1016/j.rse.2009.08.016
Kottek, M., Grieser, J., Beck, C., Rudolf, B. and Rubel, F., 2006. World map of the Köppen-Geiger climate classification updated. Meteorologische Zeitschrift 15:259-263. https://doi.org/10.1127/0941-2948/2006/0130
Richardson, A.D., K. Hufkens, T. Milliman, D.M. Aubrecht, M. Chen, J.M. Gray, M. R. Johnston, T.F. Keenan, S.T. Klosterman, M. Kosmala, E.K. Melaas, M.A. Friedl, and S. Frolking. 2018. Tracking vegetation phenology across diverse North American biomes using PhenoCam imagery. Scientific Data 5:80028. https://doi.org/10.1038/sdata.2018.28
Seyednasrollah, B., A.M. Young, K. Hufkens, T. Milliman, M.A. Friedl, S. Frolking, and A.D. Richardson. 2019a. Tracking vegetation phenology across diverse biomes using PhenoCam imagery: The PhenoCam Dataset v2.0. Scientific Data 6:222. https://doi.org/10.1038/s41597-019-0229-9
Seyednasrollah, B., A.M. Young, K. Hufkens, T. Milliman, M.A. Friedl, S. Frolking, A.D. Richardson, M. Abraha, D.W. Allen, M. Apple, M.A. Arain, J. Baker, J.M. Baker, D. Baldocchi, C.J. Bernacchi, J. Bhattacharjee, P. Blanken, D.D. Bosch, R. Boughton, E.H. Boughton, R.F. Brown, D.M. Browning, N. Brunsell, S.P. Burns, M. Cavagna, H. Chu, P.E. Clark, B.J. Conrad, E. Cremonese, D. Debinski, A.R. Desai, R. Diaz-Delgado, L. Duchesne, A.L. Dunn, D.M. Eissenstat, T. El-Madany, D.S.S. Ellum, S.M. Ernest, A. Esposito, L. Fenstermaker, L.B. Flanagan, B. Forsythe, J. Gallagher, D. Gianelle, T. Griffis, P. Groffman, L. Gu, J. Guillemot, M. Halpin, P.J. Hanson, D. Hemming, A.A. Hove, E.R. Humphreys, A. Jaimes-Hernandez, A.A. Jaradat, J. Johnson, E. Keel, V.R. Kelly, J.W. Kirchner, P.B. Kirchner, M. Knapp, M. Krassovski, O. Langvall, G. Lanthier, G.l. Maire, E. Magliulo, T.A. Martin, B. McNeil, G.A. Meyer, M. Migliavacca, B.P. Mohanty, C.E. Moore, R. Mudd, J.W. Munger, Z.E. Murrell, Z. Nesic, H.S. Neufeld, T.L. O'Halloran, W. Oechel, A.C. Oishi, W.W. Oswald, T.D. Perkins, M.L. Reba, B. Rundquist, B.R. Runkle, E.S. Russell, E.J. Sadler, A. Saha, N.Z. Saliendra, L. Schmalbeck, M.D. Schwartz, R.L. Scott, E.M. Smith, O. Sonnentag, P. Stoy, S. Strachan, K. Suvocarev, J.E. Thom, R.Q. Thomas, A.K. Van den berg, R. Vargas, J. Verfaillie, C.S. Vogel, J.J. Walker, N. Webb, P. Wetzel, S. Weyers, A.V. Whipple, T.G. Whitham, G. Wohlfahrt, J.D. Wood, S. Wolf, J. Yang, X. Yang, G. Yenni, Y. Zhang, Q. Zhang, and D. Zona. 2019b. PhenoCam Dataset v2.0: Vegetation Phenology from Digital Camera Imagery, 2000-2018. ORNL DAAC, Oak Ridge, Tennessee, USA. https://doi.org/10.3334/ORNLDAAC/1674
Young, A.M., T. Milliman, K. Hufkens, K. Ballou, C. Coffey, K. Begay, M. Fell, M. Javadian, A.K. Post, C. Schädel, Z. Vladich, O. Zimmerman, D.M. Browning, C.R. Florian, M.A. Friedl, M. Moon, M.D. SanClements, B. Seyednasrollah, and A.D. Richardson. 2025. Tracking vegetation phenology across diverse biomes using PhenoCam imagery: The PhenoCam Dataset v3.0. Submitted to Earth System Science Data.
Zimmerman, O., A.M. Young, T. Milliman, K. Hufkens, K. Ballou, C. Coffey, K. Begay, M. Fell, M. Javadian, A.K. Post, C. Schadel, Z. Vladich, D.M. Browning, C.R. Florian, M.A. Friedl, M. Moon, M.D. SanClements, B. Seyednasrollah, A.D. Richardson, M. Abraha, M. Alber, D.W. Allen, M. Apple, M.A. Arain, A.C. Axel, P.H.J. Badiou, M. Bahn, J. Baker, D. Baldocchi, S.L.J. Bayliss, N. Behrens, C.M. Beier, C.J. Bernacchi, D. Berveiller, J. Bhattacharjee, S.C. Biraud, J.J. Blais, P. Blanken, M. Bonfim, D.D. Bosch, R. Boughton, E.H. Boughton, R.F. Brown, N. Brunsell, S.P. Burns, M.S. Carbone, B.R. Carlson, A. Carrara, M. Cavagna, W.S. Chan, J. Chen, A. Christen, N. Chrysoulakis, H. Chu, P.E. Clark, B.J. Conrad, M.R. Cortese, R.M. Crandall, E. Cremonese, H. Crepaz, F.W. Davis, D. Debinski, A.R. Desai, M. Detto, R. Diaz-Delgado, L. Duchesne, A. Dunn, K.J. Easterday, D.M. Eissenstat, T. El-madany, D.S.S. Ellum, S.K.M. Ernest, A. Esposito, E.S. Euskirchen, L. Fenstermaker, L.F. Filchev, J.M. Fill, L.B. Flanagan, B. Forsythe, J.M. Frank, A.L. Freestone, J. Gallagher, M. García , D. Garcia-diaz, M. Gharun, D. Gianelle, J.M. Gonet, S.C. Goslee, T. Griffis, P. Groffman, L. Gu, J. Guillemot, I.M. Halm, M. Halpin, A. Hammerle, P.J. Hanson, C.V. Hanson, Z. Harlow, K.M. Hart, C.E. Hatch, P.L. Heinrich, D. Hemming, M. Heskel, A.C. Hill, A.A. Hove, T. Hubner, D. Hui, E.R. Humphreys, P.C. Inkenbrandt, A. Jaimes-hernandez, R. Jensen, R.L. Jiménez, J. Johnson, B.G. Johnson, L.S.K. Joseph, E. Keel, V.R. Kelly, K.W. King, J.W. Kirchner, P.B. Kirchner, M.A. Kline, S.H. Knox, M. Krassovski, K.L. Ladig, P.E. Laerke, O. Langvall, G. Lanthier, N.K. Lany, G.l. Maire, H. Liu, Y. Luo, A. Manco, J. Marrs, T.A. Martin, M. Mauritz, G. McCarty, B. McNeil, F. Meier, M. Mensinger, G. Meyer, M. Migliavacca, T. Miura, B.P. Mohanty, C.E. Moore, R. Mudd, J.W. Munger, Z.E. Murrell, Z. Nesic, H.S. Neufeld, J. Norris, J. O'Connell, T.L. O'Halloran, W. Oechel, A.C. Oishi, B. Oryan, W.W. Oswald, D.M.P. Peltier, J. Perez-Quezada, T.D. Perkins, C. Phillips, M. Pizarro, D. Poursanidis, J.W.M. Pullens, P. Ramanamandimby, M.P. Rao, R.L. Ray, M.L. Reba, C. Redmond, A. Reinmann, D.A. Roberts, G.P. Robertson, M. Rodriguez-Caton, K. Rumora, B.C. Rundquist, B.R.K. Runkle, T. Sachs, E.J. Sadler, A. Saha, N.Z. Saliendra, T.S. Sankey, H. Scheifinger, L. Schmalbeck, M.R. Schuppenhauer, M.D. Schwartz, R.L. Scott, S.D. Sebestyen, D. Smale, E.M. Smith, J. Smith, O. Sonnentag, P. Stoy, S. Strachan, K. Suvocarev, D. Szutu, F. Tekinay, J.E. Thom, R.Q. Thomas, C. Trauernicht, D. Trejo, D. Tsirantonakis, A. Valero, A.K. Van den berg, M.K. Van der molen, R. Vargas, M. Vellend, J. Verfaillie, C.S. Vogel, A. Vrieling, J.J. Walker, J.R. Ward, D.A. Watts, N. Webb, P. Wetzel, S. Weyers, A.V. Whipple, C.W. Whippo, W.A. White, T.G. Whitham, C. Wille, A. Wingler, G. Wohlfahrt, S. Wolf, J.D. Wood, A.L. Woodley, J. Yang, X. Yang, G. Yenni, A.J. Zambrano-olimpo, A. Zandonai, Y. Zhang, and D. Zona. 2025. PhenoCam Dataset v3.0: Vegetation Phenology from Digital Camera Imagery, 2000-2023. ORNL DAAC, Oak Ridge, Tennessee, USA. https://doi.org/10.3334/ORNLDAAC/2389
Dataset Revisions
| Version | Release Date | Revision Notes |
|---|---|---|
| 3 | 2025-03-09 | Time series extended to 2023. Total sites increased to 738 across global distribution. Added a GeoJSON of PhenoCam sites. |
| 2 | 2019-09-04 | Time series was extended to 2018. Number of sites increased from 133 to 393. https://doi.org/10.3334/ORNLDAAC/1689 |
| 1 | 2017-12-27 | Original publication: https://doi.org/10.3334/ORNLDAAC/1560 |