Documentation Revision Date: 2025-03-10
Dataset Version: 3
Summary
This data set holds a total of 14,284 files. It contains 738 site descriptions files (in both *.txt format and *.JSON format), 2406 region-of-interest definition (ROI) files in TIFF format, 10,401 *.csv files, including ROI index files, and time series of extracted image color and greenness transitions processed to 1- and 3-day intervals, as well as time series of "camera NDVI" at 1- and 3-day intervals, and a new "simplified" data product at 1-day interval. Site locations and basic characteristics are also included in a GeoJSON file.
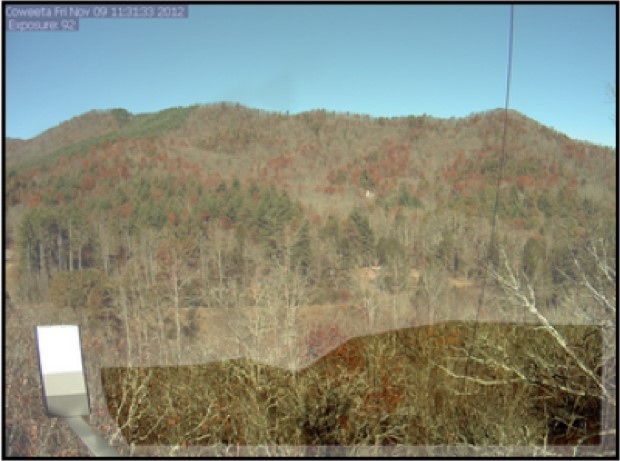
Figure 1. PhenoCam Network image from the Coweeta, North Carolina site. The region of interest (ROI) at the time this image was acquired was the transparent area with deciduous vegetation in the foreground.
Citation
Zimmerman, O., A.M. Young, T. Milliman, K. Hufkens, K. Ballou, C. Coffey, K. Begay, M. Fell, M. Javadian, A.K. Post, C. Schadel, Z. Vladich, D.M. Browning, C.R. Florian, M.A. Friedl, M. Moon, M.D. SanClements, B. Seyednasrollah, A.D. Richardson, M. Abraha, M. Alber, D.W. Allen, M. Apple, M.A. Arain, A.C. Axel, P.H.J. Badiou, M. Bahn, J. Baker, D. Baldocchi, S.L.J. Bayliss, N. Behrens, C.M. Beier, C.J. Bernacchi, D. Berveiller, J. Bhattacharjee, S.C. Biraud, J.J. Blais, P. Blanken, M. Bonfim, D.D. Bosch, R. Boughton, E.H. Boughton, R.F. Brown, N. Brunsell, S.P. Burns, M.S. Carbone, B.R. Carlson, A. Carrara, M. Cavagna, W.S. Chan, J. Chen, A. Christen, N. Chrysoulakis, H. Chu, P.E. Clark, B.J. Conrad, M.R. Cortese, R.M. Crandall, E. Cremonese, H. Crepaz, F.W. Davis, D. Debinski, A.R. Desai, M. Detto, R. Diaz-Delgado, L. Duchesne, A. Dunn, K.J. Easterday, D.M. Eissenstat, T. El-madany, D.S.S. Ellum, S.K.M. Ernest, A. Esposito, E.S. Euskirchen, L. Fenstermaker, L.F. Filchev, J.M. Fill, L.B. Flanagan, B. Forsythe, J.M. Frank, A.L. Freestone, J. Gallagher, M. GarcÃa, D. Garcia-Diaz, M. Gharun, D. Gianelle, J.M. Gonet, S.C. Goslee, T. Griffis, P. Groffman, L. Gu, J. Guillemot, I.M. Halm, M. Halpin, A. Hammerle, P.J. Hanson, C.V. Hanson, Z. Harlow, K.M. Hart, C.E. Hatch, P.L. Heinrich, D. Hemming, M. Heskel, A.C. Hill, A.A. Hove, T. Hubner, D. Hui, E.R. Humphreys, P.C. Inkenbrandt, A. Jaimes-Hernandez, R. Jensen, J. Johnson, B.G. Johnson, L.S.K. Joseph, E. Keel, V.R. Kelly, K.W. King, J.W. Kirchner, P.B. Kirchner, M.A. Kline, S.H. Knox, M. Krassovski, K.L. Ladig, P.E. Laerke, O. Langvall, G. Lanthier, N.K. Lany, R. López Jiménez, G.l. Maire, H. Liu, Y. Luo, A. Manco, J. Marrs, T.A. Martin, M. Mauritz, G. McCarty, B. McNeil, F. Meier, M. Mensinger, G. Meyer, M. Migliavacca, T. Miura, B.P. Mohanty, C.E. Moore, R. Mudd, J.W. Munger, Z.E. Murrell, Z. Nesic, H.S. Neufeld, J. Norris, J. O'Connell, T.L. O'Halloran, W. Oechel, A.C. Oishi, B. Oryan, W.W. Oswald, D.M.P. Peltier, J. Perez-Quezada, T.D. Perkins, C. Phillips, M. Pizarro, D. Poursanidis, J.W.M. Pullens, P. Ramanamandimby, M.P. Rao, R.L. Ray, M.L. Reba, C. Redmond, A. Reinmann, D.A. Roberts, G.P. Robertson, M. Rodriguez-Caton, K. Rumora, B.C. Rundquist, B.R.K. Runkle, T. Sachs, E.J. Sadler, A. Saha, N.Z. Saliendra, T.S. Sankey, H. Scheifinger, L. Schmalbeck, M.R. Schuppenhauer, M.D. Schwartz, R.L. Scott, S.D. Sebestyen, D. Smale, E.M. Smith, J. Smith, O. Sonnentag, P. Stoy, S. Strachan, K. Suvocarev, D. Szutu, F. Tekinay, J.E. Thom, R.Q. Thomas, C. Trauernicht, D. Trejo, D. Tsirantonakis, A. Valero, A.K. Van den berg, M.K. Van der molen, R. Vargas, M. Vellend, J. Verfaillie, C.S. Vogel, A. Vrieling, J.J. Walker, J.R. Ward, D.A. Watts, N. Webb, P. Wetzel, S. Weyers, A.V. Whipple, C.W. Whippo, W.A. White, T.G. Whitham, C. Wille, A. Wingler, G. Wohlfahrt, S. Wolf, J.D. Wood, A.L. Woodley, J. Yang, X. Yang, G. Yenni, A.J. Zambrano-olimpo, A. Zandonai, Y. Zhang, and D. Zona. 2025. PhenoCam Dataset v3.0: Vegetation Phenology from Digital Camera Imagery, 2000-2023. ORNL DAAC, Oak Ridge, Tennessee, USA. https://doi.org/10.3334/ORNLDAAC/2389
Table of Contents
- Dataset Overview
- Data Characteristics
- Application and Derivation
- Quality Assessment
- Data Acquisition, Materials, and Methods
- Data Access
- References
- Dataset Revisions
Dataset Overview
This dataset provides vegetation phenological observations for 738 sites across diverse ecosystems of the world (mostly North America) from 2000 to 2023. The phenology data were derived from conventional visible-wavelength automated digital camera imagery collected through the PhenoCam Network at each site. From each acquired image, RGB (red, green, blue) color channel information was extracted and summary statistics were calculated for a region-of-interest (ROI) that delineates an area of specific vegetation type. From the high-frequency (typically, 30 minute) imagery collected over several years, time series characterizing vegetation color, including canopy greenness, plus greenness rising and greenness falling transition dates, were summarized over 1- and 3-day intervals. These data products, consisting of 4805.5 site-years of observations, can be used for phenological modeling, to evaluate satellite remote sensing data products, to understand relationships between canopy phenology and ecosystem processes, to study the seasonal changes in leaf-level physiology that are associated with changes in leaf color, for benchmarking earth system models, and for studies of climate change impacts on terrestrial ecosystems.
This version 3 dataset includes a new “simplified” data format that is designed to be more accessible for most users. It also provides time series of "camera NDVI”, summarized over 1- and 3-day intervals, for the 586 sites with cameras capable of acquiring both RGB and RGB+NIR (near infrared) imagery.
Raw images for this project are published in related dataset Ballou, K. et al. 2024.
Related Publications:
Richardson, A.D., K. Hufkens, T. Milliman, D.M. Aubrecht, M. Chen, J.M. Gray, M. R. Johnston, T.F. Keenan, S.T. Klosterman, M. Kosmala, E.K. Melaas, M.A. Friedl, and S. Frolking. 2018. Tracking vegetation phenology across diverse North American biomes using PhenoCam imagery. Scientific Data 5:180028. https://doi.org/10.1038/sdata.2018.28
Seyednasrollah, B., A.M. Young, K. Hufkens, T. Milliman, M.A. Friedl, S. Frolking, and A.D. Richardson. 2019. Tracking vegetation phenology across diverse biomes using PhenoCam imagery: The PhenoCam Dataset v2.0. Scientific Data 6:222. https://doi.org/10.1038/s41597-019-0229-9
Young, A.M., T. Milliman, K. Hufkens, K. Ballou, C. Coffey, K. Begay, M. Fell, M. Javadian, A.K. Post, C. Schädel, Z. Vladich, O. Zimmerman, D.M. Browning, C.R. Florian, M.A. Friedl, M. Moon, M.D. SanClements, B. Seyednasrollah, and A.D. Richardson. 2024. Tracking vegetation phenology across diverse biomes using PhenoCam imagery: The PhenoCam Dataset v3.0. Submitted to Earth System Science Data.
Related Datasets:
Ballou, K. et al. 2024. PhenoCam Dataset v3.0: Digital Camera Imagery from the PhenoCam Network, 2000-2023. ORNL DAAC, Oak Ridge, Tennessee, USA. https://doi.org/10.3334/ORNLDAAC/2364
- Digital images used for the vegetation phenology analysis.
Seyednasrollah, B.,et al. 2019. PhenoCam Dataset v2.0: Vegetation Phenology from Digital Camera Imagery, 2000-2018. ORNL DAAC, Oak Ridge, Tennessee, USA. https://doi.org/10.3334/ORNLDAAC/1674
- Version 2 of this dataset
Milliman, T., et al. 2019. PhenoCam Dataset v2.0: Digital Camera Imagery from the PhenoCam Network, 2000-2018. ORNL DAAC, Oak Ridge, Tennessee, USA. https://doi.org/10.3334/ORNLDAAC/1689
- Version 2 imagery
Acknowledgments:
The development of PhenoCam has been supported by the Northeastern States Research Cooperative, the National Science Foundation, the Long-Term Agroecosystem Research (LTAR) network which is supported by the United States Department of Agriculture, the National Ecological Observatory Network (NEON) program sponsored by the National Science Foundation and operated under cooperative agreement by Battelle, the U.S.Department of Energy, Oak Ridge National Laboratory managed by UT-Battelle, the U.S. National Park Service Inventory and Monitoring Program, the USA National Phenology Network, and the North Central Climate Science Center of the United States Geological Survey.
Refer to the PhenoCam Fair Use Data Policy at https://phenocam.nau.edu/webcam/fairuse_statement/.
Data Characteristics
Spatial Coverage: Multiple points mostly over North America, Europe, and other continents
Spatial Resolution: Point
Temporal Resolution: daily and three days
Temporal Coverage: 1999-12-31 to 2023-12-31
Spatial Extent: (All latitude and longitude given in decimal degrees)
| Sites | Westernmost Longitude | Easternmost Longitude | Northernmost Latitude | Southernmost Latitude |
|---|---|---|---|---|
| Global | -158.170 | 172.350 | 71.283 | -45.038 |
Data File Information
This data set holds a total of 14,284 files. It contains 738 site descriptions files (in both *.txt format and *.JSON format), 2406 region-of-interest definition (ROI) files in TIFF format, 10,401 *.csv files, including ROI index files, and time series of extracted image color and greenness transitions processed to 1- and 3-day intervals, as well as time series of "camera NDVI" at 1- and 3-day intervals, and a new "simplified" data product at 1-day interval. Site locations and basic characteristics are also included in a GeoJSON file.
The files can be organized by site (n=738) with up to 14 files per site (Table 1).
Table 1. File types and naming conventions.
| File content | Temporal aggregation | Naming convention |
|---|---|---|
| PhenoCam site descriptions | - | <sitename>_meta.json |
| - | <sitename>_meta.txt | |
| Region of interest (ROI) mask | - | <sitename>_<veg_type>_<ROI_ID>_<mask_index>.tif |
| ROI list | - | <sitename>_<veg_type>_<ROI_ID>_roi.csv |
| ROI color statistics | per image | <sitename>_<veg_type>_<ROI_ID>_roistats.csv |
| 1-day | <sitename>_<veg_type>_<ROI_ID>_1day.csv | |
| 3-day | <sitename>_<veg_type>_<ROI_ID>_3day.csv | |
| Phenological transition dates | 1-day | sitename>_<veg_type>_<ROI_ID>_1day_ transition_dates.csv |
| 3-day | <sitename>_<veg_type>_<ROI_ID>_3day_transition_dates.csv | |
| Camera NDVI statistics | per image | <site_name>_<veg_type>_<ROI_ID>_ndvi_roistats.csv |
| 1-day | <site_name>_<veg_type>_<ROI_ID>_ndvi_1day.csv | |
| 3-day | <site_name>_<<veg_type>_<ROI_ID>_ndvi_3day.csv | |
| Simplified summary color statistics | 1-day | <site_name>_<veg_type>_<ROI_ID>_simplified_1day.csv |
| Simplified transition dates | 1-day | <site_name>_<veg_type>_<ROI_ID>_simplified_transition_dates.csv |
In the file naming conventions, <sitename> is the name of each camera site, <veg_type> is a two-letter code defining the type of vegetation (Table 4), and <ROI_ID> is a unique identifier to distinguish between multiple regions of interest (ROI) of the same vegetation type for a given site. The <mask_index> is used to distinguish between multiple ROI mask files for the same site having the same veg_type and ROI_ID components.
In all files, missing data is indicated by "NA".
Data File Details
PhenoCam site descriptions
These files provide general metadata for the PhenoCam network sites included in this data set. Following general project information, site specific location, contacts, date range, and environmental and ecological characteristics are listed. Files are provide in plain text (*_meta.txt) and machine-readable JSON format (*_meta.json).
Table 2. Variables within the *meta.txt and *meta.json files.
| Variable | Units | Description |
|---|---|---|
| last_updated | YYYY-MM-DD | the date on which the site metadata were last updated |
| project | - | by default, all sites are associated with the PhenoCam Network project |
| project_url | - | the URL of the PhenoCam project web page |
| fairuse_statement | - | the general PhenoCam statement on data use, acknowledgment, and redistribution |
| project_fairuse_url | - | the URL of the PhenoCam fairuse_statement |
| sitename | - | the name of the camera site, e.g. “coweeta,” used to designate all images and products associated with that site |
| long_name | - | a more descriptive name for each camera site |
| lat | degrees_north | the latitude (in decimal degrees) of the camera itself |
| lon | degrees_east | the longitude (in decimal degrees) of the camera itself |
| elevation | m | the elevation of the ground surface (m above sea level) at the camera site |
| contact1, contact2 | - | the names and email addresses of the site representatives |
| active | - | “True” if new images from the site are still being added as of last_updated date; “False” if otherwise |
| date_start | YYYY-MM-DD | the date of the first image in the archive for this site |
| date_end | YYYY-MM-DD | the date of the most recent image as of the last_updated date |
| nimage | 1 | number of images in the archive for this site |
| site_type | - | the site class (Type I, II, or III) |
| ir_enabled | - | “Y” if the camera is capable of taking both visible and infrared (or visible+infrared) imagery |
| method | - | transfer methods to the PhenoCam server: “ftppush”= FTP: , “httppull"= pulled from an external server |
| utc_offset | h | difference between UTC time and local standard time at site |
| camera_description | - | the brand and model of the camera being used |
| camera_orientation | - | the compass direction in which the camera is pointing |
| group | - | a number of camera sub-networks |
| flux_data | - | “True” if eddy covariance flux measurements are being (or have been) made at the site |
| flux_networks | - | name of flux network if the site belongs to a network (e.g., AmeriFlux, Fluxnet-Canada) |
| flux_sitenames | - | site code (e.g., FLUXNET, AmeriFlux), if applicable |
| ecoregion | - | numeric code identifying the site’s EPA Ecoregion |
| MAP_site | mm | mean annual precipitation as reported by site personnel |
| MAP_daymet | mm | mean annual precipitation from the Daymet |
| MAP_worldclim | mm | mean annual precipitation from WorldClim |
| MAT_site | degree_C | mean annual temperature as reported by site personnel |
| MAT_daymet | degree_C | mean annual temperature from the Daymet |
| MAT_worldclim | degree_C | mean annual temperature from WorldClim |
| primary_veg_type | - | the dominant vegetation type at the site |
| secondary_veg | - | secondary vegetation type at the site |
| dominant_species | - | Latin binomials for the dominant species at each site, as reported by site personnel |
| landcover_igbp | - | numeric code corresponding to the land cover classification scheme of the International Geosphere-Biosphere Programme, derived from MODIS imagery (Friedl et al., 2010; Channan et al., 2014) |
| wwf_biome | - | numeric code corresponding to the biome classification scheme of the World Wildlife Fund (Olson et al., 2001) |
| koeppen_geiger | - | climate classification according to the Köppen-Geiger system (Kottek et al, 2006) |
| site_acknowledgments | - | data end users are asked to include this text, which has been provided by site collaborators, in publications and presentations that make use of data for this site |
Region of interest (ROI) mask and ROI list
For each camera, a region of interest (ROI) was identified in the image scene that depicted a relatively uniform vegetation type. The "ROI mask" file is a binary image mask in 8-bit TIF image format (*.tif) that identifies the pixels over which the image analysis was conducted. The black region of these TIF files denotes the ROI; white regions were excluded from calculations.
The “ROI list files” list the date and time range over which each binary image mask was applied in processing the image data for a site. With ROI mask and ROI list files, the data presented in the *_roistats.csv data files can be reproduced from the original image files.
In the ROI list files, the first 13 lines (beginning with #), document the provenance of the ROI list, and contain a brief description of the vegetation that is delineated by the associated image masks. Line 14 lists the column headers for the mask entry rows.
Table 3. Variables in the <sitename>_<veg_type>_<ROI_ID>_roi.csv files.
| Variable | Units | Description |
|---|---|---|
| start_date | YYYY-MM-DD | date of the first image in the archive for this site |
| start_time | hh:mm:ss | time of capture of the first image for this site |
| end_date | YYYY-MM-DD | date of the most recent image as of the last_updated date. The date code "9999-12-31" was used to keep the processing open-ended |
| end_time | hh:mm:ss | time of capture of the most recent image for this site |
| mask_file | - | filename for the mask file with black for the ROI and white for pixel to exclude from calculations |
| sample_image | - | filename for a sample image in the date range |
Table 4. Vegetation type abbreviations for ROIs (region of interests). With sites with multiple ROIs, each ROI contributed to the site-years value. Number of sites is the unique combination of ROI by site.
| Abbreviation | Description | Site-years | Number of sites |
|---|---|---|---|
| AG | agriculture | 703.5 | 161 |
| DB | deciduous broadleaf | 1185.2 | 171 |
| DN | deciduous needleleaf | 115.3 | 13 |
| EB | evergreen broadleaf | 101.8 | 22 |
| EN | evergreen needleleaf | 778 | 122 |
| GR | grassland | 912.4 | 188 |
| MX | mixed vegetation | 13.7 | 2 |
| NV | non-vegetated | 17.2 | 3 |
| RF | non-vegetated | 2.7 | 1 |
| SH | shrubs | 436.8 | 86 |
| TN | tundra | 117 | 20 |
| UN | forest understory | 219.2 | 41 |
| WL | wetland | 202.7 | 39 |
| Total | 4805.5 | 869 | |
ROI color statistics (*_roistats.csv)
These files contain the high-frequency (typically, 30 minute) color information extracted from the entire image archive for each site, using the ROI list files and ROI mask files. For each archived image, RGB (red, green, blue) color channel information was extracted for the ROI then means and other statistics were calculated for each channel. From the high-frequency (typically, 30 minute) imagery, time series characterizing vegetation color, including “canopy greenness” (Gcc), are included. The time series have not been filtered, and each data row in the file corresponds to an individual image in the archive.
In the files, the first 17 lines (beginning with #) contain basic metadata:
- Line 4 contains the sitename, identical to that in the filename.
- Lines 5 (veg_type) and 6 (ROI_ID_number) identify the vegetation type and the ROI_ID from the ROI list files.
- Lines 7-9 are site location (latitude and longitude in decimal degrees, and elevation in m above sea level.
- Line 10 is the UTC offset. [Lines 4-10 were extracted from the site metadata text files.]
- Line 11 indicates whether images have been re- resized to common dimensions (to match the size of the mask file) prior to analysis.
- Line 12 indicates the version of the data set.
- Lines 13-16 document the provenance of the data file.
- Line 18 lists the column headers for the data rows, and the data rows begin on line 19 with each data row corresponding to results for an individual image in the archive.
Table 5. Variables in the <sitename>_<veg_type>_<ROI_ID>_roistats.csv files.
| Variable | Units | Description |
|---|---|---|
| date | YYYY-MM-DD | local date |
| local_std_time | hh:mm:ss | local standard time |
| doy | d | day of year |
| filename | - | image filename |
| solar_elev | degrees | solar elevation angle |
| exposure | - | image exposure |
| mask_index | 1 | mask number in the image mask sequence |
| gcc | 1 | mean green chromatic coordinate (Gcc) over the ROI |
| rcc | 1 | mean red chromatic coordinate (Rcc) over the ROI |
| r_mean | 1 | mean red channel digital number (DN) over the ROI |
| r_std | 1 | standard deviation (across pixels) of red channel DN over the ROI |
| b_mean | 1 | mean blue channel DN over the ROI |
| b_std | 1 | standard deviation (across pixels) of blue channel DN over the ROI |
| g_mean | 1 | mean green channel DN over the ROI |
| g_std | 1 | standard deviation (across pixels) of green channel DN over the ROI |
| r_5_qtl | 1 | the 5th quantile values (across pixels) of the red channel DN over the ROI |
| r_10_qtl | 1 | the 10th quantile values (across pixels) of the red channel DN over the ROI |
| r_25_qtl | 1 | the 25th quantile values (across pixels) of the red channel DN over the ROI |
| r_50_qtl | 1 | the 50th quantile values (across pixels) of the red channel DN over the ROI |
| r_75_qtl | 1 | the 75th quantile values (across pixels) of the red channel DN over the ROI |
| r_90_qtl | 1 | the 90th quantile values (across pixels) of the red channel DN over the ROI |
| r_95_qtl | 1 | the 95th quantile values (across pixels) of the red channel DN over the ROI |
| b_5_qtl | 1 | the 5th quantile values (across pixels) of the blue channel DN over the ROI |
| b_10_qtl | 1 | the 10th quantile values (across pixels) of the blue channel DN over the ROI |
| b_25_qtl | 1 | the 25th quantile values (across pixels) of the blue channel DN over the ROI |
| b_50_qtl | 1 | the 50th quantile values (across pixels) of the blue channel DN over the ROI |
| b_75_qtl | 1 | the 75th quantile values (across pixels) of the blue channel DN over the ROI |
| b_90_qtl | 1 | the 90th quantile values (across pixels) of the blue channel DN over the ROI |
| b_95_qtl | 1 | the 95th quantile values (across pixels) of the blue channel DN over the ROI |
| g_5_qtl | 1 | the 5th quantile values (across pixels) of the green channel DN over the ROI |
| g_10_qtl | 1 | the 10th quantile values (across pixels) of the green channel DN over the ROI |
| g_25_qtl | 1 | the 25th quantile values (across pixels) of the green channel DN over the ROI |
| g_50_qtl | 1 | the 50th quantile values (across pixels) of the green channel DN over the ROI |
| g_75_qtl | 1 | the 75th quantile values (across pixels) of the green channel DN over the ROI |
| g_90_qtl | 1 | the 90th quantile values (across pixels) of the green channel DN over the ROI |
| g_95_qtl | 1 | the 95th quantile values (across pixels) of the green channel DN over the ROI |
| r_g_cor | 1 | correlation coefficient (across pixels) between red channel DN and green channel DN, over the ROI |
| g_b_cor | 1 | correlation coefficient between green channel DN and blue channel DN, over the ROI |
| b_r_cor | 1 | correlation coefficient between blue channel DN and red channel DN, over the ROI |
ROI color statistics: 1-day and 3-day summaries (*1_day.csv, *_3day.csv)
These files contain the daily summaries of time series data characterizing vegetation color, including “canopy greenness” for each site. From the high-frequency (typically, 30 minute) imagery, time series characterizing vegetation color, including “canopy greenness” was processed to 1-day intervals.
Although the latest date for acquired images is 2023-12-31, values for "smooth" variables may extend to 2024-03-03. These values were generated by interpolation using a smoothing function fitted to data from previous years; they are marked as interpolated by the int_flag variable.
For 1- day summary product files, the first 24 lines (beginning with #) contain basic metadata.
- Lines 4 through 10 are identical to those in *_roi.csv.
- Line 11 is not used in this dataset but allows for the specification of an image count threshold for processing to occur (i.e., if for a given period of aggregation, there are insufficient images available, then only results for the midday image, if applicable, would be reported).
- Line 12 gives the number of days that have been aggregated in producing the file" "1" for 1-day files; "3" for 3-day files.
- Line 13 reports the solar elevation filter that was used in processing (10° in the current data set).
- Lines 14 and 15 are not used in the data sets but allows for the specification of time-of-day window (i.e., images outside of the window would be excluded from the processing).
- Lines 16 and 17 report the values that were used for the “too dark” and “too bright” quality control filters, which are by default set to DN 100 and 665, respectively.
- Lines 18-23 document the provenance of the data file.
- Line 25 lists the column headers for the data rows, and the data begins on line 26..
Table 6. Variables in the <sitename>_<veg_type>_<ROI_ID>_1day.csv and <sitename>_<veg_type>_<ROI_ID>_3day.csv files.
| Variable | Units | Description |
|---|---|---|
| date | YYYY-MM-DD | local date at the middle of the aggregation period (1-day) |
| year | YYYY | calendar year of the above date |
| doy | d | day of year for the above date |
| image_count | 1 | the number of images passing the selection criteria |
| midday_filename | - | the filename of the image which is closest to 12 noon |
| midday_r | 1 | mean red channel digital number (DN) over the ROI, for the midday image |
| midday_g | 1 | mean green channel DN over the ROI, for the midday image |
| midday_b | 1 | mean blue channel DN over the ROI, for the midday image |
| midday_gcc | 1 | the mean Gcc over the ROI, for the midday image |
| midday_rcc | 1 | the mean Rcc over the ROI, for the midday image |
| r_mean | 1 | the mean value (for all images passing the selection criteria) of the mean (by image) red channel DN over the ROI |
| r_std | 1 | the standard deviation (for all images passing the selection criteria) of the mean (by image) red channel DN over the ROI |
| g_mean | 1 | the mean value (for all images passing the selection criteria) of the mean (by image) green channel DN over the ROI |
| g_std | 1 | the standard deviation (for all images passing the selection criteria) of the mean (by image) green channel DN over the ROI |
| b_mean | 1 | the mean value (for all images passing the selection criteria) of the mean (by image) blue channel DN over the ROI |
| b_std | 1 | the standard deviation (for all images passing the selection criteria) of the mean (by image) blue channel DN over the ROI |
| gcc_mean | 1 | the mean value (for all images passing the selection criteria) of the mean (by image) Gcc over the ROI |
| gcc_std | 1 | the standard deviation (for all images passing the selection criteria) of the mean (by image) Gcc over the ROI |
| gcc_50, gcc_75, gcc_90 | 1 | the 50th, 75th and 90th quantiles (for all images passing the selection criteria) of the mean (by image) Gcc over the ROI |
| rcc_mean, rcc_std, rcc_50, rcc_75, rcc_90 | 1 | the 50th, 75th and 90th quantiles (for all images passing the selection criteria) of the mean (by image) RGcc over the ROI |
| max_solar_elev | degrees | the maximum solar elevation angle for all images passing the selection criteria |
| snowflag | 1 | not included in this release |
| outlierflag_gcc_mean, outlierflag_gcc_50; outlierflag_gcc_75, outlierflag_gcc_90 | 1 | the outlierflag, which is determined separately for the gcc_mean, gcc_50, gcc_75, and gcc_90 time series, can either take on a value of 0 (indicating good data), or 1 (indicating an outlier) |
| smooth_gcc_mean, smooth_gcc_50, smooth_gcc_75, smooth_gcc_90 | 1 | the smoothed and/or interpolated value of Gcc from the final iteration (i.e. with outliers removed) of the spline fitting process |
| smooth_rcc_mean, smooth_rcc_50, smooth_rcc_75, smooth_rcc_90 | 1 | the smoothed and/or interpolated value of Rcc from the final iteration (i.e. with outliers removed) of the spline fitting process |
| smooth_ci_gcc_mean, smooth_ci_gcc_50, smooth_ci_gcc_75, smooth_ci_gcc_90 | 1 | the (one-sided) width of the 95% confidence interval around the smoothed Gcc values |
| smooth_ci_rcc_mean, smooth_ci_rcc_50, smooth_ci_rcc_75, smooth_ci_rcc_90 | 1 | the (one-sided) width of the 95% confidence interval around the smoothed Rcc values |
| int_flag | - | interpolation flag is set to "1" during a gap of 14 days or more; otherwise" NA" |
Phenological transition dates
These files contain estimates of the transition date for the start of each “greenness rising” stage and end of each “greenness falling” stage, derived from the ROI color statistics 1-day and 3-day summary data.
File description for transition date files:
- The first 16 lines (beginning with #) contain basic metadata.
- Lines 4 through 6 are identical to those in the summary product file from which the transition date file is derived.
- Line 7 gives the number of days that have been aggregated in producing the file, which is either 1 day or 3 days.
- Lines 8 and 9 define the first and last years for which the transition dates are calculated.
- Lines 10 and 11 document the provenance of the data file.
- Lines 12-15 report goodness-of-fit statistics (in terms of RMSE, the root mean squared error) for the spline curves from which the transition dates are extracted.
- Line 17 lists the column headers for the data rows.
- The data rows begin on line 18. Each data row corresponds to a single “greenness rising” or “greenness falling” stage.
Table 7. Variables in <sitename>_<veg_type>_<ROI_ID>_1day_ transition_dates.csv and <sitename>_<veg_type>_<ROI_ID>_3day_transition_dates.csv files
| Variable | Units | Description |
|---|---|---|
| sitename | - | the name of the camera site |
| veg_type | - | a two-letter abbreviation identifying the dominant vegetation within the ROI |
| roi_id | 1 | a numeric code (ROI_ID_number) to distinguish between multiple ROIs of the same vegetation type at a given site |
| direction | - | indicates whether the transition dates correspond to a “greenness rising” or “greenness falling” stage. Note: there may be more than one rising/falling cycle per calendar year, and a single rising or falling stage may cut across years. |
| gcc_value | indicates the variable used to calculate transition dates: gcc_mean, gcc_50, gcc_75 or gcc_90 time series | |
| transition_10, transition_25, transition_50 | YYYY-MM-DD | transition dates for each “greenness rising” or “greenness falling” stage, corresponding to 10%, 25% and 50% of the Gcc amplitude of that stage |
| transition_10_lower_ci, transition_25_lower_ci, transition_50_lower_ci, transition_10_upper_ci, transition_25_upper_ci, transition_50_upper_ci | YYYY-MM-DD | dates corresponding to the lower and upper 95% confidence intervals on the 10%, 25%, and 50% of the Gcc amplitude |
| threshold_10, threshold_25, threshold_50 | 1 | the threshold values of Gcc used to identify transition dates |
| min_gcc, max_gcc | 1 | the baseline (dormant-season minimum) and peak (active-season maximum) Gcc values, calculated from the fitted spline, as used to derive the Gcc amplitude |
Camera NDVI statistics (*_ndvi_roistats.csv, *_ndvi_1day.csv, * _ndvi_3day.csv)
These data files contain derived data and metadata used to calculate cameraNDVI. There are two distinct data file types. The <site_name>_<vegetation_type>_<ROI>_ndvi_roistats.csv files hold statistics for PhenoCam Camera NDVI ROI (RGB/IR Image Pair). The <site_name>_<vegetation_type>_<ROI>_ndvi_1day.csv (or *_ndvi_3day.csv) files hold 1-day and 3-day NDVI summaries.
The “image pair statistics files,” the files are formatted as follows.
- The first 17 lines (beginning with #) contain basic metadata:
- Line 4 contains the sitename, identical to that in the filename.
- Lines 5 (veg_type) and 6 (ROI_ID_number) identify the vegetation type and the ROI_ID from the ROI list files.
- Lines 7-9 are site location (latitude and longitude in decimal degrees, and elevation in m above sea level.
- Line 10 is the UTC offset. [Lines 4-10 were extracted from the site metadata text files.]
- Line 11 indicates whether images have been re- resized to common dimensions (to match the size of the mask file) prior to analysis.
- Line 12 indicates the version of the data set.
- Lines 13-16 document the provenance of the data file.
- Line 18 lists the column headers for the data rows.
- The data begin on line 19 with each data row corresponding to results for a specific pair of RGB and RGB+IR in the archive.
Table 8. Variables in the <site_name>_<veg_type>_<ROI>_ndvi_roistats.csv
| Variable | Units | Description |
|---|---|---|
| date | YYYY-MM-DD | local date for image |
| local_std_time | hh:mm:ss | local standard time |
| doy | 1 | day of year |
| filename_rgb | - | RGB filename |
| filename_ir | - | IR filename |
| solar_elev | degrees | solar elevation angle |
| exposure_rgb | 1 | exposure of RGB image |
| exposure_ir | 1 | exposure of IR image |
| mask_index | 1 | index into mask list |
| r_mean | 1 | mean red digital number (DN) over the ROI |
| g_mean | 1 | mean green DN over the ROI |
| b_mean | 1 | mean blue DN over the ROI |
| ir_mean | 1 | mean DN over the ROI from the IR image |
| ir_std | 1 | standard deviation of DN over the ROI from the IR image |
| ir_5_qtl, ir_10_qtl, …, ir_90_qtl, ir_95_qtl | 1 | the 5, 10,..., 90, 95 quantile values of the DN values over the ROI |
| Y, Z_prime, R_prime, Y_prime, X_prime | 1 | intermediate values for camera NDVI calculation |
| NDVI_c | 1 | camera NDVI as calculated in Petach et al. (2014) |
For the “1-day and 3-day NDVI Summary Files”, the files are formatted as follows.
- Lines 4 through 10 are identical to those in the all-image time series file from which the summary product files are derived.
- Line 11 is not used in the data sets but allows for the specification of an image count threshold for processing to occur (i.e., if for a given period of aggregation, there are insufficient images available, then only results for the midday image, if applicable, would be reported).
- Line 12 gives the number of days that have been aggregated in producing the file, which is 1 or 3 days.
- Line 13 reports the solar elevation filter that was used in processing (10° in the current data set).
- Lines 14 and 15 are not used in the data sets but allows for the specification of time-of-day window (i.e., images outside of the window would be excluded from the processing).
- Lines 16 and 17 report the values that were used for the “too dark” and “too bright” quality control filters, which are by default set to DN 100 and 665, respectively.
- Lines 18-21 document the provenance of the data file.
- Line 23 lists the column headers for the data rows, and the data rows begin on line 24.
Table 9. Variables in the <site_name>_<veg_type>_<ROI>_ndvi_1day.csv or *_ndvi_3day.csv files.
| Variable | Units | Description |
|---|---|---|
| date | YYYY-MM-DD | local date of middle of aggregation period (1-day or 3-day) |
| doy | d | doy for this date |
| image_count | 1 | number of images passing the selection criteria |
| midday_rgb_filename | - | filename for the RGB image which is closest to noon (midday image) on the middle day of summary period |
| midday_ir_filename | - | filename for the IR image which is closest to noon (midday image) on the middle day of summary period |
| midday_ndvi | 1 | mean NDVI over ROI for the midday image |
| gcc_90 | 1 | 90th percentile Gcc value for all the image pairs passing the selection criteria |
| ndvi_mean | 1 | mean NDVI value for all the image pairs passing the selection criteria |
| ndvi_std | 1 | standard deviation of NDVI values for all the image pairs passing the selection criteria |
| ndvi_50, ndvi_75, ndvi_90 | 1 | 50th, 75th, and 90th percentiles of NDVI values |
| max_solar_elev | degrees | maximum solar elevation for the images from this day |
| snow_flag | - | not included in this release |
| outlierflag_ndvi_mean | - | outlier flag for NDVI mean value (1=outlier) [not included in this release] |
| outlierflag_ndvi_50 | - | outlier flag for NDVI 50th percentile value (1=outlier) [not included in this release] |
| outlierflag_ndvi_75 | - | outlier flag for NDVI 75th percentile value (1=outlier) [not included in this release] |
| outlierflag_ndvi_90 | - | outlier flag for NDVI 90th percentile value (1=outlier) [not included in this release] |
Simplified data files
These data files contain highly simplified data and derived data products. There are two file types in this data record: The <sitename>_<veg_type>_ROI_ID_number>_simplified_1day.csv files are "Simplified Daily Summary Files” that report the aggregated statistics for Gcc_mean at a 1-day aggregation period.
The <sitename>_<veg_type>_ROI_ID_number>_simplified_transition_dates.csv) are "Simplified Transition Date Files” that report transition dates for Gcc_mean, extracted from the 1-day transition dates. Unlike other data records, the simplified data records do not include metadata, and data are only reported 1-day time step.
Table 10. Variables in the <sitename>_<veg_type>_<ROI_IDr>_simplified_1day.csv files.
| Variable | Units | Description |
|---|---|---|
| date | YYYY-MM-DD | local date |
| gcc_mean | 1 | mean daily Gcc value from <site>_*_1day.csv file |
| smooth_gcc_mean | 1 | smoothed value of Gcc from the optimized spline, from <site>_*_1day.csv file |
Table 11. Variables in the <sitename>_<veg_type>_<ROI_ID>_simplified_transition_dates.csv files.
| Variable | Units | Description |
|---|---|---|
| year | YYYY | year in which the transition occurred (YYYY) |
| direction | - | indicates whether the date corresponds to a “greenness rising” or “greenness falling” stage. Note: there may be more than one rising/falling cycle per calendar year, and a single rising or falling stage may cut across years. |
| date_10, date_25, date_50 | YYYY-MM-DD | transition dates for each “greenness rising” or “greenness falling” stage, corresponding to 10%, 25% and 50% of the Gcc amplitude of that stage. |
| DOY_10, DOY_25, DOY_50 | d | day-of-year values corresponding to the calendar date transitions |
PhenoCam site locations
The locations of PhenoCam sites are included as point locations in a GeoJSON file: phenocam_sites_v3.geojson. Site locations are duplicated if there are >1 ROI at the site.
Table 12: Point attributes for PhenoCam locations in phenocam_sites_v3.geojson.
| Attribute | Units | Description |
|---|---|---|
| sitename | - | name of the camera site, e.g. “coweeta,” used to designate all images and products associated with that site |
| veg_type | - | dominant vegetation type for the ROI |
| roi_id | - | unique identifier to distinguish between multiple ROIs of the same vegetation type for a given site |
| start_date | YYYY-MM-DD | the date of the first image in the archive for this site |
| end_date | YYYY-MM-DD | the date of the most recent image as of the last_updated date |
| days | d | cumulative number of days of activity |
| site_years | y | number of years of activity |
| description | - | description of site conditions |
| ecoregion | - | numeric code identifying the site’s EPA Ecoregion |
| koeppen_geiger | - | climate classification according to the Köppen-Geiger system (Kottek et al, 2006) |
| landcover_igbp | - | numeric code corresponding to the land cover classification scheme of the International Geosphere-Biosphere Programme (Friedl et al., 2010; Channan et al., 2014) |
| elev | m | elevation of the ground surface (m above sea level) at the camera site |
| MAT_site | degree_C | mean annual temperature as reported by site personnel |
| MAP_site | mm | mean annual precipitation as reported by site personnel |
| lat | degrees_north | the latitude (in decimal degrees) of the camera itself |
| lon | degrees_east | the longitude (in decimal degrees) of the camera itself |
Application and Derivation
Data derived from PhenoCam imageries can be used for phenological model validation and development, evaluation of satellite remote sensing data products, understanding relationships between canopy phenology and ecosystem processes, studies of the seasonal changes in leaf-level physiology associated with changes in leaf color, benchmarking earth system models, and studies of climate change impacts on terrestrial ecosystems (Richardson et al., 2018).
Quality Assessment
Quality assurance was conducted by quantitative analysis through automated quality control routines (e.g. filtering and outlier detection) and a visual evaluation of each time series to examine consistency and overall quality (Richardson et al., 2018; Seyednasrollah et al. 2019; Young et al., 2024).
Data Acquisition, Materials, and Methods
PhenoCam Network
The PhenoCam network is a cooperative network, established in 2008 and uses digital camera imagery to monitor ecosystem dynamics over time. It serves as a long-term, continental-scale, phenological observatory with cameras deployed within North America, Europe, and other continents. This dataset includes sites from 30 countries (Figure 2).
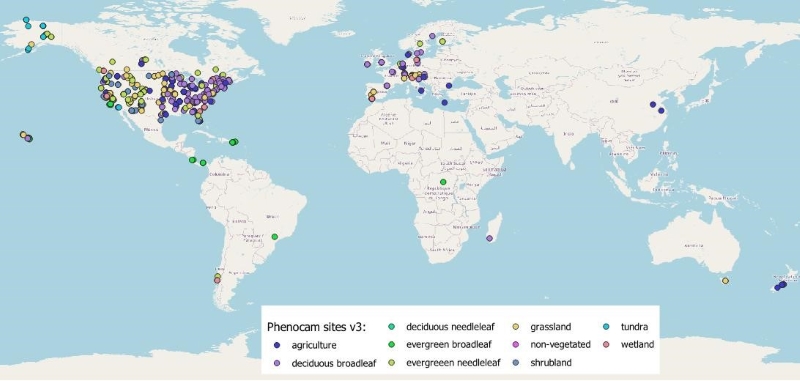
Figure 2. Global distribution of PhenoCam sites represented in this dataset. There are 638 sites in North America, 85 in Europe, 7 in Oceania, 4 in South America, 2 in Africa, and 2 in Asia.
This dataset was derived from conventional, visible-wavelength, automated digital camera imagery from 738 camera sites, together totaling 4805.5 years of data across different ecoregions, climate zones, and vegetation types. Vegetation types such as deciduous broadleaf forests, grasslands, evergreen needleleaf forests, and agriculture are the best-represented (Table 4). Raw imagery is available in Ballou et al. (2024).
For each archived image, summary statistics for RGB (red, green, blue) color channels were calculated across a region-of-interest (ROI) delineating a specific vegetation type. From the high-frequency (typically, 30 minute) imagery, time series characterizing vegetation color, including canopy greenness (canopy greenness index -- the green chromatic coordinate, Gcc) and red chromatic coordinate (Rcc) were derived for 1- and 3-day intervals. For ecosystems with one or more annual cycles of vegetation activity, the start of the “greenness rising” and end of the “greenness falling” stages is provided. A “cameraNDVI” time series was derived from visible and visible+NIR imagery collected from the majority of cameras (see Petach et al., 2014). In addition, a new set of simplified data products are included that will be easier for most users to use (see Young et al., 2024).
Every night, any new images uploaded to the PhenoCam data server during the previous 24 hours were processed and analysed as described in Richardson et al. (2018).
Image analysis and data processing
Image analysis consists of several steps. First, an appropriate “region of interest” (ROI) is defined, corresponding to the area within each digital image for which color information will be extracted (e.g., Figure 1). The ROIs characterize the dominant vegetation type in that portion of each image. For sites where more than one vegetation type could be clearly identified, secondary ROIs are selected. The ROI coordinate definitions were stored, in TIFF format, as a series of binary image masks, which comprise an ROI’s “mask sequence”. For each ROI mask sequence at each site, an “ROI list” file details the date and time range over which each mask was applied.
The digital cameras recorded JPEG images with color information stored in three separate layers (red, green, and blue; RGB). According to the standard additive color model, representation of any given color in the visible range is achieved by varying the intensity (pixel value) of these primary colors. Thus, each pixel in the image is associated with a digital number (“DN”) triplet, with each element in the triplet corresponding to the intensity of one of the three color layers. Therefore, the second step in the image analysis was to read in the images and associated mask sequence, and to characterize the frequency distribution of the RGB DN triplets across the mask. This second step was done separately for each ROI at each site, to produce the “ROI color statistics” time series data files.
The frequency distribution of the RGB DN triplets across the mask was characterized on a channel-by-channel basis, and also in terms of the pairwise correlation of DN values between color channels. Thus, for each of the red, green and blue color channels, the mean and standard deviation, as well as the 5th, 10th, 25th, 50th, 75th, 90th, and 95th quantiles, of the DN distribution across all pixels in the ROI was determined. Similarly, distributional statistics were calculated for Gcc and Rcc.
For each image, the date and local time were extracted from the image file name. In addition, the solar elevation angle based on the date and local time stamp, using standard formulas was calculated.
The Complementary Metal Oxide Semiconductor (CMOS) imaging sensor within network-enabled digital cameras is sensitive to near infrared (NIR) wavelengths, and the cut filter used to block wavelengths ≥700 nm for standard visible-wavelength (RGB) images is software controlled. With the filter removed, the camera records an RGB+NIR image (Petach et al., 2014). The original intent of this design was to enhance photon capture under low-light conditions and to permit nighttime security monitoring with an infrared illuminator. However, it has the potential for the camera to serve as a four-channel imager (red, green, blue, and NIR) — enabling calculation of a “camera NDVI” (normalized difference vegetation index) from digital numbers and exposure values (Petach et al 2014), similar to the standard NDVI calculated using reflectances. For additional information, see Young et al. (2024).
Transition Date Estimation
Using an approach similar to the “spline interpolation” method that has been previously applied to PhenoCam data, phenophase transition dates for each ROI mask sequence were extracted. These were intended to define the start of the “greenness rising” and end of the “greenness falling” stage for a full cycle of vegetation activity (i.e., from dormancy, through green-up or “greenness rising”, peak activity, senescence or “greenness falling”, and back to dormancy). The transition dates are reported only for the Gcc time series and not for camera NDVI.
See Richardson et al. (2018) and Young et al. (2024) for more details about the PhenoCam project and related analyses.
Data Access
These data are available through the Oak Ridge National Laboratory (ORNL) Distributed Active Archive Center (DAAC).
PhenoCam Dataset v3.0: Vegetation Phenology from Digital Camera Imagery, 2000-2023
Contact for Data Center Access Information:
- E-mail: uso@daac.ornl.gov
- Telephone: +1 (865) 241-3952
References
Ballou, K., Z. Vladich, A.M. Young, T. Milliman, K. Hufkens, C. Coffey, K. Begay, M. Fell, M. Javadian, A.K. Post, C. Schadel, O. Zimmerman, D.M. Browning, C.R. Florian, M.A. Friedl, M. Moon, M.D. SanClements, B. Seyednasrollah, A.D. Richardson, M. Abraha, D.W. Allen, M. Apple, M.A. Arain, A.C. Axel, P.H.J. Badiou, M. Bahn, J. Baker, D. Baldocchi, S.L.J. Bayliss, N. Behrens, C.M. Beier, C.J. Bernacchi, D. Berveiller, J. Bhattacharjee, S.C. Biraud, J.J. Blais, P. Blanken, M. Bonfim, D.D. Bosch, R. Boughton, E.H. Boughton, R.F. Brown, N. Brunsell, S.P. Burns, M.S. Carbone, B.R. Carlson, A. Carrara, M. Cavagna, W.S. Chan, J. Chen, A. Christen, N. Chrysoulakis, H. Chu, P.E. Clark, B.J. Conrad, M.R. Cortese, R.M. Crandall, E. Cremonese, H. Crepaz, F.W. Davis, D. Debinski, A.R. Desai, M. Detto, R. Diaz-Delgado, L. Duchesne, A.L. Dunn, K.J. Easterday, D.M. Eissenstat, T. El-Madany, D.S.S. Ellum, S.K.M. Ernest, A. Esposito, E.S. Euskirchen, L. Fenstermaker, L.F. Filchev, J.M. Fill, L.B. Flanagan, B. Forsythe, J.M. Frank, A.L. Freestone, J. Gallagher, M.B. Garcia, D. Garcia-diaz, M. Gharun, D. Gianelle, J.M. Gonet, S.C. Goslee, T. Griffis, P. Groffman, L. Gu, J. Guillemot, I.M. Halm, M. Halpin, A. Hammerle, C.V. Hanson, P.J. Hanson, Z. Harlow, K.M. Hart, C.E. Hatch, P.L. Heinrich, D. Hemming, M. Heskel, A.C. Hill, A.A. Hove, T. Hubner, D. Hui, E.R. Humphreys, P.C. Inkenbrandt, A. Jaimes-Hernandez, R. Jensen, B.G. Johnson, J.M.F. Johnson, L.S.K. Joseph, E. Keel, V.R. Kelly, K.W. King, J.W. Kirchner, P.B. Kirchner, M.A. Kline, S.H. Knox, M. Krassovski, K.L. Ladig, P.E. Laerke, O. Langvall, N.K. Lany, G. Lanthier, G. le Maire, H. Liu, Y.P. Luo, R.L. Jiménez, A. Manco, J. Marrs, T.A. Martin, M. Mauritz, G. McCarty, B. McNeil, F. Meier, M. Mensinger, G.A. Meyer, M. Migliavacca, T. Miura, B.P. Mohanty, C.E. Moore, R. Mudd, J.W. Munger, Z.E. Murrell, Z. Nesic, H.S. Neufeld, J. Norris, J. O'Connell, T.L. O'Halloran, W. Oechel, A.C. Oishi, B. Oryan, W.W. Oswald, D.M.P. Peltier, J. Perez-Quezada, T.D. Perkins, C. Phillips, M. Pizarro, D. Poursanidis, J.W.M. Pullens, P. Ramanamandimby, M.P. Rao, R.L. Ray, M.L. Reba, C. Redmond, A. Reinmann, D.A. Roberts, G.P. Robertson, M. Rodriguez-Caton, K. Rumora, B.C. Rundquist, B.R.K. Runkle, T. Sachs, E.J. Sadler, A. Saha, N.Z. Saliendra, T.S. Sankey, H. Scheifinger, L. Schmalbeck, M.R. Schuppenhauer, M.D. Schwartz, R.L. Scott, S.D. Sebestyen, D. Smale, E.M. Smith, J. Smith, O. Sonnentag, P. Stoy, S. Strachan, K. Suvocarev, D. Szutu, F. Tekinay, J.E. Thom, R.Q. Thomas, C. Trauernicht, D. Trejo, D. Tsirantonakis, A. Valero, A.K. Van den berg, M.K. Van der molen, R. Vargas, M. Vellend, J. Verfaillie, C.S. Vogel, A. Vrieling, J.J. Walker, J.R. Ward, D.A. Watts, N. Webb, P. Wetzel, S. Weyers, A.V. Whipple, C.W. Whippo, W.A. White, T.G. Whitham, C. Wille, A. Wingler, G. Wohlfahrt, S. Wolf, J.D. Wood, A.L. Woodley, J. Yang, X. Yang, G. Yenni, A.J. Zambrano-olimpo, A. Zandonai, Y. Zhang, and D. Zona. 2025. PhenoCam Dataset v3.0: Digital Camera Imagery from the PhenoCam Network, 2000-2023. ORNL DAAC, Oak Ridge, Tennessee, USA. https://doi.org/10.3334/ORNLDAAC/2364
Channan, S., K. Collins, and W.R. Emanuel. 2014. Global mosaics of the standard MODIS land cover type data. University of Maryland and the Pacific Northwest National Laboratory, College Park, Maryland, USA<, 30.
Friedl, M.A., D. Sulla-Menashe, B. Tan, A. Schneider, N. Ramankutty, A. Sibley, and X. Huang. 2010. MODIS Collection 5 global land cover: Algorithm refinements and characterization of new datasets. Remote Sensing of Environment 114:168-182. https://doi.org/10.1016/j.rse.2009.08.016
Kottek, M., Grieser, J., Beck, C., Rudolf, B. and Rubel, F., 2006. World map of the Köppen-Geiger climate classification updated. Meteorologische Zeitschrift 15:259-263. https://doi.org/10.1127/0941-2948/2006/0130
Milliman, T., B. Seyednasrollah, A.M. Young, K. Hufkens, M.A. Friedl, S. Frolking, A.D. Richardson, M. Abraha, D.W. Allen, M. Apple, M.A. Arain, J.M. Baker, D. Baldocchi, C.J. Bernacchi, J. Bhattacharjee, P. Blanken, D.D. Bosch, R. Boughton, E.H. Boughton, R.F. Brown, D.M. Browning, N. Brunsell, S.P. Burns, M. Cavagna, H. Chu, P.E. Clark, B.J. Conrad, E. Cremonese, D. Debinski, A.R. Desai, R. Diaz-Delgado, L. Duchesne, A.L. Dunn, D.M. Eissenstat, T. El-Madany, D.S.S. Ellum, S.M. Ernest, A. Esposito, L. Fenstermaker, L.B. Flanagan, B. Forsythe, J. Gallagher, D. Gianelle, T. Griffis, P. Groffman, L. Gu, J. Guillemot, M. Halpin, P.J. Hanson, D. Hemming, A.A. Hove, E.R. Humphreys, A. Jaimes-Hernandez, A.A. Jaradat, J. Johnson, E. Keel, V.R. Kelly, J.W. Kirchner, P.B. Kirchner, M. Knapp, M. Krassovski, O. Langvall, G. Lanthier, G.l. Maire, E. Magliulo, T.A. Martin, B. McNeil, G.A. Meyer, M. Migliavacca, B.P. Mohanty, C.E. Moore, R. Mudd, J.W. Munger, Z.E. Murrell, Z. Nesic, H.S. Neufeld, W. Oechel, A.C. Oishi, W.W. Oswald, T.D. Perkins, M.L. Reba, B. Rundquist, B.R. Runkle, E.S. Russell, E.J. Sadler, A. Saha, N.Z. Saliendra, L. Schmalbeck, M.D. Schwartz, R.L. Scott, E.M. Smith, O. Sonnentag, P. Stoy, S. Strachan, K. Suvocarev, J.E. Thom, R.Q. Thomas, A.K. Van den berg, R. Vargas, J. Verfaillie, C.S. Vogel, J.J. Walker, N. Webb, P. Wetzel, S. Weyers, A.V. Whipple, T.G. Whitham, G. Wohlfahrt, J.D. Wood, J. Yang, X. Yang, G. Yenni, Y. Zhang, Q. Zhang, and D. Zona. 2019. PhenoCam Dataset v2.0: Digital Camera Imagery from the PhenoCam Network, 2000-2018. ORNL DAAC, Oak Ridge, Tennessee, USA. https://doi.org/10.3334/ORNLDAAC/1689
Olson, D.M., E. Dinerstein, E.D. Wikramanayake, N.D. Burgess, G.V. Powell, E.C. Underwood, J.A. D'amico, I. Itoua, H.E. Strand, J.C. Morrison, and C.J. Loucks. 2001. Terrestrial Ecoregions of the World: A New Map of Life on Earth: A new global map of terrestrial ecoregions provides an innovative tool for conserving biodiversity. BioScience 51:933-938. https://doi.org/10.1641/0006-3568(2001)051[0933:TEOTWA]2.0.CO;2
Petach, A.R., M. Toomey, D.M. Aubrecht, and A.D. Richardson. 2014. Monitoring vegetation phenology using an infrared-enabled security camera. Agricultural and Forest Meteorology 195–196:143-151. https://doi.org/10.1016/j.agrformet.2014.05.008
Richardson, A.D., K. Hufkens, T. Milliman, D.M. Aubrecht, M. Chen, J.M. Gray, M. R. Johnston, T.F. Keenan, S.T. Klosterman, M. Kosmala, E.K. Melaas, M.A. Friedl, and S. Frolking. 2018. Tracking vegetation phenology across diverse North American biomes using PhenoCam imagery. Scientific Data 5:180028. https://doi.org/10.1038/sdata.2018.28
Seyednasrollah, B., A.M. Young, K. Hufkens, T. Milliman, M.A. Friedl, S. Frolking, and A.D. Richardson. 2019a. Tracking vegetation phenology across diverse biomes using PhenoCam imagery: The PhenoCam Dataset v2.0. Scientific Data 6:222. https://doi.org/10.1038/s41597-019-0229-9
Seyednasrollah, B., A.M. Young, K. Hufkens, T. Milliman, M.A. Friedl, S. Frolking, A.D. Richardson, M. Abraha, D.W. Allen, M. Apple, M.A. Arain, J. Baker, J.M. Baker, D. Baldocchi, C.J. Bernacchi, J. Bhattacharjee, P. Blanken, D.D. Bosch, R. Boughton, E.H. Boughton, R.F. Brown, D.M. Browning, N. Brunsell, S.P. Burns, M. Cavagna, H. Chu, P.E. Clark, B.J. Conrad, E. Cremonese, D. Debinski, A.R. Desai, R. Diaz-Delgado, L. Duchesne, A.L. Dunn, D.M. Eissenstat, T. El-Madany, D.S.S. Ellum, S.M. Ernest, A. Esposito, L. Fenstermaker, L.B. Flanagan, B. Forsythe, J. Gallagher, D. Gianelle, T. Griffis, P. Groffman, L. Gu, J. Guillemot, M. Halpin, P.J. Hanson, D. Hemming, A.A. Hove, E.R. Humphreys, A. Jaimes-Hernandez, A.A. Jaradat, J. Johnson, E. Keel, V.R. Kelly, J.W. Kirchner, P.B. Kirchner, M. Knapp, M. Krassovski, O. Langvall, G. Lanthier, G.l. Maire, E. Magliulo, T.A. Martin, B. McNeil, G.A. Meyer, M. Migliavacca, B.P. Mohanty, C.E. Moore, R. Mudd, J.W. Munger, Z.E. Murrell, Z. Nesic, H.S. Neufeld, T.L. O'Halloran, W. Oechel, A.C. Oishi, W.W. Oswald, T.D. Perkins, M.L. Reba, B. Rundquist, B.R. Runkle, E.S. Russell, E.J. Sadler, A. Saha, N.Z. Saliendra, L. Schmalbeck, M.D. Schwartz, R.L. Scott, E.M. Smith, O. Sonnentag, P. Stoy, S. Strachan, K. Suvocarev, J.E. Thom, R.Q. Thomas, A.K. Van den berg, R. Vargas, J. Verfaillie, C.S. Vogel, J.J. Walker, N. Webb, P. Wetzel, S. Weyers, A.V. Whipple, T.G. Whitham, G. Wohlfahrt, J.D. Wood, S. Wolf, J. Yang, X. Yang, G. Yenni, Y. Zhang, Q. Zhang, and D. Zona. 2019b. PhenoCam Dataset v2.0: Vegetation Phenology from Digital Camera Imagery, 2000-2018. ORNL DAAC, Oak Ridge, Tennessee, USA. https://doi.org/10.3334/ORNLDAAC/1674
Young, A.M., T. Milliman, K. Hufkens, K. Ballou, C. Coffey, K. Begay, M. Fell, M. Javadian, A.K. Post, C. Schädel, Z. Vladich, O. Zimmerman, D.M. Browning, C.R. Florian, M.A. Friedl, M. Moon, M.D. SanClements, B. Seyednasrollah, and A.D. Richardson. 2024. Tracking vegetation phenology across diverse biomes using PhenoCam imagery: The PhenoCam Dataset v3.0. Submitted to Earth System Science Data.
Dataset Revisions
| Version | Release Date | Revision Notes |
|---|---|---|
| 3 | 2024-03-10 | Time series extended to 2023. Total sites increased to 738 across global distribution. Added a new set of simplified data products and the Camera NDVI statistics. |
| 2 | 2019-09-04 | Time series was extended to 2018. Number of sites increased from 133 to 393. https://doi.org/10.3334/ORNLDAAC/1674. |
| 1 | 2017-12-27 | Original publication: https://doi.org/10.3334/ORNLDAAC/1511 |