Documentation Revision Date: 2020-12-02
Dataset Version: 1
Summary
This dataset contains a total of 2,979 data files: 2,882 are georeferenced polygon vector files in the Open Geospatial Consortium (OGC) GeoPackage (*.gpkg) format, and 96 are ESRI Shapefiles stored in a compressed (*.zip) format.
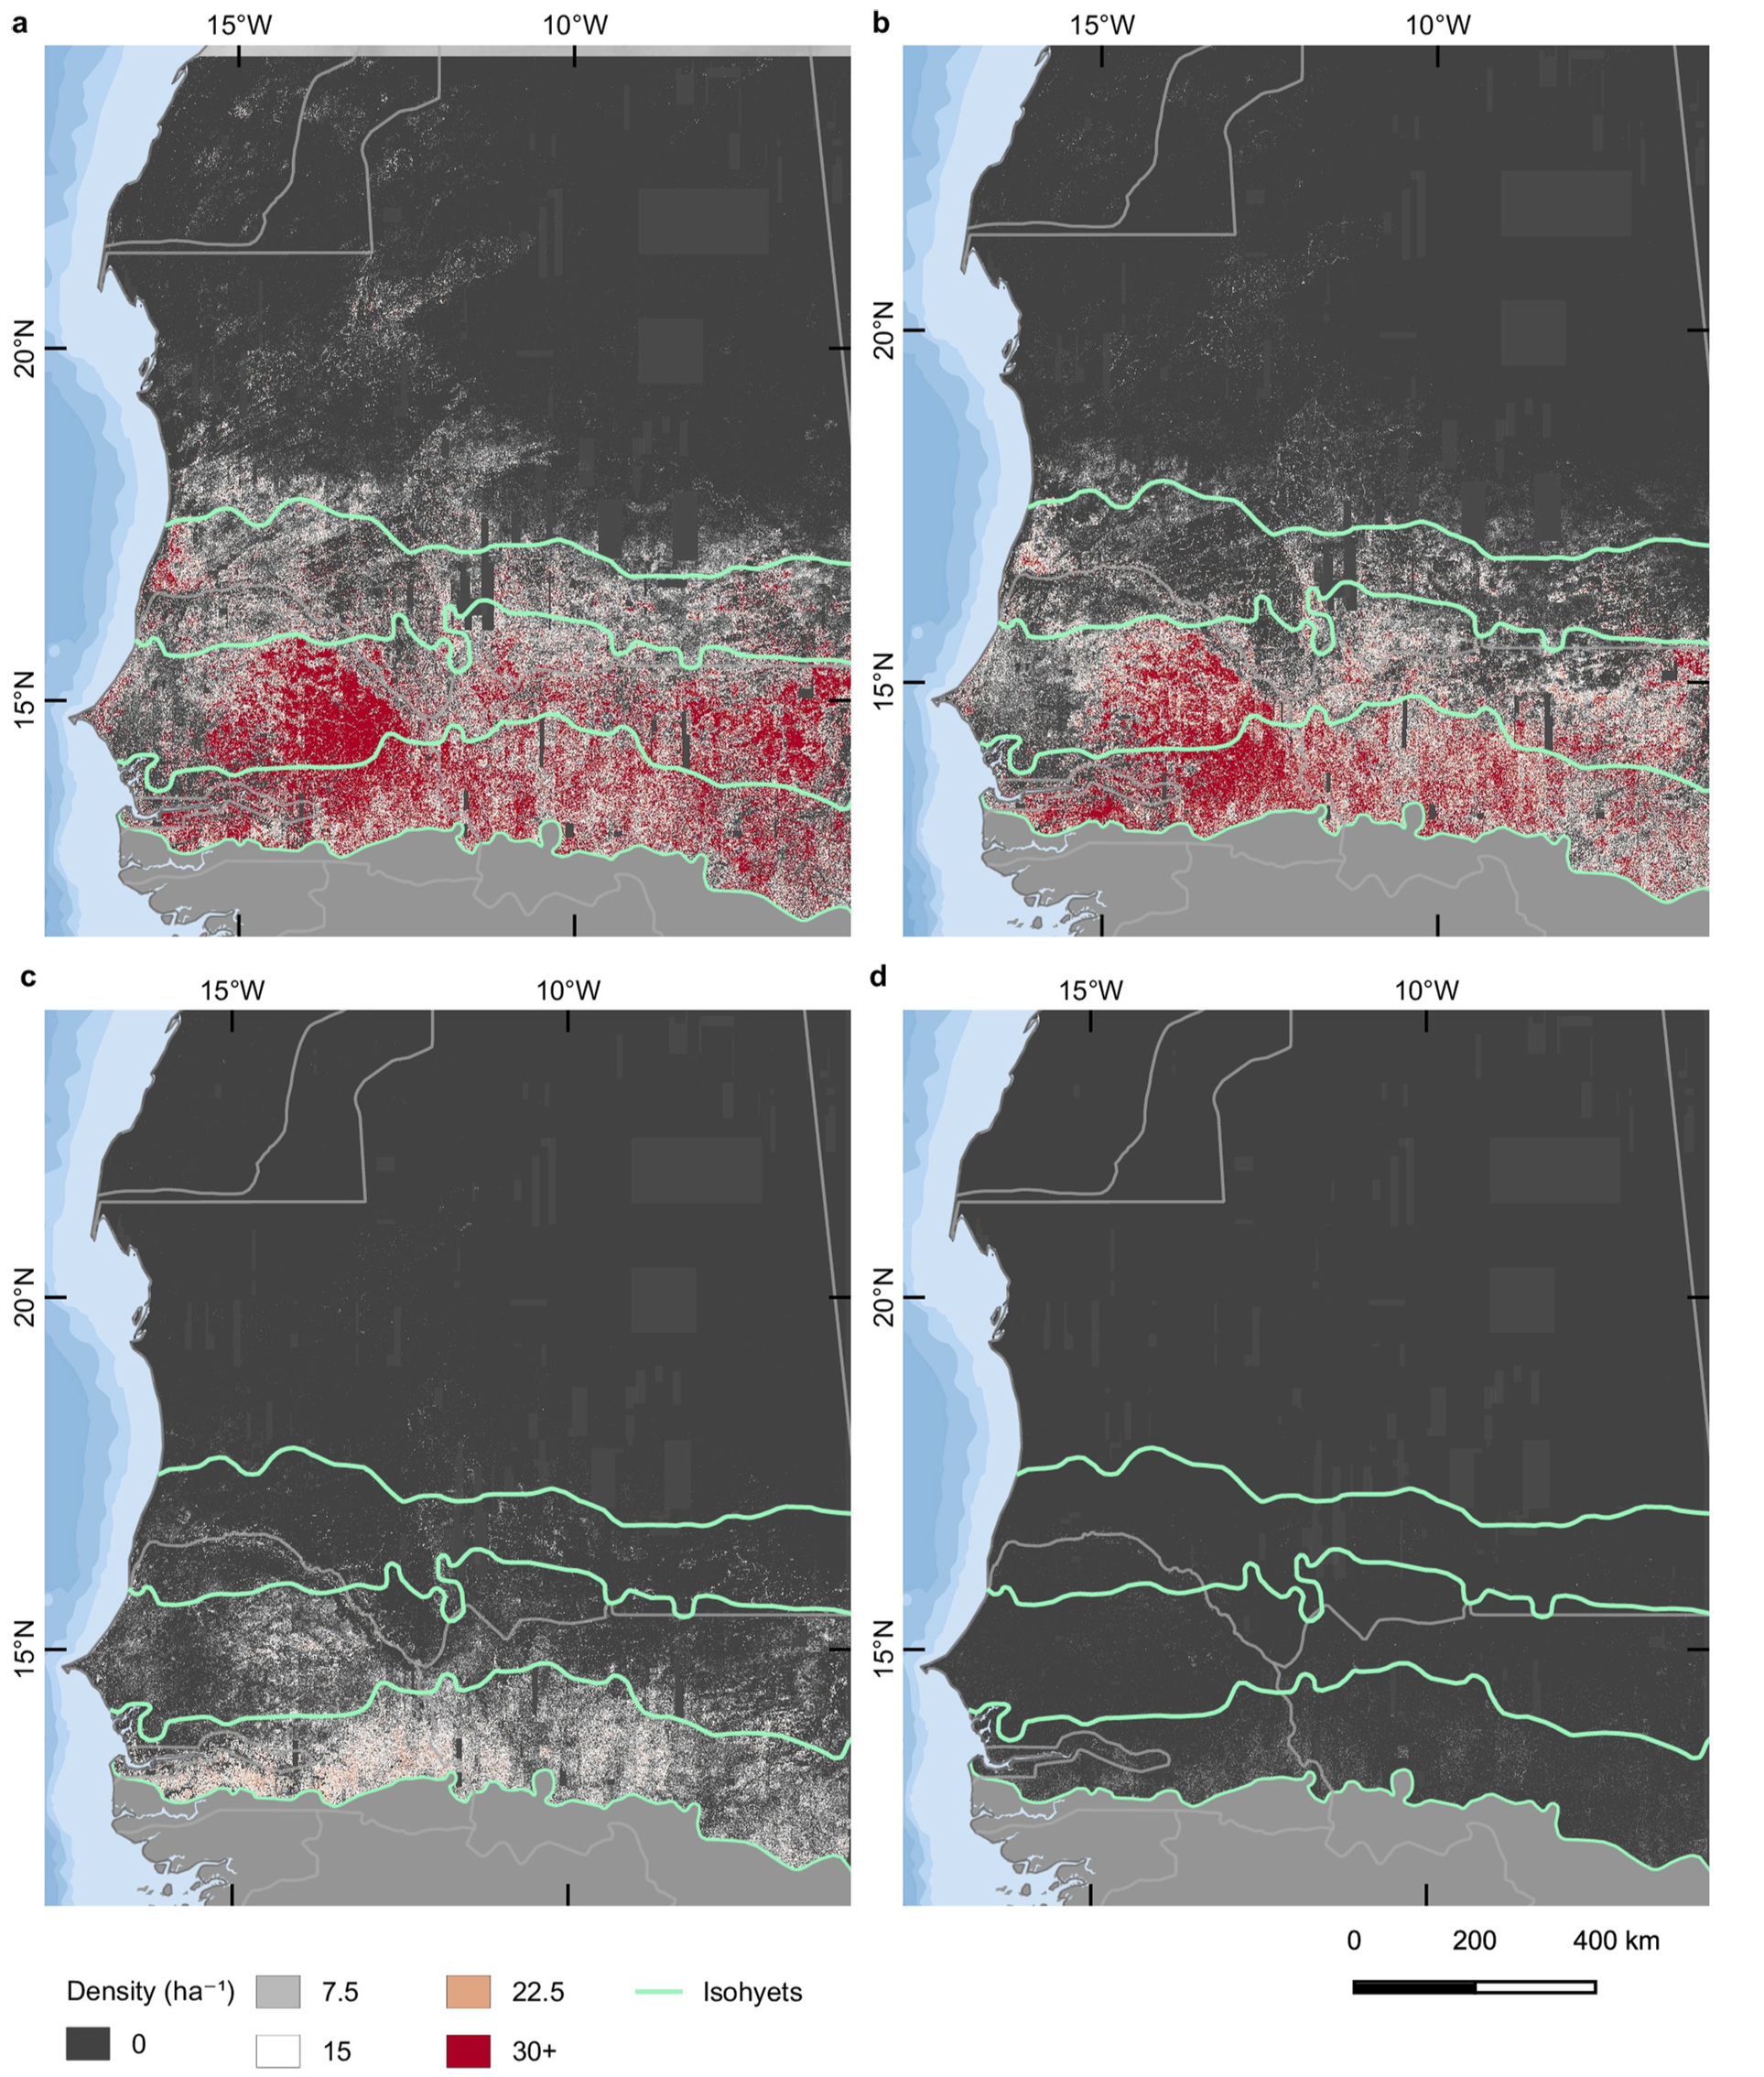
Figure 1. The tree density per hectare is shown for different crown size classes: (a) 3-15 m2, (b) 15-50 m2, (c) 50-200 m2, (d) >200 m2. Source: Brandt et al. (2020)
Citation
Brandt, M., C.J. Tucker, A. Kariryaa, K. Rasmussen, C. Abel, J.L. Small, J. Chave, L.V. Rasmussen, P. Hiernaux, A.A. Diouf, L. Kergoat, O. Mertz, C. Igel, F. Gieseke, J. Schöning, S. Li, K.A. Melocik, J.R. Meyer, S. Sinno, E. Romero, E.N. Glennie, A. Montagu, M. Dendoncker, and R. Fensholt. 2020. An Unexpectedly Large Count of Trees in the West African Sahara and Sahel. ORNL DAAC, Oak Ridge, Tennessee, USA. https://doi.org/10.3334/ORNLDAAC/1832
Table of Contents
- Dataset Overview
- Data Characteristics
- Application and Derivation
- Quality Assessment
- Data Acquisition, Materials, and Methods
- Data Access
- References
Dataset Overview
This dataset provides georeferenced polygon vectors of individual tree canopy geometries for dryland areas in West African Sahara and Sahel that were derived using deep learning applied to 50-cm resolution satellite imagery. More than 1.8 billion non-forest trees (i.e., woody plants with a crown size over 3 m2) over about 1.3 million km2 were identified from panchromatic and pansharpened normalized difference vegetation index (NDVI) images at 0.5-m spatial resolution using an automatic tree detection framework based on supervised deep-learning techniques. Combined with existing and future fieldwork, these data lay the foundation for a comprehensive database that contains information on all individual trees outside of forests and could provide accurate estimates of woody carbon in arid and semi-arid areas throughout the Earth for the first time.
Related Publication
Brandt, M., C.J. Tucker, A. Kariryaa, K. Rasmussen, C. Abel, J. Small, et al. 2020. An unexpectedly large count of trees in the West African Sahara and Sahel. Nature. https://doi.org/10.1038/s41586-020-2824-5
Acknowledgments
This work was supported by Advancing Collaborative Connections for Earth System Science (grant 880292.04.02.01.01).
Data Characteristics
Spatial Coverage: Sahara, Sahel, and sub-humid zone of West Africa
Spatial Resolution: Variable polygon sizes
Temporal Coverage: 2005-11-01 to 2018-03-31
Temporal Resolution: One-time estimate
Study Area: Latitude and longitude are given in decimal degrees.
| Site | Northernmost Latitude | Southernmost Latitude | Easternmost Longitude | Westernmost Longitude |
|---|---|---|---|---|
| West Africa | 24.02936587 | 11.35311634 | -5.485132356 | -18 |
Data File Information
There are 2,979 data files total: 2,882 files in Georeferenced Polygon Vector (*.gpkg; https://www.geopackage.org/) format and 96 compressed ESRI shapefiles (*.zip). The file naming convention includes the zone, row, tile, and subtile, where
zone = 28N (EPSG:32628) or 29N (EPSG:32629); the UTM Zone
row = 001 through 014; up to fourteen rows
tile = 001 through 007; up to seven 100 km2 tiles
subtile = 1_1 through 4_4; up to sixteen 25 km2 subtiles
Table 1. Data file names and descriptions.
| File Names | Description | Attributes |
|---|---|---|
| SSA_zone_GE01-QB02-WV02-WV03_row_tile_mosaic_subtile.gpkg | 2,794 "tree" files containing georeferenced polygon vectors of tree canopy geometries. | latitude and longitude of the centroid, and the area of the polygon |
| SSA_zone_GE01-QB02-WV02-WV03_PAN_NDVI_row_tile_mosaic_cutlines.zip | 184 "cutline" files containing georeferenced polygon vectors of the input satellite image spatial extent. Decompress these files to access the corresponding ESRI shapefile (*.shp). | satellite image metadata |
| tilemap.gpkg | 1 file containing georeferenced polygon vectors of the dataset's spatial extent. Use this file to identify the zone, row, tile, and subtile of an area of interest. | tile name that corresponds to the "tree" (GPKG) file |
Data File Details
The projection used is UTM zone 28N (EPSG 32628) and 29N (EPSG 32629).
Companion Files
The Python script gpkg_to_esri.py can be used to convert a given geopackage file into a shapefile. ESRI product geoprocessing tools might not reliably convert GPKG into SHP; thus, using this script is recommended. Files can also be converted between formats using OSGeo's OGR (https://gdal.org/). NOTE: The geopackage files may exceed the shapefile size specification limit and are not guaranteed to be compatible with ESRI tooling. A small number of feature geometries have been flagged as invalid by Shapley's validation tooling. We advise the standard practice of confirming feature and geometry validity before processing.
Application and Derivation
Most attention is devoted to forests, which are often defined as areas of more than 25% canopy closure. However, trees from outside of forest areas (non-forest trees) support the livelihoods of a rapidly increasing population and are an essential factor for the survival and biodiversity of flora and fauna. Whereas the monitoring of forests has been carried out on a routine basis, attempts to quantify the density of trees outside of forests have been limited to small sample sizes or local field surveys. The limited attention devoted to the quantification of individual trees in drylands has led to misinterpretations of the extent of canopy cover, and to confusion related to the definition of canopy cover. Products designed to assess global tree cover are poorly designed to quantify tree cover in drylands, which has resulted in the prevailing view that dryland areas such as the Sahara or Sahel are largely free of trees. This dataset provides
a wall-to-wall identification of non-forest trees (defined as woody plants with a crown size over 3 m2) in the West African
Sahara, Sahel, and sub-humid zone. See Brandt et al. (2020) for additional information.
Quality Assessment
An automatic tree detection framework was based on deep learning techniques, and fully convolutional networks were used as one of the key algorithmic building blocks. The model was trained with 89,899 manually delineated tree crowns on 0.5 m satellite imagery. The model was found to operate at an accuracy of 95% on the training data, which implies no noticeable difference between the manual annotation and the model results. The visibility of a shadow and a minimum crown size of 3 m2 were used as criteria for trees to be included in the assessment, which excludes small bushes that are difficult to separate from perennial grass tussocks. The disaggregation of clumped trees was achieved by giving the spaces between crowns a larger weight than other spaces during the learning process of the model. See Brandt et al. (2020) for additional information.
Data Acquisition, Materials, and Methods
The following is a brief summary of the methods described in Brandt et al. (2020). Please see the manuscript for details.
The mapping of woody plants at the level of single trees was achieved by the use of satellite data at very high spatial resolution (0.5 m) from DigitalGlobe satellites, combined with modern machine-learning techniques. More than 50,000 DigitalGlobe multispectral images from the QuickBird-2, GeoEye-1, WorldView-2 and WorldView-3 satellites, were collected from 2005–2018 (in November to March) from 12° to 24° N latitude within Universal Transverse Mercator zones 28N and 29N (provided under the NextView license from the National Geospatial Intelligence). Normalized difference vegetation index (NDVI) images were used to distinguish tree crowns from the non-vegetated background because the images were taken from a period during which only woody plants are photosynthetically active in the study area. A set of decision rules was applied to select images for the mosaic, consisting of 25 × 25 km tiles. This resulted in 11,128 images that were used for the study (Fig. 2).
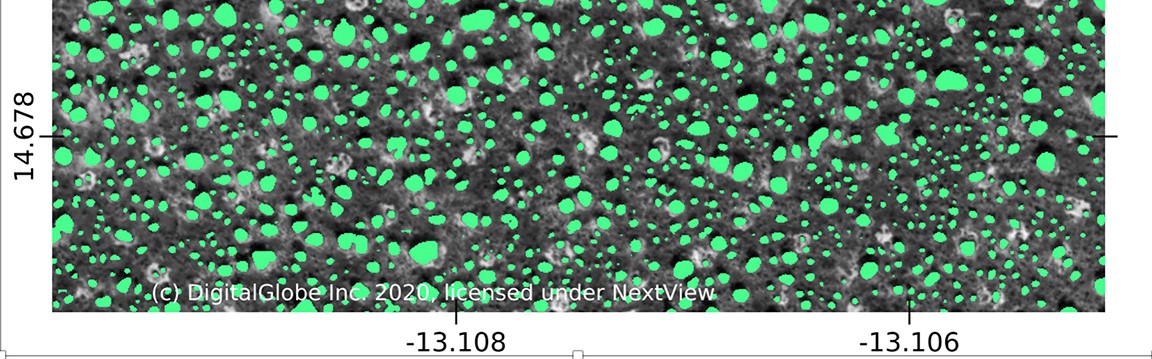
Figure 2. Location of individual trees and their crown areas in a location near 14.678 (lat), -13.107 (lon).
The neural network model (UNet; publicly available at https://doi.org/10.5281/zenodo.3978185) was used to automatically segment the tree crowns—that is, to detect tree crowns in the input images. The segmented areas were then converted to polygons for counting the trees and measuring their crown size. Using machine learning coupled to training data of 89,899 manually delineated and annotated trees, the location of individual trees over 1,300,000 km2 and their crown area were determined from the input images. Every tree with a crown area >3 m2 was enumerated resulting in 1,837,565,501 trees. The neural network model (UNet) and other essential codes used in the study are also being actively managed and improved by the project. For the latest UNet and related codes, please refer to Github code repository https://github.com/ankitkariryaa/An-unexpectedly-large-count-of-trees-in-the-western-Sahara-and-Sahel/tree/v1.0.0.
NOTE: The input mosaics processed by the neural network were segmented into two groups, for each UTM zone, 28N and 29N respectively, and overlap at their boundary. A tree canopy in the overlapping region may be described by vector polygons in two separate GeoPackage data files. To prevent double counting these canopies in analysis, special attention is required to properly handle the overlapping region. A suggested approach, which was used in Brandt et al. (2020), is that all canopies are rasterized to 100m^2 resolution images (in the WGS 84 coordinate reference system) and use nearest-neighbor resampling method to mosaic overlapping images into a single mosaic, which spans the entire study area.
Data Access
These data are available through the Oak Ridge National Laboratory (ORNL) Distributed Active Archive Center (DAAC).
An Unexpectedly Large Count of Trees in the West African Sahara and Sahel
Contact for Data Center Access Information:
- E-mail: uso@daac.ornl.gov
- Telephone: +1 (865) 241-3952
References
Brandt, M., C.J. Tucker, A. Kariryaa, K. Rasmussen, C. Abel, J. Small, et al. 2020. An unexpectedly large count of trees in the West African Sahara and Sahel. Nature. https://doi.org/10.1038/s41586-020-2824-5
Hansen, M.C., P.V. Potapov, R. Moore, M. Hancher, S.A. Turubanova, A. Tyukavina, D. Thau, S.V. Stehman, S.J. Goetz, T.R. Loveland, and A. Kommareddy. 2013. High-resolution global maps of 21st-century forest cover change. Science, 342(6160):850-853. https://doi.org/10.1126/science.1244693