Documentation Revision Date: 2020-03-05
Dataset Version: 1
Summary
This data product was developed for the High Resolution Model Intercomparison Project (HighResMIP v1.0) of the Coupled Model Intercomparison Project 6 (CMIP6).
The monthly mean LAI data are provided in one NetCDF (.nc4) format file.
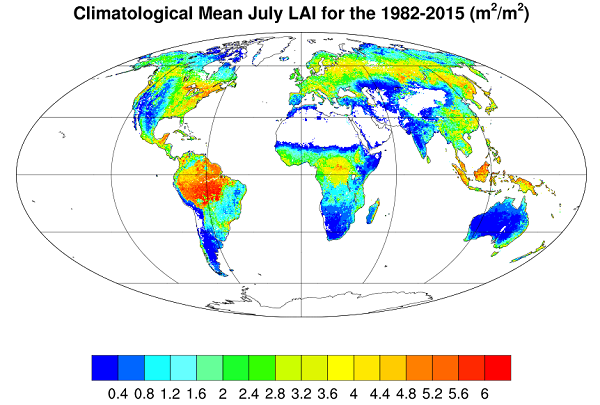
Figure 1. Mean LAI (m2/m2) for July for the period 1982-2015.
Citation
Mao, J., and B. Yan. 2019. Global Monthly Mean Leaf Area Index Climatology, 1981-2015. ORNL DAAC, Oak Ridge, Tennessee, USA. https://doi.org/10.3334/ORNLDAAC/1653
Table of Contents
- Dataset Overview
- Data Characteristics
- Application and Derivation
- Quality Assessment
- Data Acquisition, Materials, and Methods
- Data Access
- References
Dataset Overview
This dataset provides a global 0.25 x 0.25-degree gridded monthly mean leaf area index (LAI) climatology as averaged over the period August 1981 to August 2015. The data were derived from the Advanced Very High Resolution Radiometer (AVHRR) Global Inventory Modeling and Mapping Studies (GIMMS) LAI3g version 2, a bi-weekly data product from 1981-2015 (GIMMS-LAI3g version 2). The LAI3g version 2 (raw) data were first regridded from 1/12 x 1/12-degree to 0.25 x 0.25-degree resolution, then processed to remove missing and unreasonable values, scaled to obtain LAI values, and the bi-weekly LAI values were averaged for every month. Finally, the monthly long-term mean LAI (from 1981-2015) was calculated based on the data availability. For example, the climatology for January was calculated as the average monthly value from 1982 to 2015, but the climatology for August was computed as the average monthly value from 1981 to 2015.
The data product was specially developed for the High Resolution Model Intercomparison Project (HighResMIP v1.0) of the Coupled Model Intercomparison Project 6 (CMIP6) (Haarsma et al., 2016).
Data Characteristics
Spatial Coverage: Global
Spatial Resolution: 0.25 x 0.25 degrees
Temporal Coverage: 1981-08-01 to 2015-08-31
Temporal Resolution: Monthly means averaged over the period 1981-08-01 to 2015-08-31.
Study Areas (All latitude and longitude given in decimal degrees)
|
Site |
Westernmost Longitude |
Easternmost Longitude |
Northernmost Latitude |
Southernmost Latitude |
|---|---|---|---|---|
|
Global |
-180 |
180 |
90 |
-90 |
Data File Information
There is one data file in NetCDF format (.nc4) with this dataset: LAI_mean_monthly_1981-2015.nc4.
The file provides the monthly mean LAI climatology at 0.25 x 0.25-degree resolution averaged over the period 1981-08-01 to 2015-08-31.
Data variables:
LAI: units of m2/m2 (cell_methods = time: mean within months; time: mean over years)
Time: Month (Time Step 1=August, 2=September, etc)
No data value: -9999
The values in each time step represent the climatology monthly LAI calculated over the entire range of years (1981-08 to 2015-08). The LAI values were averaged within each month of each year over that time, and then those values were averaged to represent each typical month during a year between 1981-08 and 2015-08, thus “climatology”. The twelve time steps are for each month out of a typical year. The data sources used to create this particular file began in August of 1981; therefore, the first time step in this netCDF is an average of LAI in all August months over the 1981-2015 time frame. The time steps then continue from there: September, October, November, December, January, February, March, April, May, June, and July (See Table 1. for more details)
| Time Step # in the netCDF file | Time Value defined in the netCDF file | Time Range defined in the netCDF file | Month Represented | Description |
|---|---|---|---|---|
| 1 | 1981-08-16 12:00 | 1981-08-01 00:00 to 2015-09-01 00:00 | August | Average of LAI in all August months during 1981-2015 |
| 2 | 1981-09-15 00:00 | 1981-09-01 00:00 to 2014-10-01 00:00 | September | Average of LAI in all September months during 1981-2015 |
| 3 | 1981-10-15 12:00 | 1981-10-01 00:00 to 2014-11-01 00:00 | October | Average of LAI in all October months during 1981-2015 |
| 4 | 1981-11-15 00:00 | 1981-11-01 00:00 to 2014-12-01 00:00 | November | Average of LAI in all November months during 1981-2015 |
| 5 | 1981-12-15 12:00 | 1981-12-01 00:00 to 2015-01-01 00:00 | December | Average of LAI in all December months during 1981-2015 |
| 6 | 1982-01-15 12:00 | 1982-01-01 00:00 to 2015-02-01 00:00 | January | Average of LAI in all January months during 1982-2015 |
| 7 | 1982-02-14 00:00 | 1982-02-01 00:00 to 2015-03-01 00:00 | February | Average of LAI in all February months during 1982-2015 |
| 8 | 1982-03-15 12:00 | 1982-03-01 00:00 to 2015-04-01 00:00 | March | Average of LAI in all March months during 1982-2015 |
| 9 | 1982-04-15 00:00 | 1982-04-01 00:00 to 2015-05-01 00:00 | April | Average of LAI in all April months during 1982-2015 |
| 10 | 1982-05-15 12:00 | 1982-05-01 00:00 to 2015-06-01 00:00 | May | Average of LAI in all May months during 1982-2015 |
| 11 | 1982-06-15 00:00 | 1982-06-01 00:00 to 2015-07-01 00:00 | June | Average of LAI in all June months during 1982-2015 |
| 12 | 1982-07-15 12:00 | 1982-07-01 00:00 to 2015-08-01 00:00 | July | Average of LAI in all July months during 1982-2015 |
Application and Derivation
Long-term global data sets of vegetation Leaf Area Index (LAI) are critical to monitoring global vegetation dynamics and for modeling exchanges of energy, mass and momentum between the land surface and planetary boundary layer. LAI is also a state variable in hydrological, ecological, biogeochemical and crop-yield models (Zhu et al., 2013).
Quality Assessment
A quality assessment was not provided for this product. See Zhu et al., (2013) for discussion of the validation of the AVHRR GIMMS LAI3g product.
Data Acquisition, Materials, and Methods
These mean monthly LAI data were derived from the AVHRR GIMMS LAI3g version 2 bi-weekly data product (1981/08 to 2015/08).
The development of the AVHRR GIMMS LAI3g product is described in Mao et al. (2013) and Zhu et al. (2013).
For the generation of the monthly mean LAI climatology provided in this dataset, the AVHRR GIMMS LAI3g version 2 bi-weekly (raw) data product was processed to identify missing values and unreasonable values higher than 7000 and to replace them with 0, and a scaling factor of 0.001 was applied to obtain the actual LAI. Then the raw 1/12 x 1/12 degree LAI3g data were regridded to 0.25 x 0.25 degree using the bilinear interpolation. Since the raw LAI3g data provide bi-weekly LAI, i.e., two LAI values for a certain grid every month, monthly mean LAI for the new product was calculated as the average of the two values for the remapped data. Finally, the 34-year or 35-year mean monthly LAI was then calculated for each month based on the data availability. For example, the climatology for January was calculated as the average of 1982 to 2015, but the climatology for August was computed as the average of 1981 to 2015.
Data Access
These data are available through the Oak Ridge National Laboratory (ORNL) Distributed Active Archive Center (DAAC).
Global Monthly Mean Leaf Area Index Climatology, 1981-2015
Contact for Data Center Access Information:
- E-mail: uso@daac.ornl.gov
- Telephone: +1 (865) 241-3952
References
Haarsma, R. J., Roberts, M. J., Vidale, P. L., Senior, C. A., Bellucci, A., Bao, Q., Chang, P., Corti, S., Fuckar, N. S., Guemas, V., von Hardenberg, J., Hazeleger, W., Kodama, C., Koenigk, T., Leung, L. R., Lu, J., Luo, J.-J., Mao, J., Mizielinski, M. S., Mizuta, R., Nobre, P., Satoh, M., Scoccimarro, E., Semmler, T., Small, J., and von Storch, J.-S. 2016. High Resolution Model Intercomparison Project (HighResMIP v1.0) for CMIP6, Geosci. Model Dev., 9, 4185-4208, https://doi.org/10.5194/gmd-9-4185-2016
Mao, J., X. Shi, P.E. Thornton, F.M. Hoffman, Z. Zhu, and R.B. Myneni. 2013. Global Latitudinal-Asymmetric Vegetation Growth Trends and Their Driving Mechanisms: 1982–2009. Remote Sens. 5, 1484-1497. https://doi.org/10.3390/rs5031484
Zhu, Z., J. Bi, Y. Pan, S. Ganguly, A. Anav, L. Xu, A. Samanta, S. Piao, R.R. Nemani, and R.B. Myeni. 2013. Global Data Sets of Vegetation Leaf Area Index (LAI)3g and Fraction of Photosynthetically Active Radiation (FPAR)3g Derived from Global Inventory Modeling and Mapping Studies (GIMMS) Normalized Difference Vegetation Index (NDVI3g) for the Period 1981 to 2011. Remote Sens. 5, 927-948. https://doi.org/10.3390/rs5020927