Documentation Revision Date: 2025-06-20
Dataset Version: 1
Summary
This dataset holds one Cloud optimized GeoTIFF and a shapefile in a compressed zip archive.
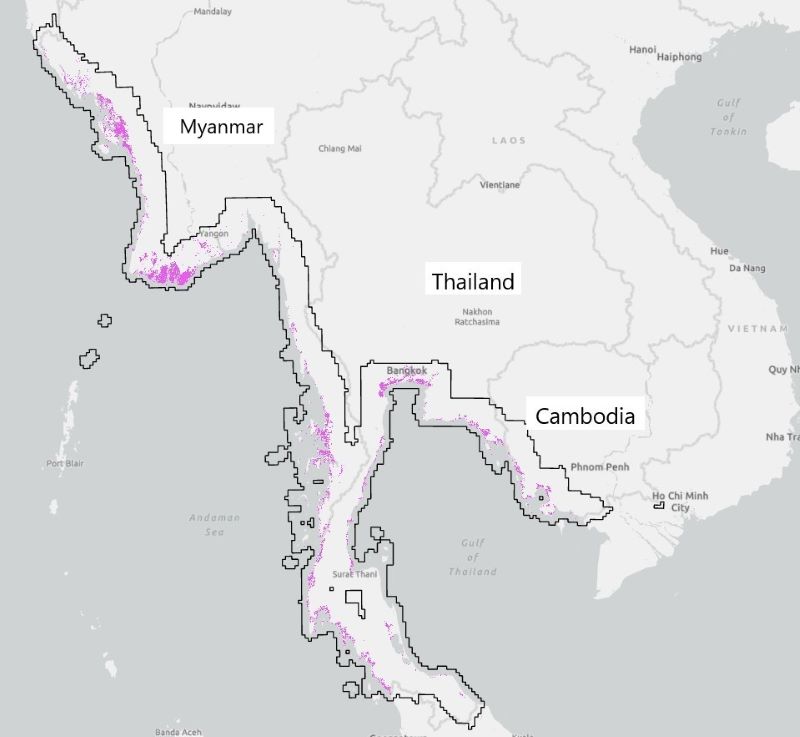
Figure 1. Regional extent of mangrove forest (magenta) on coasts of Myanmar, Thailand, and Cambodia for the period of 1972-1977. Black polygons outline the study area for this research. Source: Mangrove-Extent-LMSS-1972-1977-60m.tif.
Citation
Baltezar, P., P. Murillo-Sandoval, K. Cavanaugh, C.L. Doughty, D. Lagomasino, T. Tieng, M. Simard, and L. Fatoyinbo. 2024. Mangrove Extent Baseline from Landsat MSS, 1972-1977. ORNL DAAC, Oak Ridge, Tennessee, USA. https://doi.org/10.3334/ORNLDAAC/2329
Table of Contents
- Dataset Overview
- Data Characteristics
- Application and Derivation
- Quality Assessment
- Data Acquisition, Materials, and Methods
- Data Access
- References
Dataset Overview
This dataset includes a regional map of mangrove extent for Myanmar, Thailand, and Cambodia for the period of 1972-1977. The map was developed from Landsat 1-2 MSS Collection 1 Tier 2 imagery. Mangrove extent was generated using a Random Forest machine learning algorithm that effectively mapped a total of 15,420.51 km2 at the nominal Landsat scale of 30 m. This map of mangrove extent served as a baseline to analyze changes in mangrove distribution in Southeast Asia from 1970s through 2020 (Baltezar et al., 2023). Southeast Asia is home to some of the planet’s most carbon-dense and biodiverse mangrove ecosystems. There is still much uncertainty with regards to the timing and magnitude of changes in mangrove cover over the past 50 years. While there are several regional to global maps of mangrove extent in Southeast Asia for the early 21st century, data prior to the mid-1990s are limited due to the scarcity of Earth Observation (EO) data of sufficient quality and the historical limitations to publicly available EO data.
Project: Vegetation Collection
The ORNL DAAC compiles, archives, and distributes data on vegetation from local to global scales. Specific topic areas include: belowground vegetation characteristics and roots, vegetation biomass, fire and other disturbance, vegetation dynamics, land cover and land use change, vegetation characteristics, and NPP (Net Primary Production) data.
Related Publication:
Baltezar, P., P.J. Murillo-Sandoval, K.C. Cavanaugh, C. Doughty, D. Lagomasino, T. Tieng, M. Simard, and T. Fatoyinbo. 2023. A regional map of mangrove extent for Myanmar, Thailand, and Cambodia shows losses of 44% by 1996. Frontiers in Marine Science 10:1127720. https://doi.org/10.3389/fmars.2023.1127720
Related Dataset:
Landsat 1-2 MSS (LMSS) Collection 1 Tier 2 DN. Earth Resources Observation and Science (EROS) Center, U.S. Geological Survey, U.S. Department of Interior. https://www.usgs.gov/landsat-missions/landsat-collection-1
Acknowledgements:
This research was supported by NASA's Carbon Cycle & Ecosystems Focus Area (grant 20-LCLUC2020-0050, 'Global hotspots of change in mangrove forests') and part of this work was performed at the Jet Propulsion Laboratory under contract with NASA.
Data Characteristics
Study Areas: Coastlines of Myanmar, Thailand, and Cambodia
Spatial Resolution: 60 m
Temporal Coverage: 1972-01-01 to 1977-12-31
Temporal Resolution: One time estimate
Study Area: All latitude and longitude given in decimal degrees
| Site (Region) | Westernmost Longitude | Easternmost Longitude | Northernmost Latitude | Southernmost Latitude |
|---|---|---|---|---|
| Myanmar, Thailand, and Cambodia | 89.714 | 107.500 | 24.014 | 5.635 |
Data File Information
This dataset holds a shapefile in a compressed zip archive (*.zip) and one cloud optimized GeoTIFF(*.tif).
The shapefile is Coastal-Mangrove-Mask_shapefile.zip, a compressed Zip archive. This shapefile holds seven polygons that define the analysis mask used in this study (Figure 1).
The GeoTIFF is Mangrove-Extent-LMSS-1972-1977-60m.tif and maps the distribution of mangrove forest. It has these characteristics:
- Coordinate system: geographic coordinates, EPSG: 4326, WGS84 datum
- Spatial resolution: 0.000539 degree (~60 m)
- Number of bands: 1
- Pixel values: 1 = mangroves present, 0 = mangroves absent.
Pixels outside of the polygons delineated in the shapefile have value of 0 and should be considered no data.
Application and Derivation
Southeast Asia is home to some of the planet’s most carbon-dense and biodiverse mangrove ecosystems. There is still much uncertainty with regards to the timing and magnitude of changes in mangrove cover over the past 50 years. While there are several regional to global maps of mangrove extent in Southeast Asia for the early 21st century, data prior to the mid-1990s are limited due to the scarcity of Earth Observation (EO) data of sufficient quality and the historical limitations to publicly available EO data.
This map of mangrove extent served as a baseline to analyze changes in mangrove distribution in Southeast Asia from 1970s through 2020 (Baltezar et al., 2023).
Quality Assessment
The Random Forest classification of mangrove and non-mangrove was assessed using a random stratification approach. The area proportions for the mangrove and non-mangrove classes were 16% and 84% of the total study area, and the sample allocation was based on the smaller area proportion class (mangrove). The anticipated accuracy was 70% and a proportion of 20% for the mangrove class, and a target standard error of 1%. This leveraged a set of 300 samples for the non-mangrove class and a set of 67 samples for the mangrove class. Each sample was inspected in original Landsat MSS imagery and Google Earth imagery. Accuracy assessments indicated that the classification for the mangrove and non-mangrove class had a producer accuracy of 80% and 98%, respectively; user accuracy of 90% and 96%; and an overall accuracy of 95% .
Data Acquisition, Materials, and Methods
This dataset is a classification of mangrove extent using Landsat 1-2 MSS Tier 2 data (LMSS) from 1972-1977 for three Southeast Asian countries: Myanmar, Thailand, and Cambodia. Mangrove extent was generated using a Random Forest machine learning algorithm that effectively mapped a total of 15,420.51 km2 at the nominal Landsat scale of 30 m.
Coastal areas were delineated to subset the LMSS data needed for processing. A coastal mask was generated to include all potential mangrove areas (Figure 1). The mask included: the known extent of more current mangroves and coastal wetlands based on the global Wetland Extent Map (Mcowen et al., 2017) and the Global Mangrove Watch dataset (GMW, Bunting et al., 2022), areas within 10 km of the shoreline, based on the global shorelines data (Sayre et al., 2019) and areas lower than 20 m elevations based on the Shuttle Radar Topography Mission (SRTM) DEM (Farr et al., 2007; Yang et al., 2011).
LMSS scenes for 1972 to 1977 within the study area were selected and modified to mask out cloud cover and correct to top-of-atmosphere reflectance. These scenes were combined into a single mosaic and a series of vegetation indices were calculated to serve as input for classification model development: simple ratio (SR), normalized difference vegetation index (NDVI), the normalized difference water index (NDWI), the combined mangrove recognition index (CMRI), the soil-adjusted vegetation index (SAVI), the optimized soil-adjusted vegetation index (OSAVI), and the greenness chlorophyll vegetation index (GCVI).
Mangrove and non-mangrove areas were selected for model training then a Random Forests (RF) analysis was applied to develop a classification model. The RF model used 100 trees sampled at random for every 5th predictor, a minimum leaf population of 1, a bag fraction of 0.5 per tree, no limit on the maximum number of leaf nodes in each tree, a randomization seed value of 0, with the output mode set to a probability output. In the classified map, a 3 x 3 pixel majority filter was used to reduce noise.
To assess the classification, 300 samples for the non-mangrove class and a set of 67 samples for the mangrove class were visually compared to the original LMSS mosaic and imagery in Google Earth.
This map of mangrove extent in 1972-1977 served as a baseline to analyze changes in mangrove distribution in Southeast Asia from 1970s through 2020. Figures 2-4 illustrate results from that analysis (Baltezar et al., 2023).
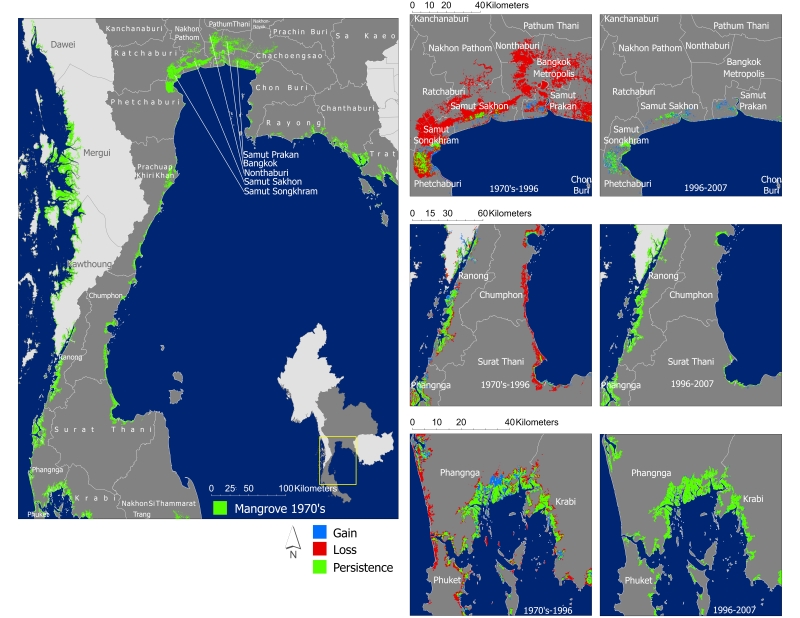
Figure 2. Gain, loss, and persistence of mangrove forest in Cambodia from 1970s to early 2000s. Source: Baltezar et al. (2023).
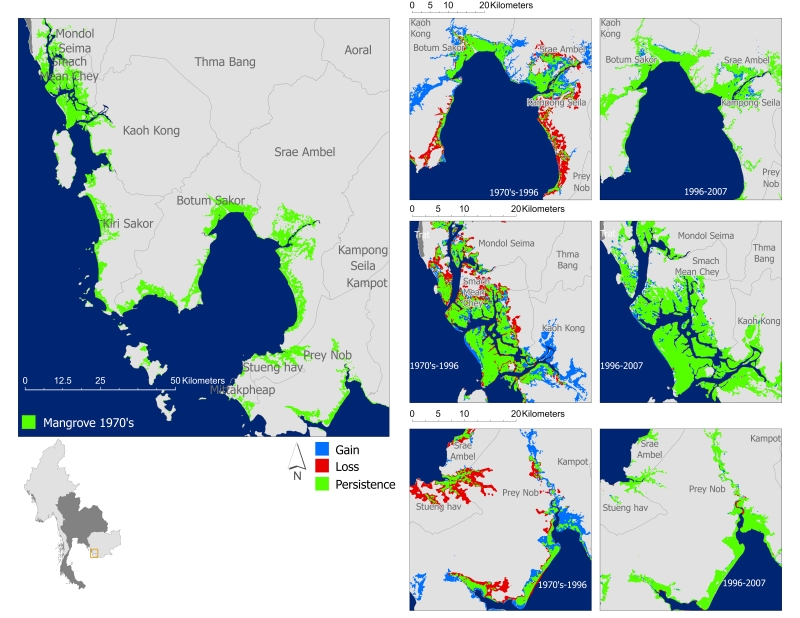
Figure 3. Gain, loss, and persistence of mangrove forest in Thailand from 1970s to early 2000s. Source: Baltezar et al. (2023).
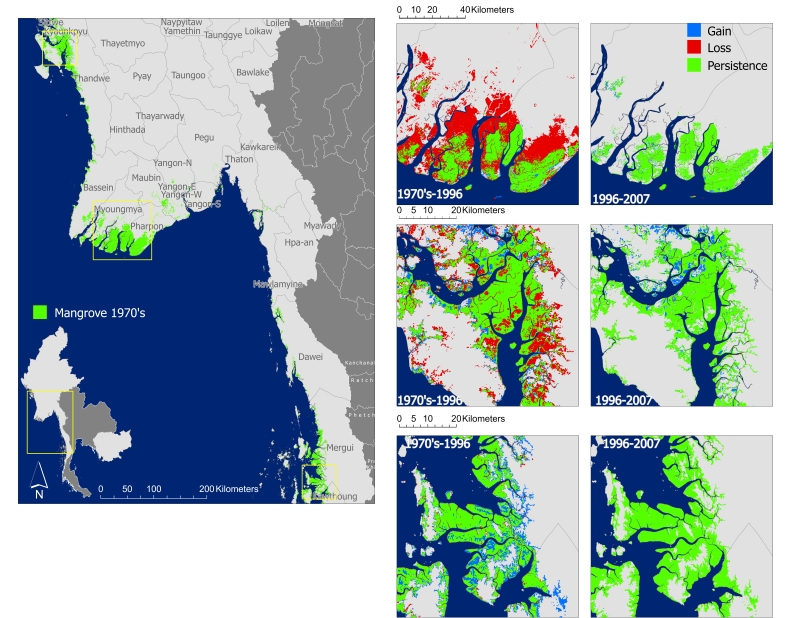
Figure 4. Gain, loss, and persistence of mangrove forest in Myanmar from 1970s to early 2000s. Source: Baltezar et al. (2023).
Details of the methods and results of this study are available from Baltezar et al. (2023).
Data Access
These data are available through the Oak Ridge National Laboratory (ORNL) Distributed Active Archive Center (DAAC).
Mangrove Extent Baseline from Landsat MSS, 1972-1977
Contact for Data Center Access Information:
- E-mail: uso@daac.ornl.gov
- Telephone: +1 (865) 241-3952
References
Baltezar, P., P.J. Murillo-Sandoval, K.C. Cavanaugh, C. Doughty, D. Lagomasino, T. Tieng, M. Simard, and T. Fatoyinbo. 2023. A regional map of mangrove extent for Myanmar, Thailand, and Cambodia shows losses of 44% by 1996. Frontiers in Marine Science 10. https://doi.org/10.3389/fmars.2023.1127720
Bunting, P., A. Rosenqvist, L. Hilarides, R.M. Lucas, N. Thomas, T. Tadono, T.A. Worthington, M. Spalding, N.J. Murray, and L.-M. Rebelo. 2022. Global Mangrove Extent Change 1996–2020: Global Mangrove Watch Version 3.0. Remote Sensing 14:3657. https://doi.org/10.3390/rs14153657
Landsat 1-2 MSS (LMSS) Collection 1 Tier 2 DN. Earth Resources Observation and Science (EROS) Center, U.S. Geological Survey, U.S. Department of Interior. https://www.usgs.gov/landsat-missions/landsat-collection-1
Mcowen, C., L. Weatherdon, J.-W. Bochove, E. Sullivan, S. Blyth, C. Zockler, D. Stanwell-Smith, N. Kingston, C. Martin, M. Spalding, and S. Fletcher. 2017. A global map of saltmarshes. Biodiversity Data Journal 5:e11764. https://doi.org/10.3897/BDJ.5.e11764
Sayre, R., S. Noble, S. Hamann, R. Smith, D. Wright, S. Breyer, K. Butler, K. Van Graafeiland, C. Frye, D. Karagulle, D. Hopkins, D. Stephens, K. Kelly, Z. Basher, D. Burton, J. Cress, K. Atkins, D.P. Van Sistine, B. Friesen, R. Allee, T. Allen, P. Aniello, I. Asaad, M.J. Costello, K. Goodin, P. Harris, M. Kavanaugh, H. Lillis, E. Manca, F. Muller-Karger, B. Nyberg, R. Parsons, J. Saarinen, J. Steiner, and A. Reed. 2018. A new 30 meter resolution global shoreline vector and associated global islands database for the development of standardized ecological coastal units. Journal of Operational Oceanography 12:S47–S56. https://doi.org/10.1080/1755876X.2018.1529714
Farr, T.G., P.A. Rosen, E. Caro, R. Crippen, R. Duren, S. Hensley, M. Kobrick, M. Paller, E. Rodriguez, L. Roth, D. Seal, S. Shaffer, J. Shimada, J. Umland, M. Werner, M. Oskin, D. Burbank, and D. Alsdorf. 2007. The Shuttle Radar Topography Mission. Reviews of Geophysics 45. https://doi.org/10.1029/2005RG000183
Yang, L., X. Meng, and X. Zhang. 2011. SRTM DEM and its application advances. International Journal of Remote Sensing 32:3875–3896. https://doi.org/10.1080/01431161003786016